Southcross Energy Partners L.P
Southcross Energy Partners L.P — Morgan Stanley Eagle Ford Energy Summit April 2013
18 slides from Southcross Energy Partners L.P's conference presentation, Apr 4, 2013
Slide 1: Morgan Stanley Eagle Ford Energy Summit April 2013
Morgan Stanley Eagle Ford Energy Summit April 2013
Slide 2: Cautionary Statements
Cautionary Statements This presentation contains forward-looking statements and information. These forward-looking statements, which in many instances can be identified by words such as “could,” “will,” “may,” “assume,” “forecast,” “position,” “predict,” “strategy,” “expect,” “intend,” “plan,” “esti
Slide 3: Southcross Overview
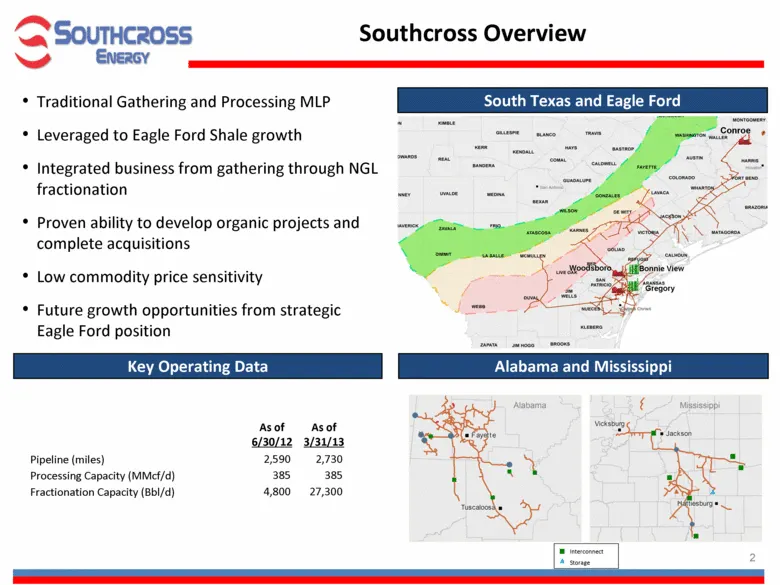
Southcross Overview Alabama and Mississippi South Texas and Eagle Ford Storage Interconnect Traditional Gathering and Processing MLP Leveraged to Eagle Ford Shale growth Integrated business from gathering through NGL fractionation Proven ability to develop organic projects and complete acquisitions
Slide 4: Southcross History
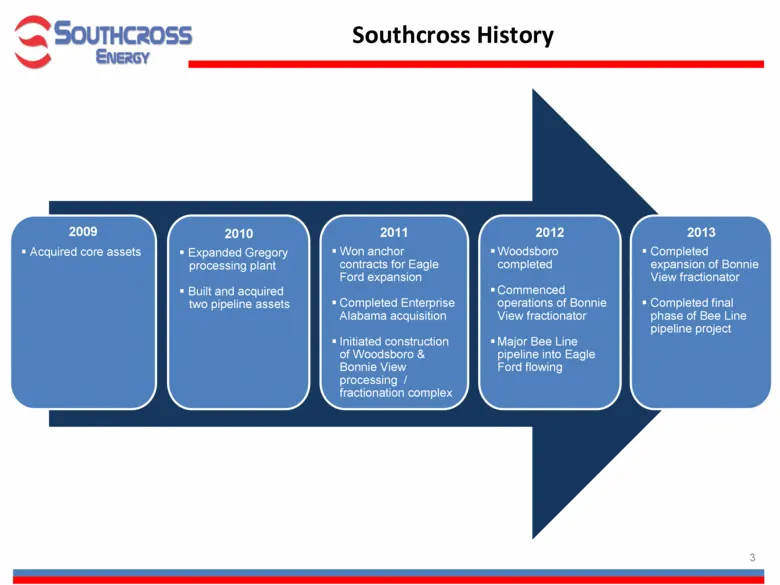
Southcross History 2009 Acquired core assets 2010 Expanded Gregory processing plant Built and acquired two pipeline assets 2011 Won anchor contracts for Eagle Ford expansion Completed Enterprise Alabama acquisition Initiated construction of Woodsboro & Bonnie View processing / fractionation complex
Slide 5: Integrated Assets with Scale and Scope
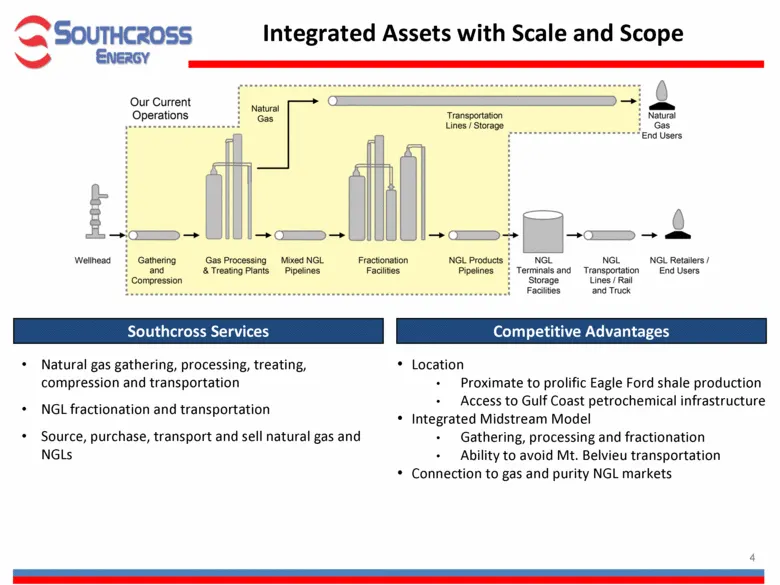
Integrated Assets with Scale and Scope Competitive Advantages Southcross Services Natural gas gathering, processing, treating, compression and transportation NGL fractionation and transportation Source, purchase, transport and sell natural gas and NGLs Location Proximate to prolific Eagle Ford shale
Slide 6: The Eagle Ford Shale
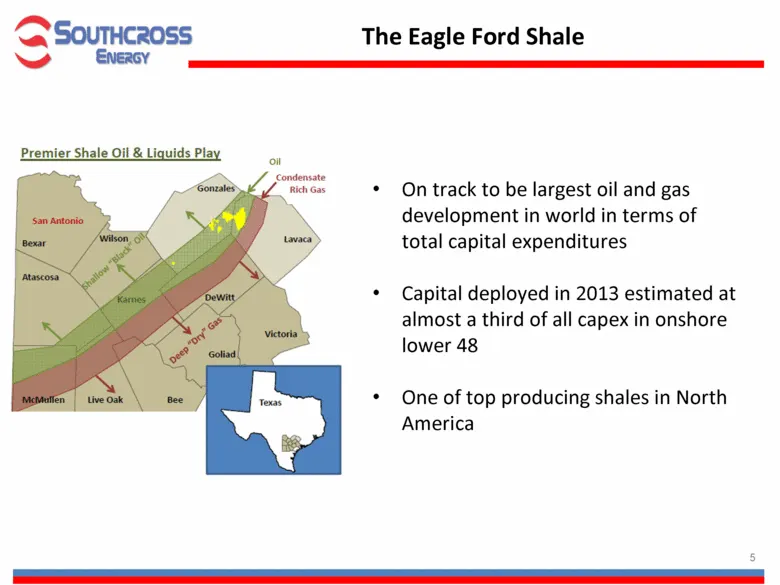
The Eagle Ford Shale On track to be largest oil and gas development in world in terms of total capital expenditures Capital deployed in 2013 estimated at almost a third of all capex in onshore lower 48 One of top producing shales in North America Oil
Slide 7: The Eagle Ford Shale
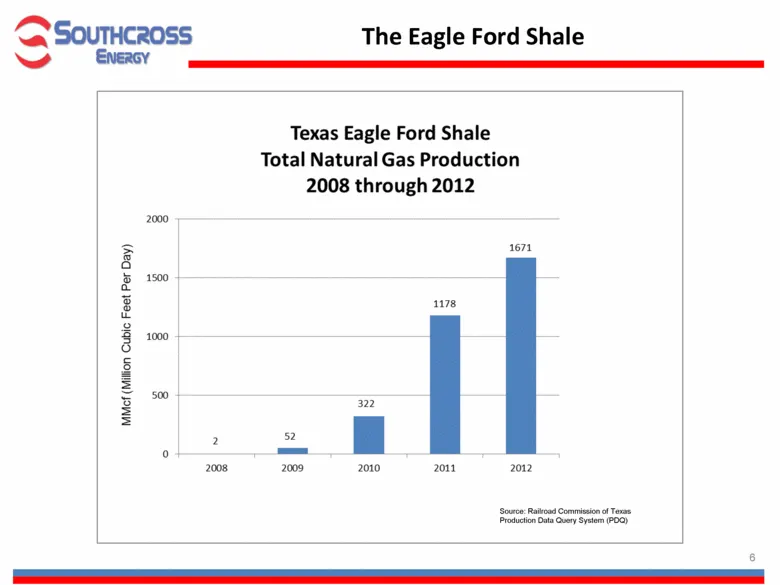
The Eagle Ford Shale Source: Railroad Commission of Texas Production Data Query System (PDQ)
Slide 8: Southcross in the Eagle Ford
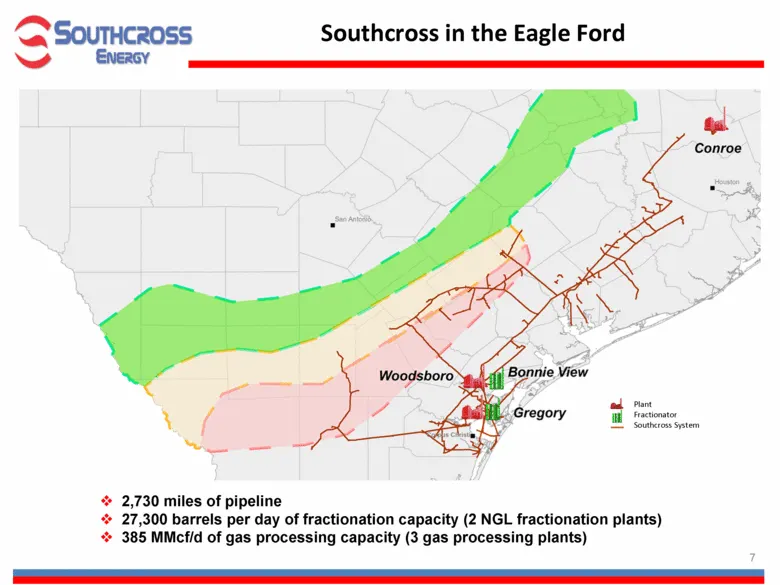
Southcross in the Eagle Ford 2,730 miles of pipeline 27,300 barrels per day of fractionation capacity (2 NGL fractionation plants) 385 MMcf/d of gas processing capacity (3 gas processing plants) Plant Fractionator Southcross System
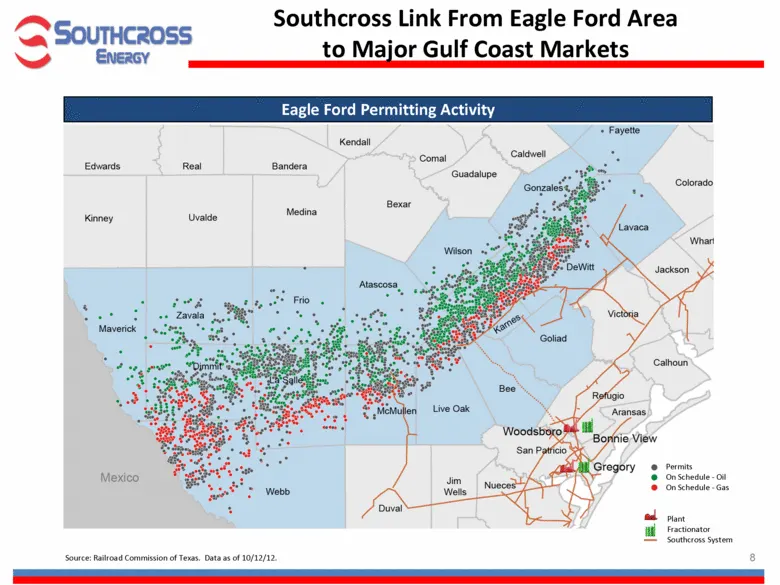
Slide 9: Southcross Link From Eagle Ford Area to Major Gulf Coast Markets
Southcross Link From Eagle Ford Area to Major Gulf Coast Markets Eagle Ford Permitting Activity Permits On Schedule - Oil On Schedule - Gas Source: Railroad Commission of Texas. Data as of 10/12/12. Plant Fractionator Southcross System
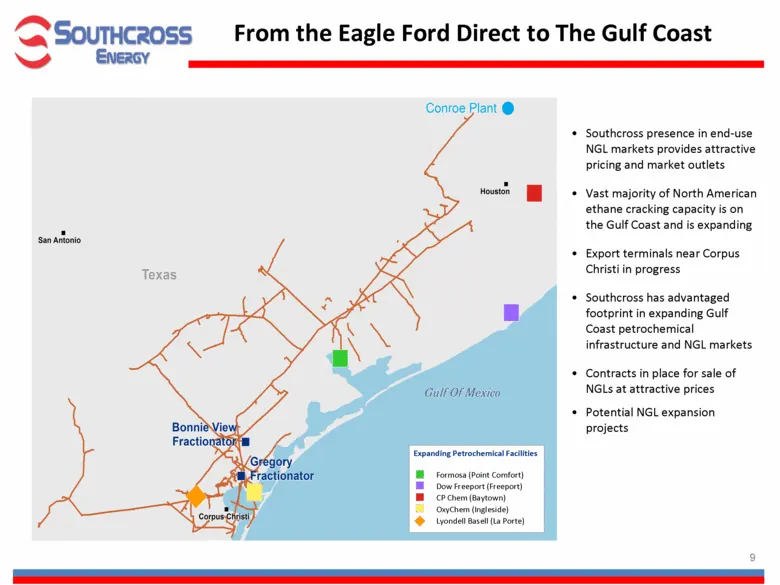
Slide 10: Southcross presence in end-use NGL markets provides attractive pricing and market outlets
Southcross presence in end-use NGL markets provides attractive pricing and market outlets Vast majority of North American ethane cracking capacity is on the Gulf Coast and is expanding Export terminals near Corpus Christi in progress Southcross has advantaged footprint in expanding Gulf Coast petroc
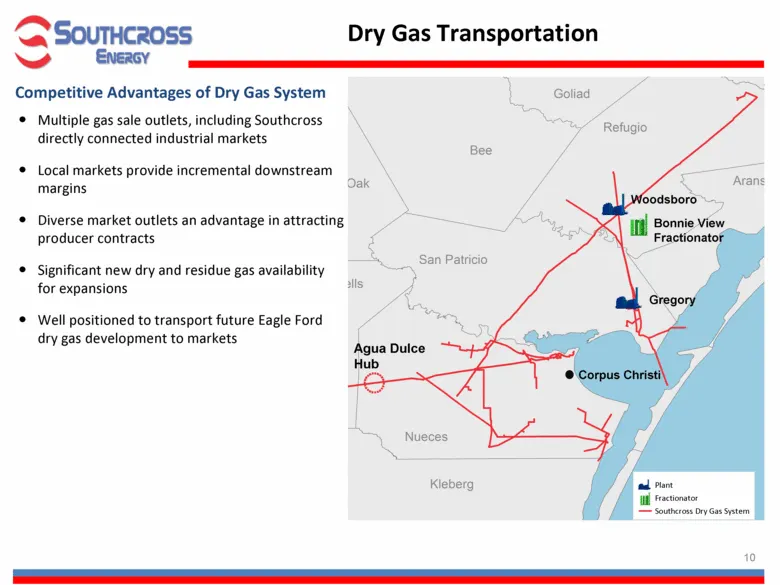
Slide 11: Multiple gas sale outlets, including directly connected industrial markets
Multiple gas sale outlets, including Southcross directly connected industrial markets Local markets provide incremental downstream margins Diverse market outlets an advantage in attracting producer contracts Significant new dry and residue gas availability for expansions Well positioned to transport
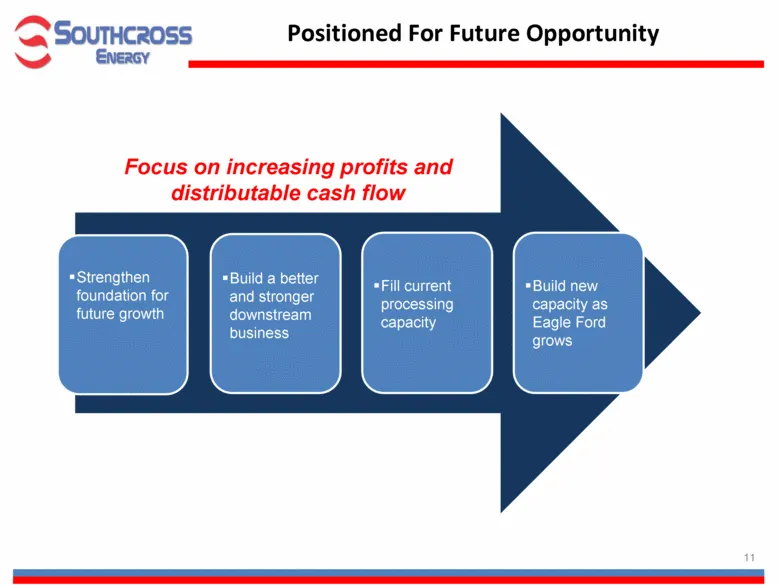
Slide 12: Positioned For Future Opportunity
Positioned For Future Opportunity Build a better and stronger downstream business Fill current processing capacity Build new capacity as Eagle Ford grows Focus on increasing profits and distributable cash flow Strengthen foundation for future growth
Slide 13: Southcross Investment Summary
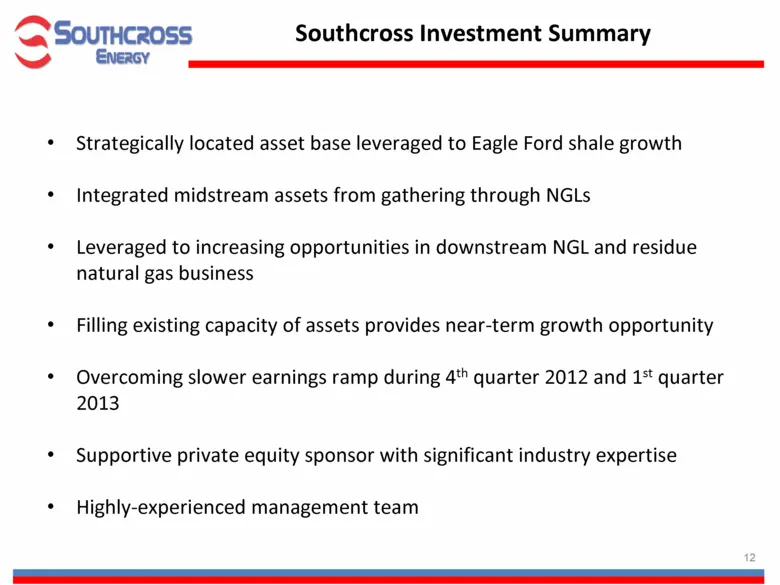
Southcross Investment Summary Strategically located asset base leveraged to Eagle Ford shale growth Integrated midstream assets from gathering through NGLs Leveraged to increasing opportunities in downstream NGL and residue natural gas business Filling existing capacity of assets provides near-term
Slide 14: Southcross' Fact Sheet
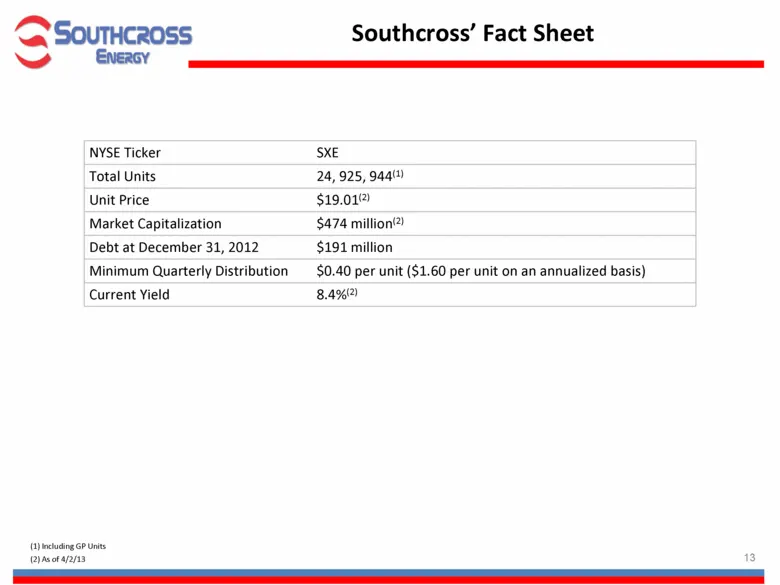
Southcross’ Fact Sheet NYSE Ticker SXE Total Units 24, 925, 944(1) Unit Price $19.01(2) Market Capitalization $474 million(2) Debt at December 31, 2012 $191 million Minimum Quarterly Distribution $0.40 per unit ($1.60 per unit on an annualized basis) Current Yield 8.4%(2) (2) As of 4/2/13 (1) Includ
Slide 15: Appendix
-~ Xe. SOUTHCROSS ww Enercy Appendix
Slide 16: Fourth Quarter and Year-End Summary
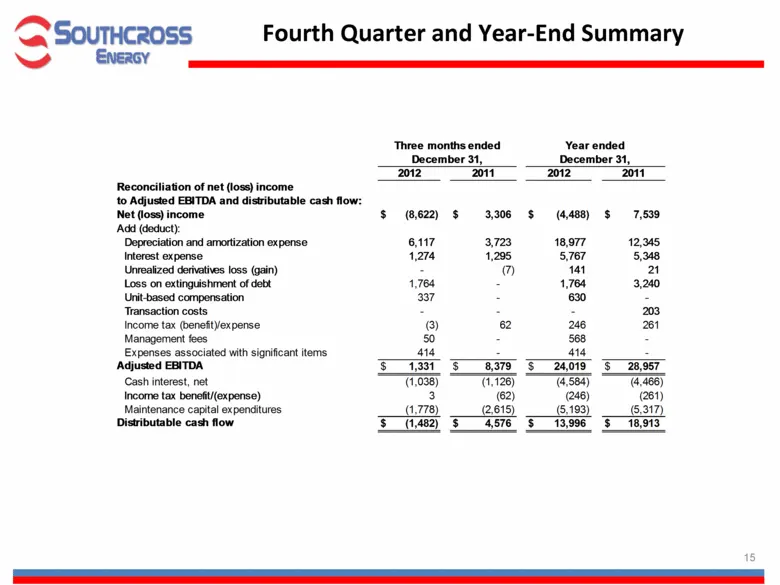
Fourth Quarter and Year-End Summary Reconciliation of net (loss) income to Adjusted EBITDA and distributable cash flow: Net (loss) income $ (8,622) $ 3,306 $ (4,488) $ 7,539 Add (deduct): Depreciation and amortization expense 6,117 3,723 18,977 12,345 Interest expense 1,274 1,295 5,767 5,348 Unreali
Slide 17: 2013 Guidance
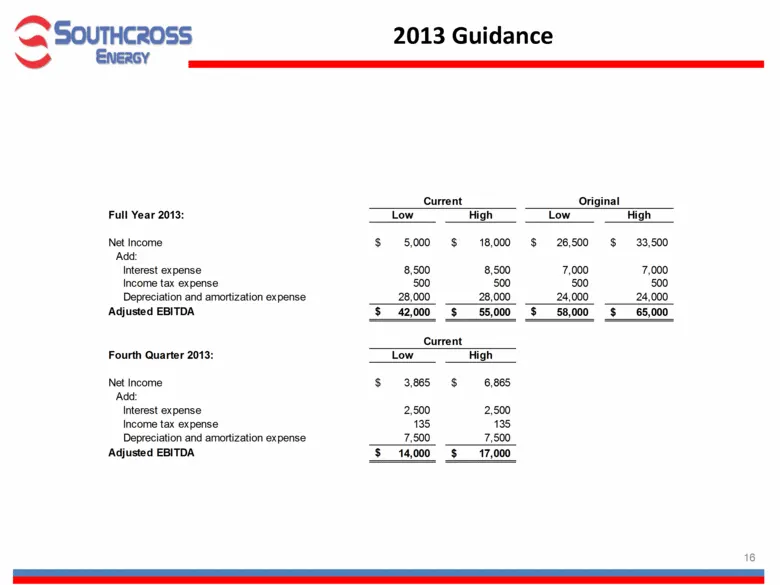
2013 Guidance Full Year 2013: Net Income $ 5,000 $ 18,000 $ 26,500 $ 33,500 Add: Interest expense 8,500 8,500 7,000 7,000 Income tax expense 500 500 500 500 Depreciation and amortization expense 28,000 28,000 24,000 24,000 Adjusted EBITDA $ 42,000 $ 55,000 $ 58,000 $ 65,000 Fourth Quarter 2013: Net
Slide 18: Non-GAAP Measures
Non-GAAP Measures SXE has used the non-GAAP financial measures of Adjusted EBITDA and gross operating margin. SXE provides reconciliations of these non-GAAP financial measures to their most directly comparable financial measures as calculated and presented in accordance with GAAP. SXE defines Adjust
Source: SEC EDGAR · 8-K filed Apr 4, 2013
More decks from Southcross Energy Partners L.P
 Merger or Acquisition (February 2018)10 slides · Feb 5, 2018
 Merger or Acquisition (November 2017)17 slides · Nov 2, 2017
 RBC Dallas Investor Meeting July 201526 slides · Jul 16, 2015
 NAPTP 2015 MLP Investor Conference27 slides · May 20, 2015
 Investor Presentation (April 2015)20 slides · Apr 21, 2015
 2014 Wells Fargo Energy Symposium23 slides · Dec 9, 2014