Sealed Air — Barclays Industrial Select Conference 2014
22 slides from Sealed Air's conference presentation, Feb 20, 2014

Slide 1: Barclays Industrial Select Conference, Company Overview
Jerome A. Peribere President & CEO Carol P. Lowe Senior Vice President & CFO Barclays Industrial Select Conference, February 20, 2014 Company Overview Exhibit 99.1

Slide 2: To create a better way for life
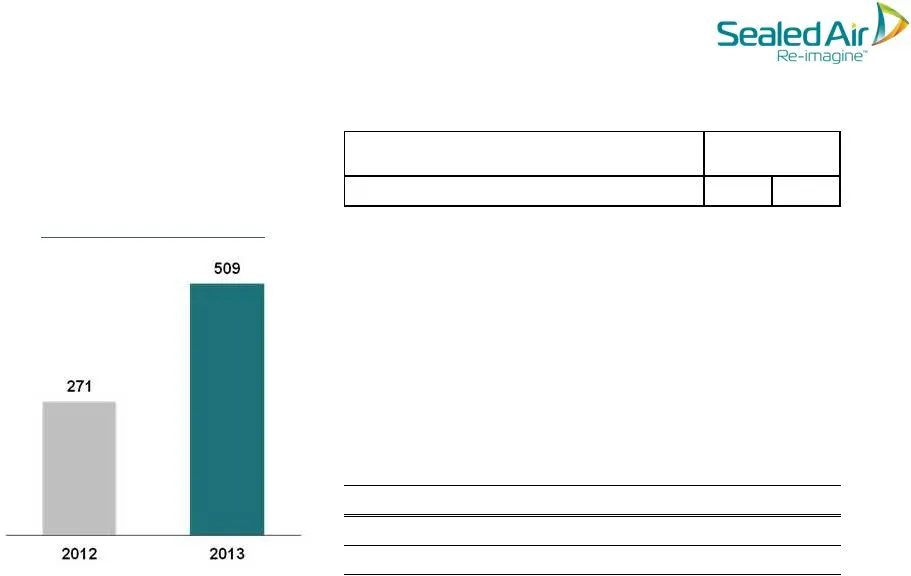
To create a better way for life We Re-imagine ™ the industries we serve to create a world that feels, tastes and works better. Total Sales: $7.7B; Free Cash Flow: $509M Adjusted EBITDA, excl SARs: $1.038B VISION: MISSION: FINANCIALS:
Slide 3: How We Deliver Value
• Engineered Solutions & Packaging Systems • Packaging Design & Testing • Lean Six Sigma Expertise • Service & Support • Packaging/Hygiene Solutions • Engineering Plant Designs • Full Range of Equipment/Systems • Manage Water, Energy • Building & Kitchen Care Services • Infection Prevention • Fabric
Slide 4: Who We Serve
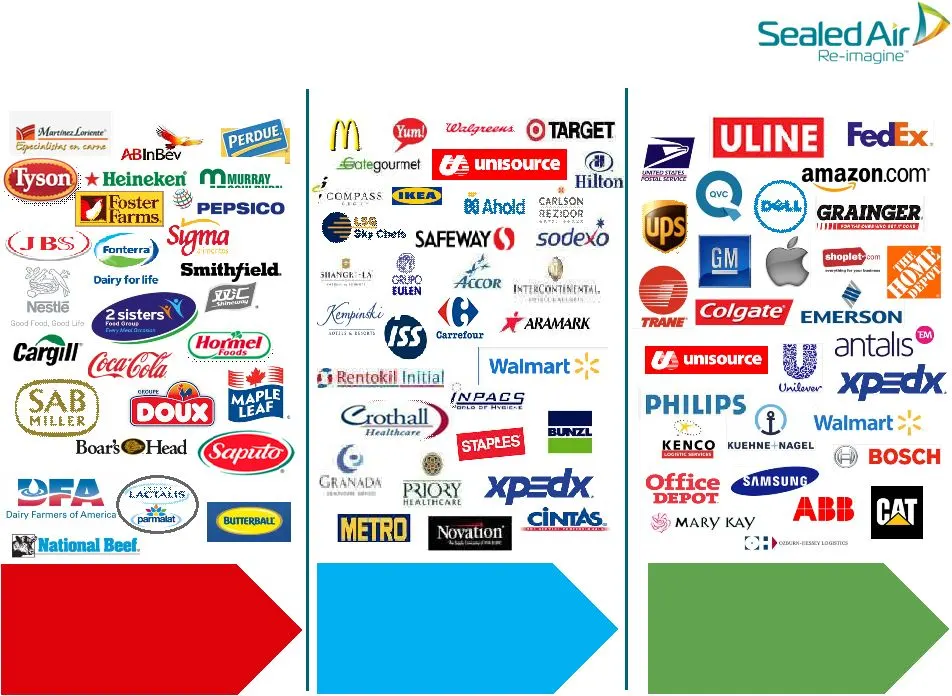
DISTRIBUTION ACCOUNTS FOR APPROX. 65% OF SALES TOP 20 CUSTOMERS ACCOUNT FOR NEARLY 20% OF SALES; DISTRIBUTION ACCOUNTS FOR APPROX. 35% OF SALES TOP 20 CUSTOMERS ACCOUNT FOR APPROX. 25% OF SALES Who We Serve DIVERSEY CARE PRODUCT CARE FOOD CARE
Slide 5: 2013 Net Sales by End Market
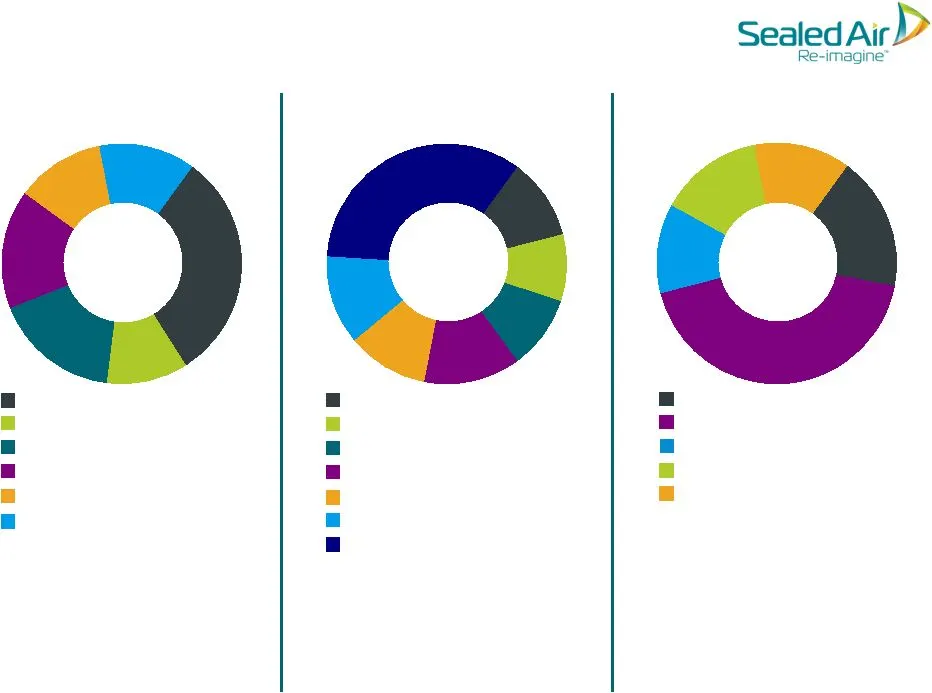
31% 11% 17% 16% 12% 13% 43% 18% 13% 14% 12% 10% 12% 11% 11% 35% 11% 10% DIVERSEY CARE PRODUCT CARE FOOD CARE Fresh Red Meat Dairy Solids Other Food Smoked & Processed Poultry Beverages Consumer Applications Industrial/Manufacturing E-Commerce 3PL/Fulfillment General Protection Building Service Contr
Slide 6: 2013 Net Sales by Region
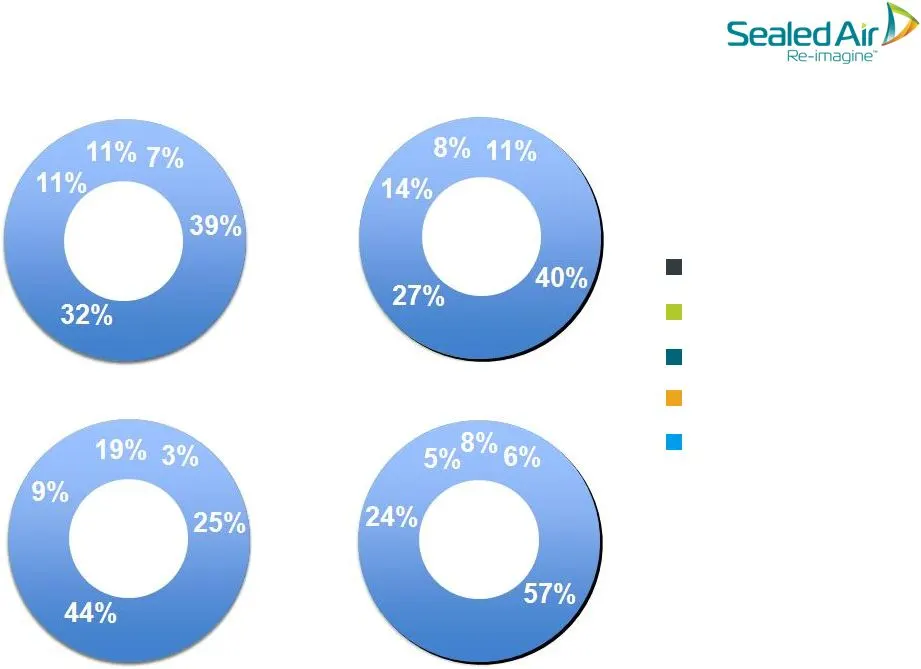
8% DIVERSEY CARE PRODUCT CARE FOOD CARE SEALED AIR North America Europe Latin America AMAT Japan/ANZ 2013 Net Sales by Region
Slide 7: Total Company Net Sales Bridge
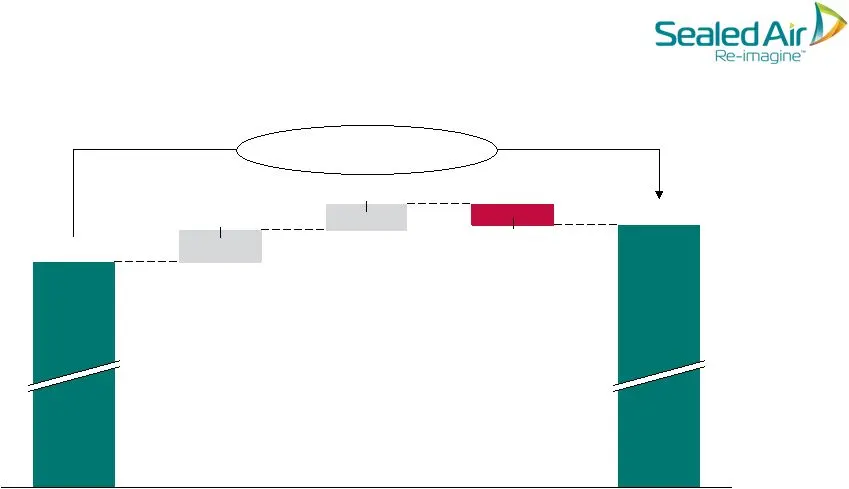
Total Company Net Sales Bridge 1.7% Reported 2.7% Constant Currency 2013 Net Sales 7,691 -76 Foreign Exchange Price/Mix +94 Volume +114 2012 Net Sales 7,559 ($ in millions) • Constant currency 2013 sales growth in every region, except for a slight decline Europe • Sales in Developing Regions increas
Slide 8: Net Sales by Division
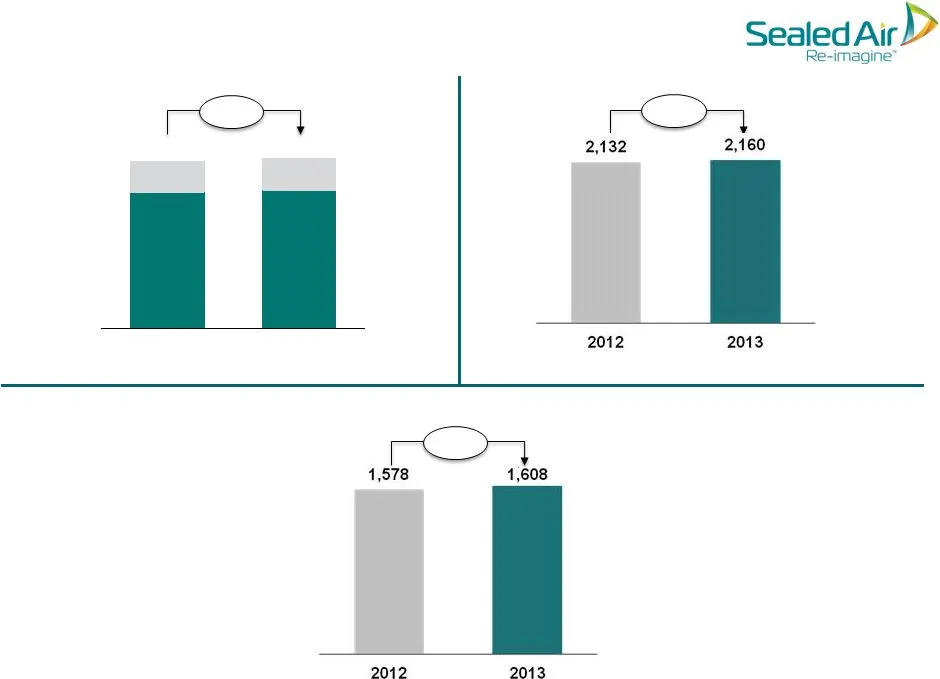
3,049 3,106 DIVERSEY CARE Net Sales by Division PRODUCT CARE FOOD CARE Packaging Hygiene 3,740 3,811 * Constant Currency Net Sales Growth: 3.3% * Constant Currency Net Sales Growth: 2.0% * Constant Currency Net Sales Growth: 2.4% ($ in millions) 1.9%* 1.4%* 1.9%*
Slide 9: Adjusted EBITDA, excluding SARs
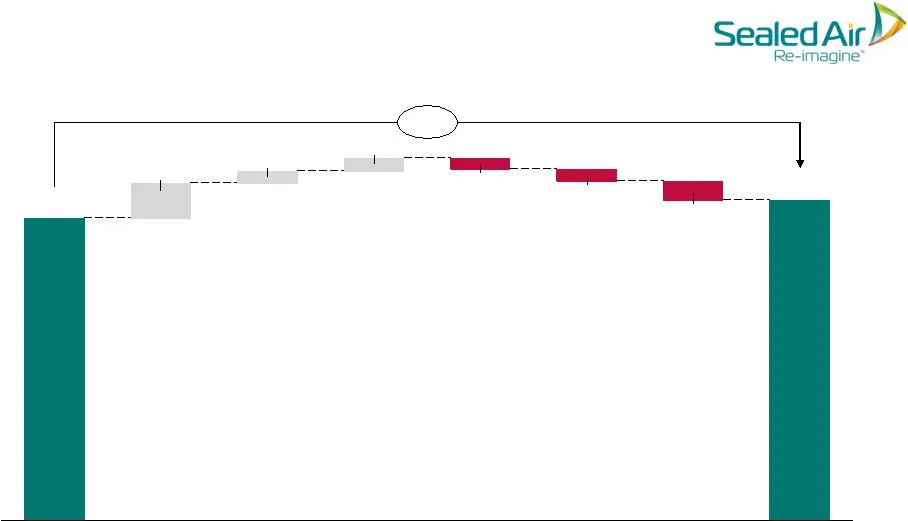
1,038 5.8% Adj. EBITDA Other/FX (2) -61 Perf- based Incentive Comp (1) -41 SG&A/ Other -34 Mix & Price/ Cost Spread Volume Cost Synergies Adj. EBITDA Adjusted EBITDA, excluding SARs (1) Performance-based incentive compensation includes an increase of $25M for the annual incentive plan & $16M of non-
Slide 10: Adj. EBITDA, excl SARs, by Division
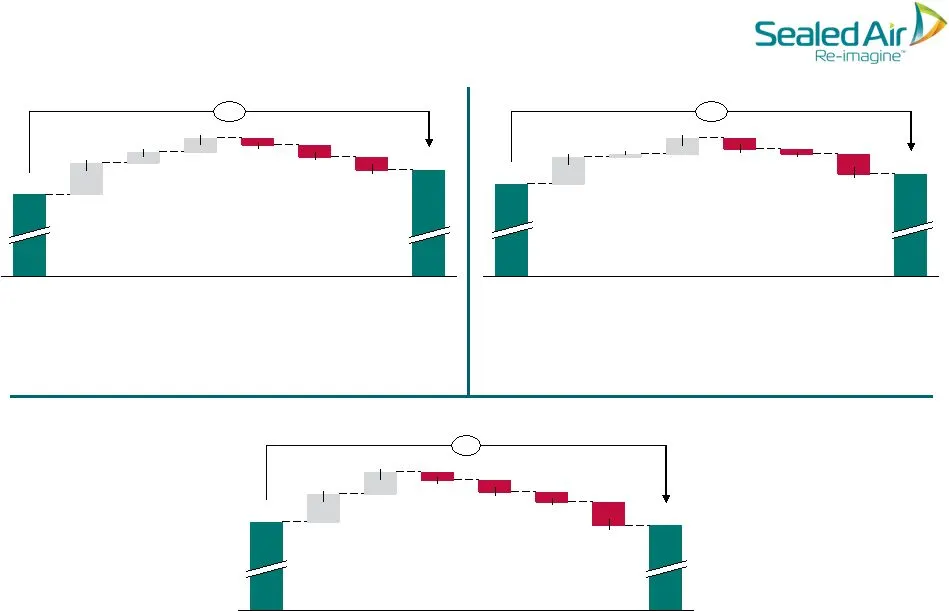
DIVERSEY CARE Adj. EBITDA, excl SARs, by Division PRODUCT CARE FOOD CARE Cost Synergies -13 +8% SG&A -21 Perf- based Incentive Comp -24 Other/ FX* Mix & Price/Cost Spread Volume Adj. EBITDA Margin, excl SARs: 2013: 15.2% 2012: 14.3% Other/ FX* -25 Perf- based Incentive Comp -7 SG&A -14 Mix & Price/C
Slide 11: Sealed Air Re-imagine
Sealed Air Re-imagine 509 271 2012 2013
Slide 12: Liquidity & Net Debt
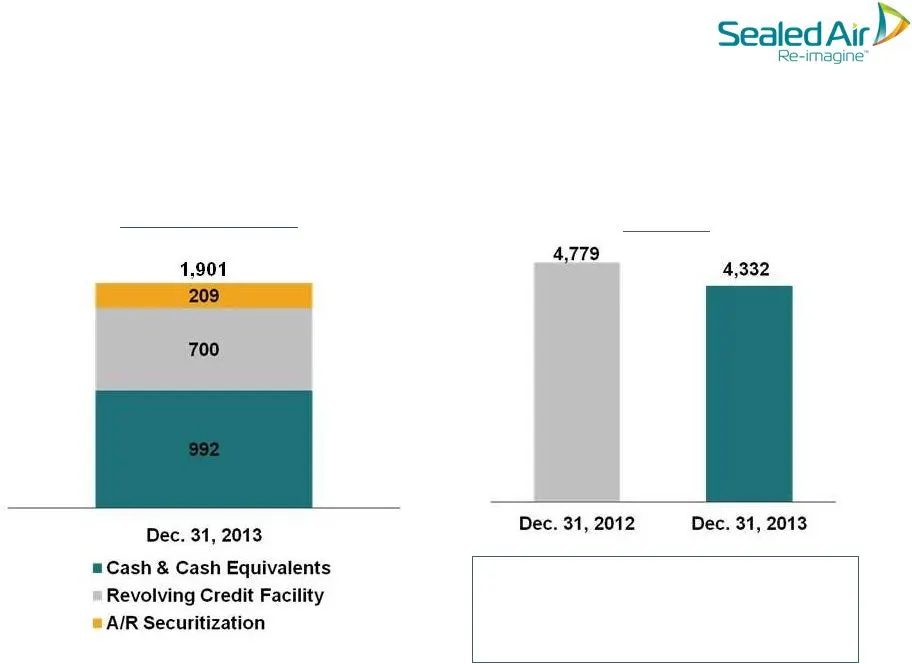
Liquidity & Net Debt Liquidity Position Net Debt Lower net debt as a result of cash generated from operating activities & asset sales, partially offset by capital expenditures & dividend payments ($ in millions)
Slide 13: Sealed Air
SealedArD
Slide 14: Pro Forma Debt Maturity Schedule
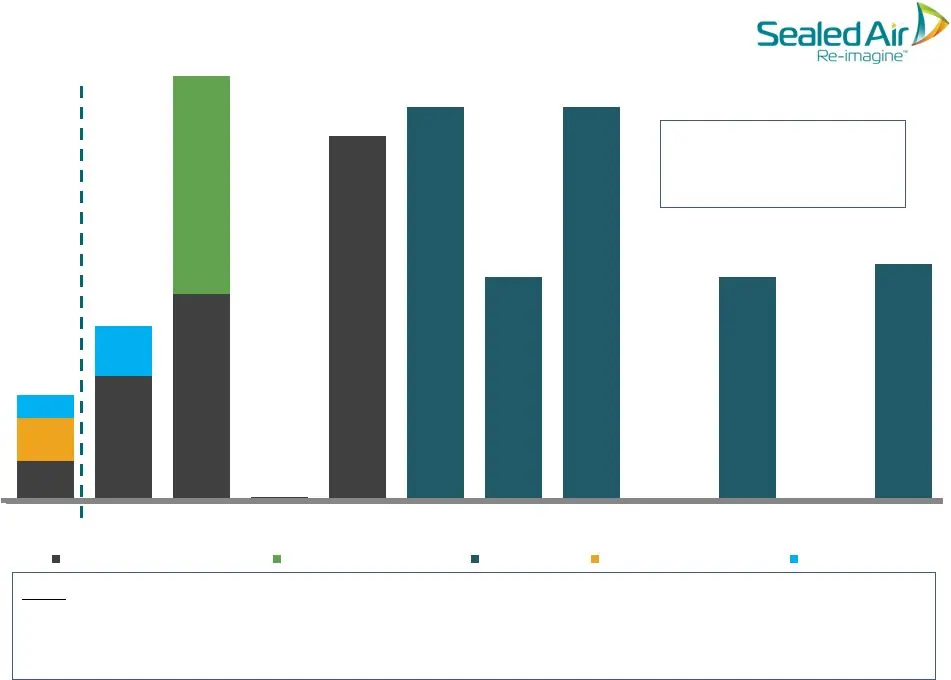
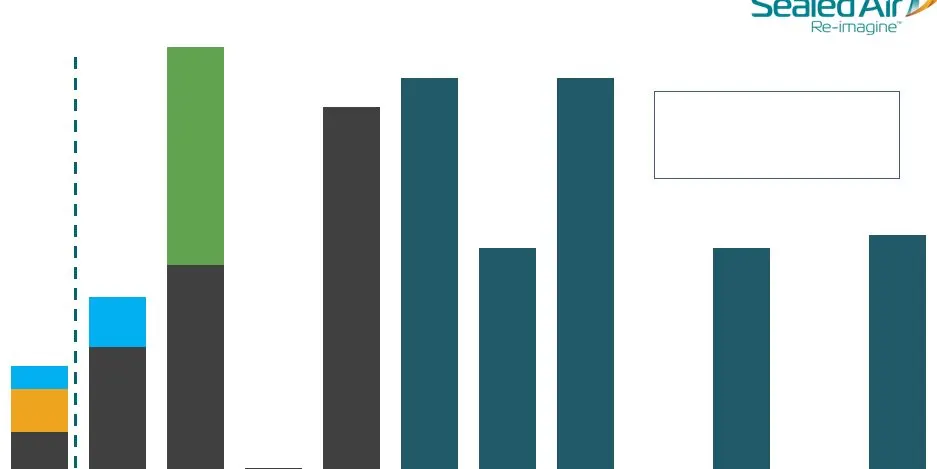
71 234 391 694 750 425 750 425 450 45 96 Credit Facility Term Loans Credit Facility Revolver Senior Notes Short Term Borrowings AR Securitization 8.125% 6.5% 8.375% 5.25% 6.875% Pro Forma Debt Maturity Schedule (1) ($ in millions) Weighted Average Interest Rate: Approx. 5.6% • Funded W. R. Grace & C
Slide 15: De-Leveraging Balance Sheet
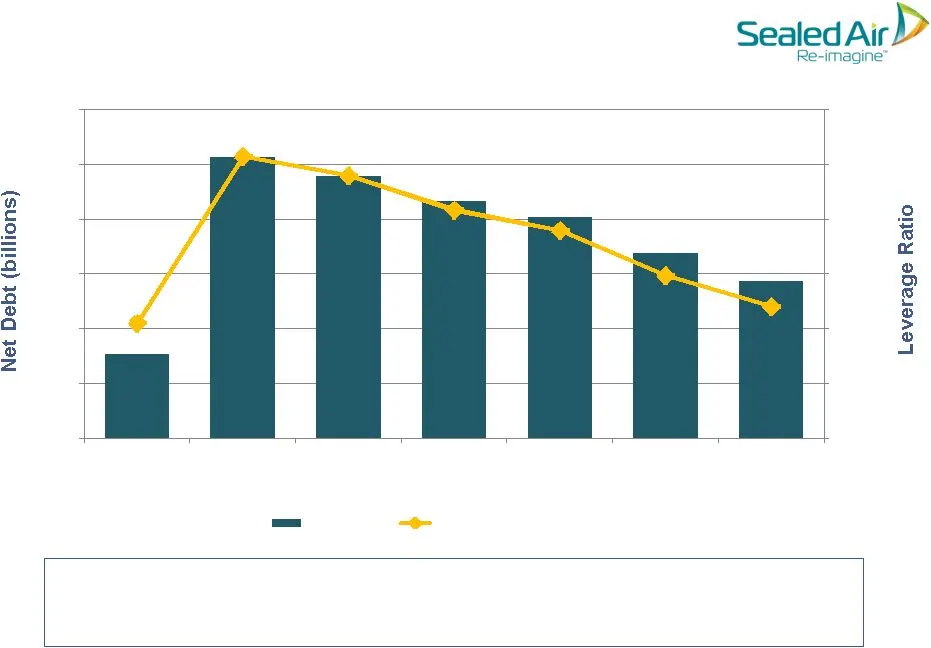
De-Leveraging Balance Sheet • De-leveraging balance sheet to optimize capital structure that can be sustained throughout-out end market cycles and economic downturns • Return excess cash to shareholders 0.0x 1.0x 2.0x 3.0x 4.0x 5.0x 6.0x $0.0 $1.0 $2.0 $3.0 $4.0 $5.0 $6.0 (Diversey Acquisition) 2014
Slide 16: How We Are Getting Fit
Implementing sales & marketing and pricing effectiveness; Rationalizing portfolio Investing for higher margin growth • Optimize portfolio & re-segment markets • Optimize supply chain network • Drive incremental profit capture through pricing • Build out hygiene portfolio and drive synergy sales Gett
Slide 17: How We Will Change The Game
Evolve offer comprised of high value, differentiated solutions Drive higher margin revenue through innovation & value-add • Develop new technology to improve processor yields • Reduce food safety risk throughout food chain • Reduce waste through end-to-end innovation • Provide integrated systems to

Slide 18: Sealed Air Re-imagine
Sealed Air D . Re-imagine”

Slide 19: Sealed Air Re-imagine
Sealed Air D . Re-imagine”
Slide 20: Net Sales Performance by Division and Region 2013
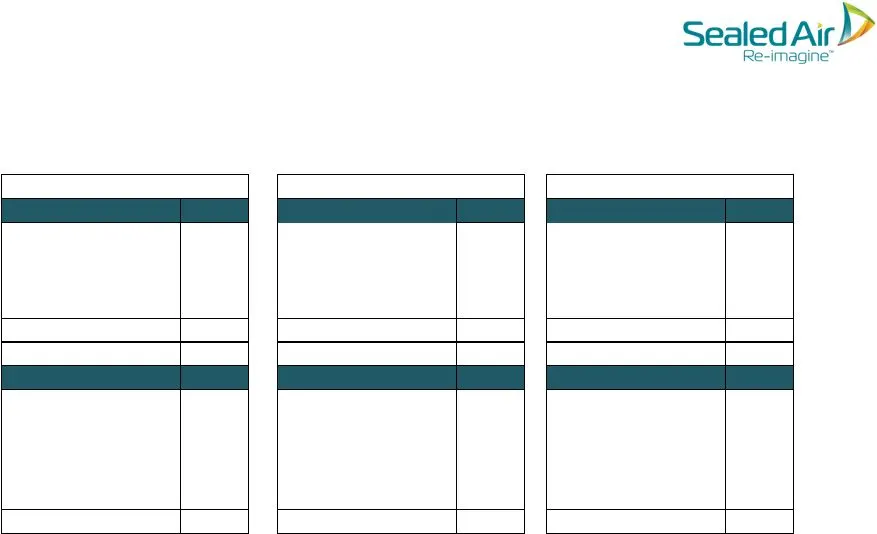
By Division 2013 By Region 2013 By Division 2013 By Region 2013 By Division 2013 By Region 2013 Net Sales Performance Product Price/Mix & Volume Food Care 1.6% Diversey Care 1.5% Product Care (0.2%) Medical/New Ventures 2.3% Total 1.2% North America 1.5% Europe (0.2%) Latin America 5.1% AMAT 2.0% JA
Slide 21: 2013 Adjusted EBITDA and Adjusted EPS Calculation
2013 Adjusted EBITDA, excl SARs $1,038.0 2013 Adjusted EPS $1.23 2013 Adjusted EPS, excl SARs $1.39 2013 Adj. EPS Calculation Reported U.S. GAAP Measures : • Q4 2013 Operating Income: $172.6M; Net Income: $3.6M; 2013 Operating Income: $602.1M; Net Income: $93.7M • Q4 2013: Recognized $0.11 in discon

Slide 22: GAAP Operating Profit (Loss)
GAAP Operating Profit (Loss) (1) (1) The supplementary information included in this presentation can be found in Sealed Air’s February 6, 2014 earnings press release, which is preliminary and subject to change prior to the filing of our upcoming Annual Report on Form 10-K with the Securities and Exc
Source: SEC EDGAR · 8-K filed Feb 20, 2014
More decks from Sealed Air Corporation
 Q3 2025 Earnings Presentation17 slides · Nov 4, 2025
 Q2 2025 Earnings Presentation17 slides · Aug 5, 2025
 Q1 2025 Earnings Presentation15 slides · May 6, 2025
 Q4 2024 Earnings Presentation21 slides · Feb 25, 2025
 Q3 2024 Earnings Presentation20 slides · Nov 7, 2024
 Q2 2024 Earnings Presentation20 slides · Aug 8, 2024