Airtran — 2008 Merrill Lynch Global Transportation Conference
27 slides from Airtran's conference presentation, Jun 19, 2008
Slide 1: 2008 Merrill Lynch Global Transportation Conference
June 18, 2008 2008 Merrill Lynch Global Transportation Conference Exhibit 99.1 June 18, 2008 2008 Merrill Lynch Global Transportation Conference

Slide 2: Safe Harbor
2 Safe Harbor Certain of the statements contained herein should be considered “forward-looking statements,” including within the meaning of the Private Securities Litigation Reform Act of 1995. These forward-looking statements may be identified by words such as “may”, “will”, “expect,” “intend,” “in

Slide 3: Today's Discussion
3 Today’s Discussion We are different from other low cost carriers — Unique high quality product combined with low cost — Demonstrated ability to manage economic downturns — Diversified route network Adapting to record high fuel — Slowing growth — Cost reductions — Unit revenue increases — CAPEX red

Slide 4: AirTran Airways Today
4 AirTran Airways Today Youngest all-Boeing fleet in America — 143 Airplanes – 87 717s / 56 737s 58 cities served — Announced 3 new cities in 2008 Burlington, VT San Antonio, TX San Juan, PR Demonstrated ability to manage through challenges and capitalize on opportunities

Slide 5
Slide 6: AirTran's Key Strength Is Its Low Cost Structure
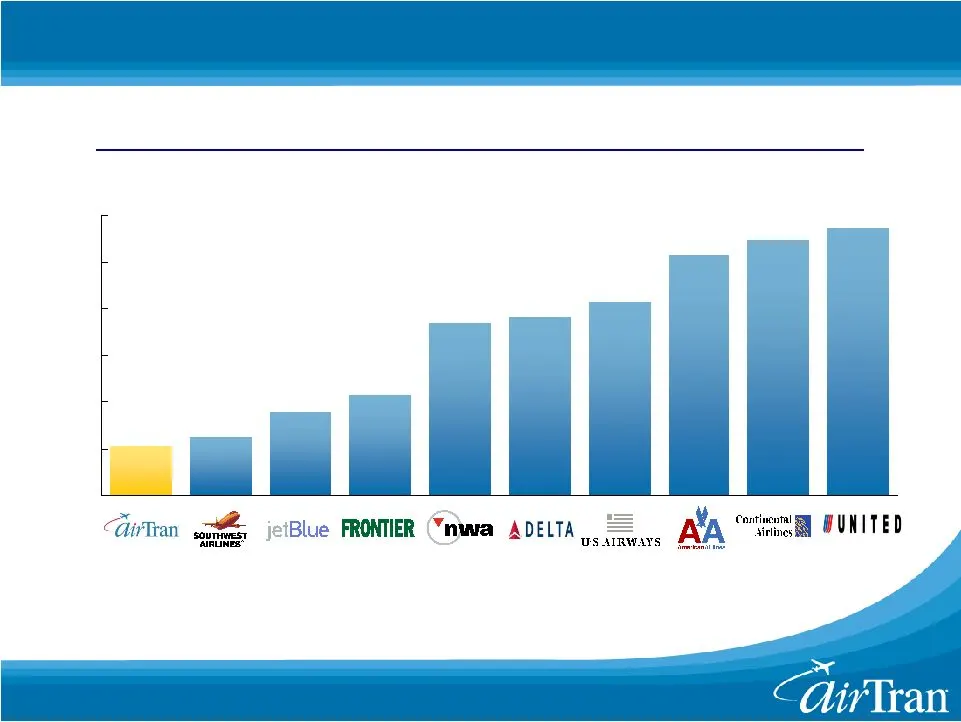
6 AirTran’s Key Strength Is Its Low Cost Structure (cents) While legacy costs are down, gap remains large * Excludes fuel and special items Industry Cost Comparison Non-Fuel Unit Costs at 705 Miles for the LTM Q108
Slide 7: AirTran Combines Low Cost And High Quality
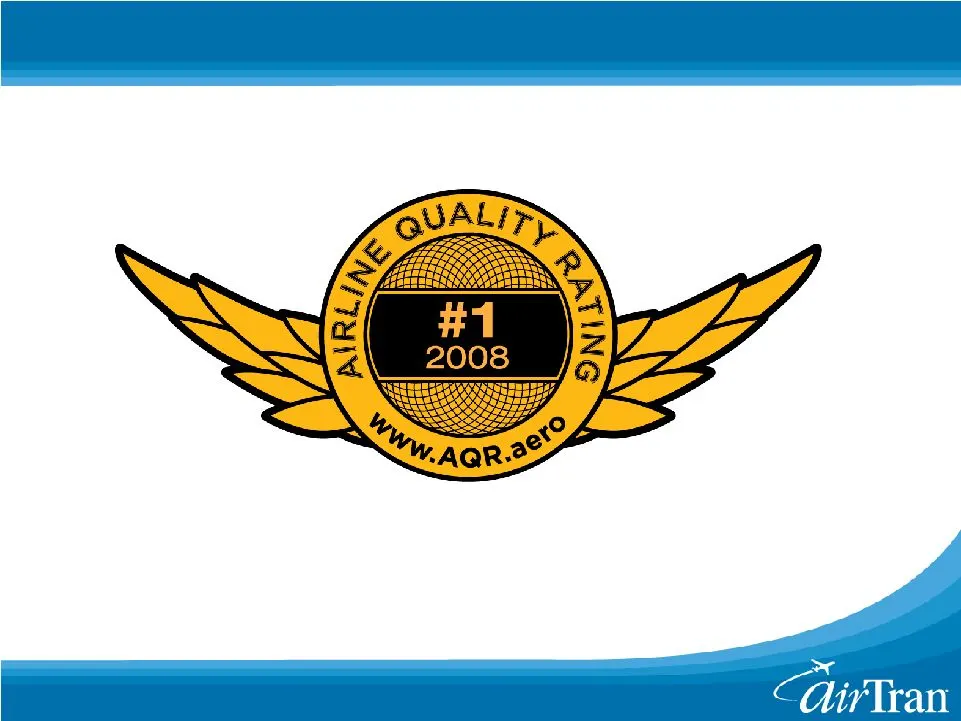
7 AirTran Combines Low Cost And High Quality * The “Airline Quality Rating” mark is used with permission of founding authors of the Airline Quality Rating: Dr. Dean E. Headley and Dr. Brent D. Bowen at www.AQR.aero.

Slide 8: AirTran Recognized As #1 For Quality In Industry
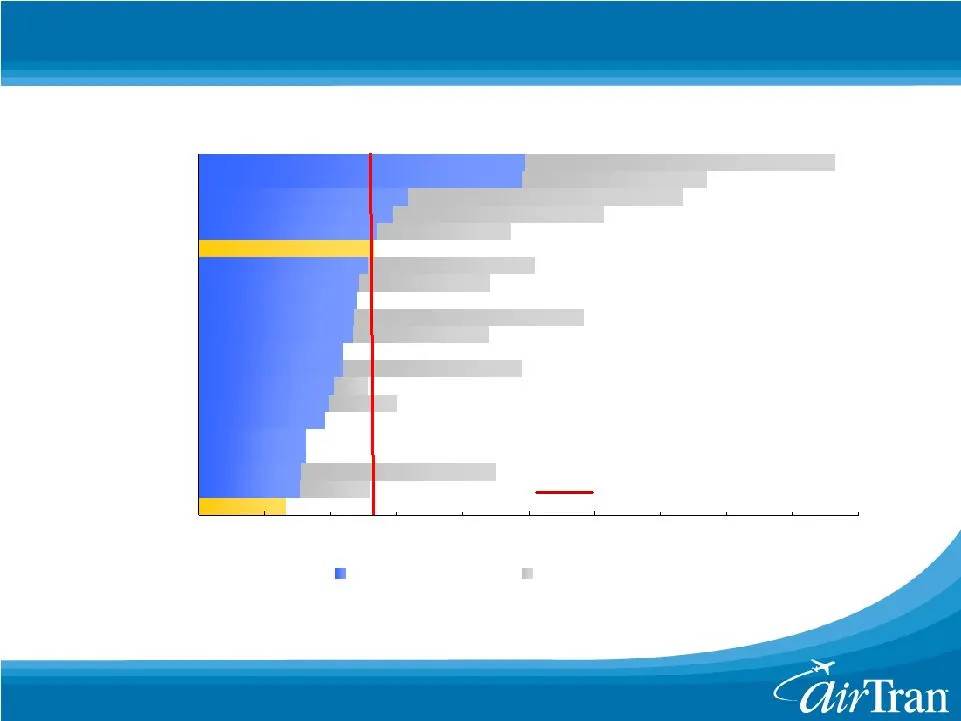
8 AirTran AirTran Recognized As #1 For Quality In Industry 2005 2004 2003 2006 2007 AirTran AirTran AirTran AirTran JetBlue Southwest Northwest Frontier Continental Alaska United American Delta Notes: (1) Source: Wichita State University / University of Nebraska, Omaha. (2) Based on DOT reports for
Slide 9: Atlanta Is The World's Largest LCC Hub
9 Atlanta Is The World’s Largest LCC Hub 1,000 AAI - Atlanta (2000) UAUA - San Francisco LCC - Philadelphia JBLU - New York LUV - Baltimore LUV - Phoenix LCC - Phoenix AMR - Miami AMR - Chicago LUV - Chicago UAUA - Denver LCC - Charlotte LUV - Las Vegas CAL - Newark NWA - Detroit AAI - Atlanta (2008
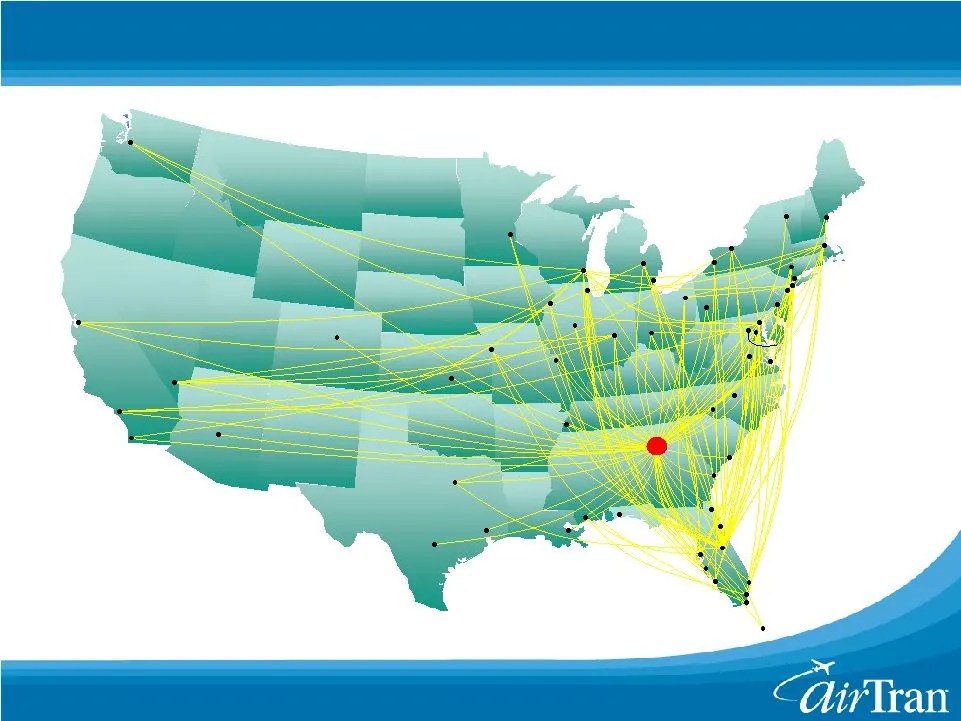
Slide 10: Successful Diversification – AirTran Route Network
10 Successful Diversification – AirTran Route Network Portland Portland Boston Boston Dallas/Ft. Worth Dallas/Ft. Worth Ft. Lauderdale Ft. Lauderdale San Juan San Juan Houston Houston Las Vegas Las Vegas Denver Denver San Francisco San Francisco Cities: Routes: 138 Minneapolis Minneapolis Burlington
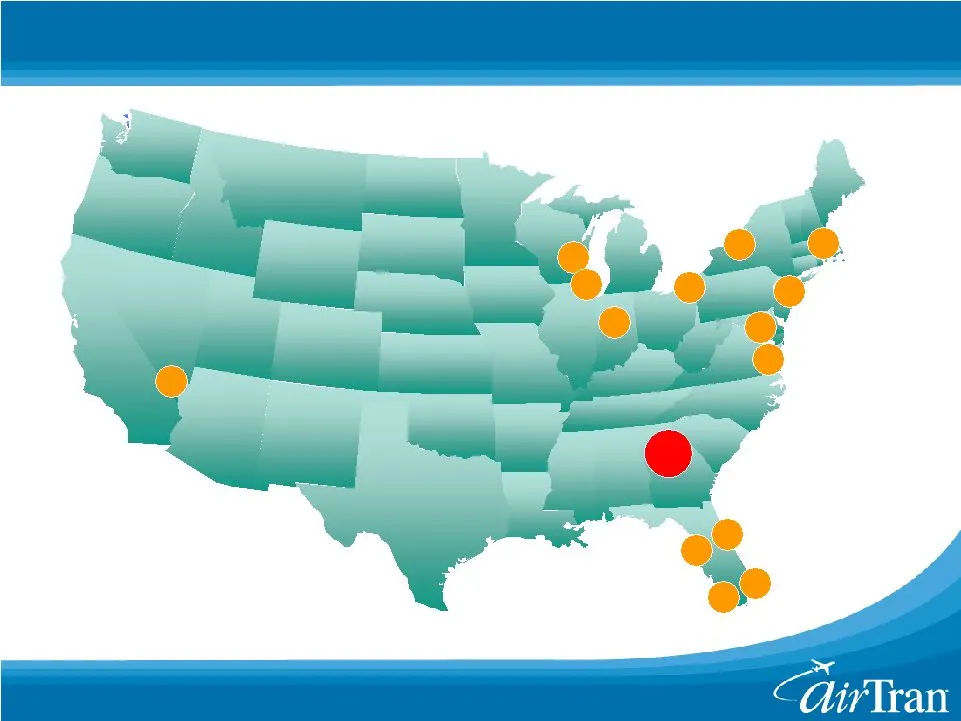
Slide 11: Network Scope Improves Cost And Revenue
11 55 Network Scope Improves Cost And Revenue Orlando Orlando Atlanta Atlanta Baltimore Baltimore Tampa Tampa Newport News Newport News Akron / Akron / Canton Canton Boston Boston Ft. Lauderdale Ft. Lauderdale Indianapolis Indianapolis Chicago Chicago Las Vegas Las Vegas Rochester Rochester Ft. Myer

Slide 12: All Airlines Face Tremendous Challenges In 2008
12 All Airlines Face Tremendous Challenges In 2008 Rising fuel prices Excess industry capacity Soft economy
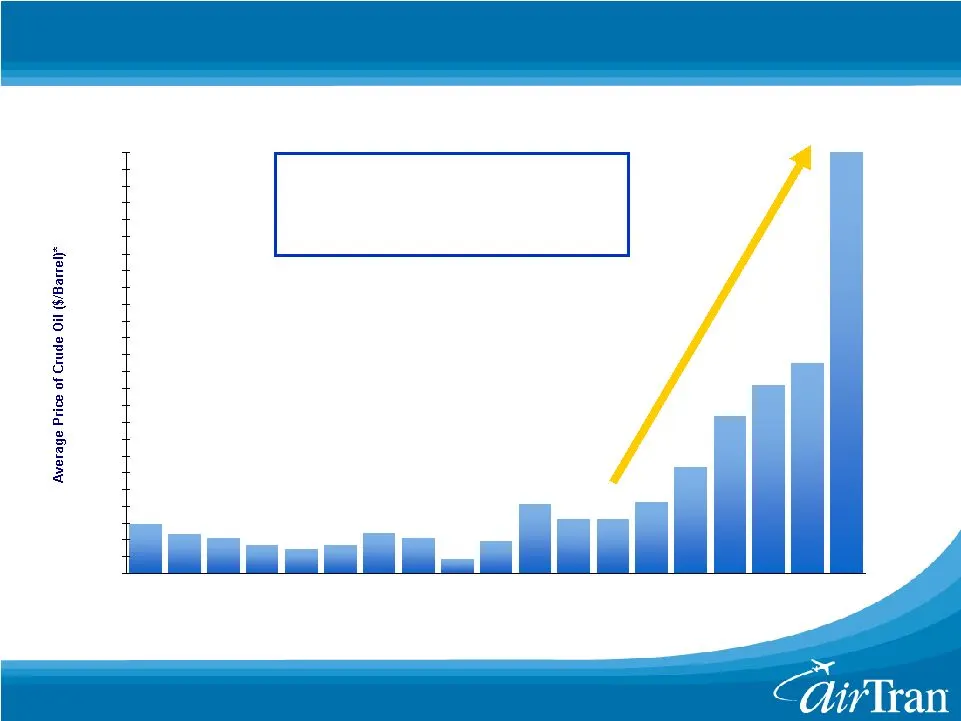
Slide 13: Oil Increased From $70 To $135/bbl In The Last Months
13 Oil Increased From $70 To $135/bbl In The Last 10 Months *West Texas Intermediate Crude Oil Sources: Air Transport Association, Energy Information Administration, PIRA Energy Group, Deutsche Bank (Cost per Barrel) Refinery margins have increased from $5 in 2000 to more than $30 in 2008 24.53 18.4
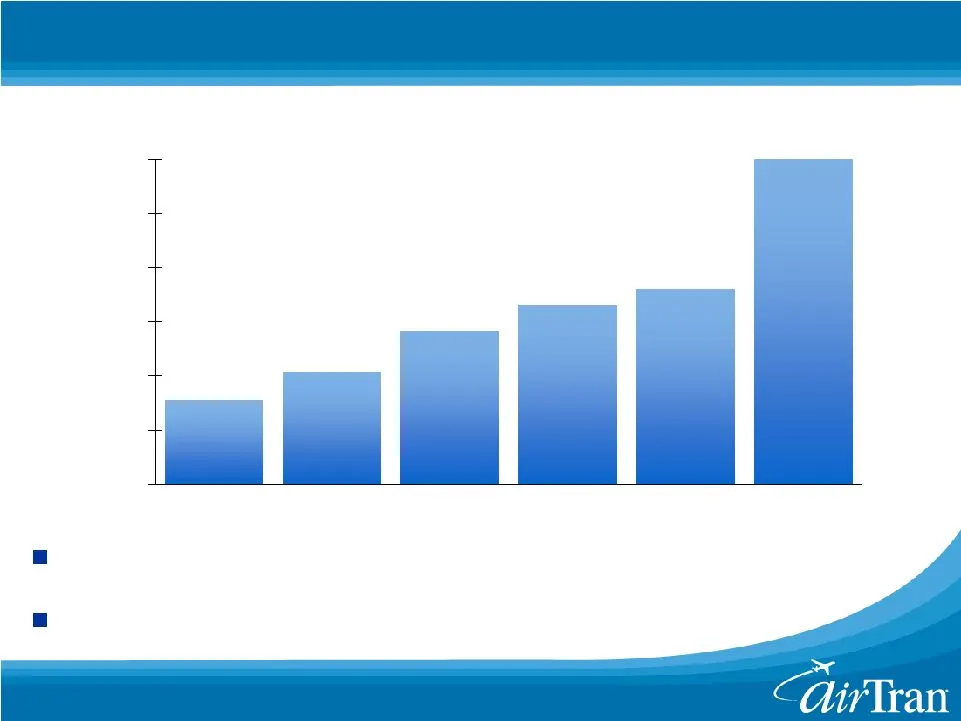
Slide 14: Oil Is Quickly Changing Our Business
14 Oil Is Quickly Changing Our Business 2003 2004 2005 2006 2007 2008E WTI Crude Oil (Cost per Barrel) 21% of Expenses 25% 32% 36% 37% 49% Crude oil traded at $86.34 as recently as 2/7/08 Crude oil last traded below $100 on 4/1/08

Slide 15: AirTran's Five Point Strategy To Adapt
15 AirTran’s Five Point Strategy To Adapt Reducing growth Cutting costs Raising cash Capping fuel exposure Raising revenues
Slide 16: AirTran's Fleet Plan Has Tremendous Flexibility
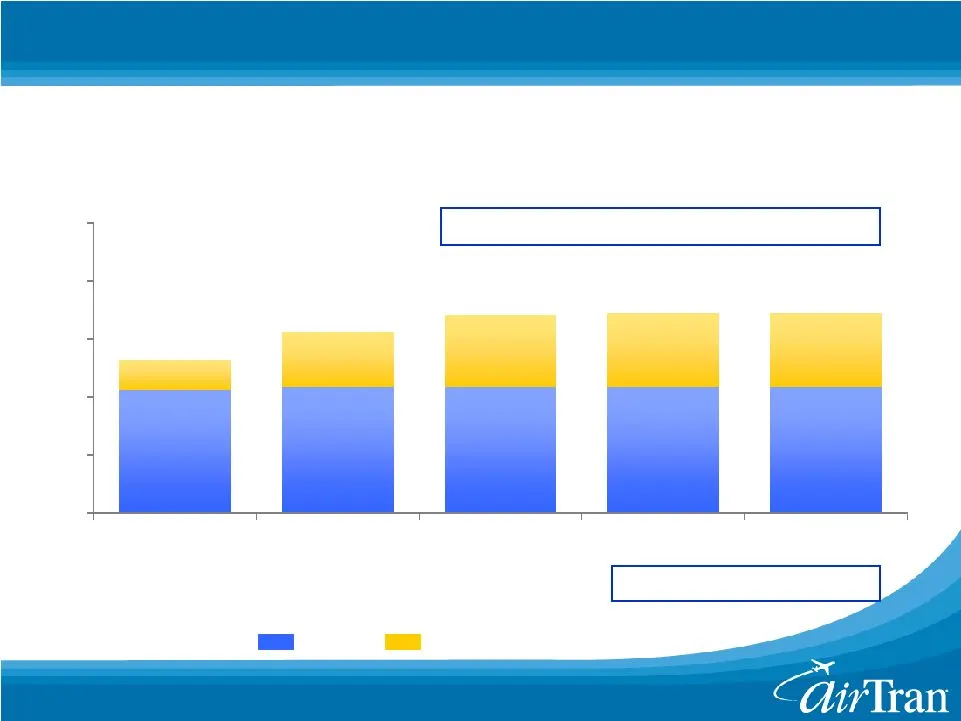
16 AirTran’s Fleet Plan Has Tremendous Flexibility 135-140 135-140 2005 2006 2007 2008 2009 (Aircraft) ASM Growth 28% 24% 20% 5 - 6% 0 – (5)% 717s 737s Previous Plan: 147 161 Currently 143 Aircraft: 87 717s / 56 737s

Slide 17: Oil Will Force Further Capacity Cuts For All Airlines
17 Oil Will Force Further Capacity Cuts For All Airlines AirTran has made significant adjustments — 7 aircraft committed to sell in 2008 – 2 sold in April — Deferred 18 future deliveries from Boeing — Actively working on several other fleet plan initiatives 737NG still remains a high value / high de

Slide 18: April's Capital Raise Improves Liquidity
18 April’s Capital Raise Improves Liquidity Note: (1) As of March 31, 2008; Includes cash equivalents and short term investments (2) Concurrent $79MM common equity and $75MM convertible notes offering; Excludes approximately $19MM of escrowed interest and fees (3) Excludes proceeds from asset sales

Slide 19: Recasting Business In High Fuel Cost Environment
19 Recasting Business In High Fuel Cost Environment Fuel conservation program — Single engine taxi — Reduced APU usage Reducing non-aircraft capital expenditures — Non-aircraft CAPEX to be reduced from $25-30MM to $12-18MM Reducing operating costs — Closing SWF in September and discontinuing DAB sea
Slide 20: Fuel Hedges Help Mitigate Fuel Run-up
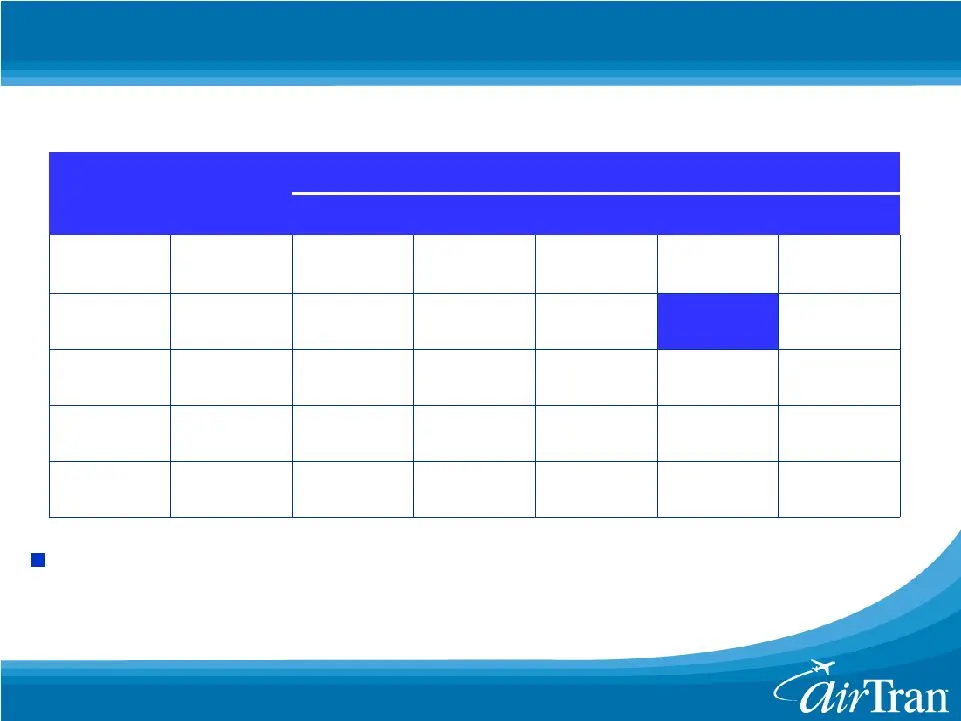
20 Hedge % Crude Price Period $100 $110 $118 $140 $130 $120 Fuel Hedges Help Mitigate Fuel Run-up 21% 56% 54% 70% 57% 2009 2008 Q408 Q308 Q208 $88 $97 $96 $98 $97 $96 $104 $102 $105 $104 $126 $116 $106 $124 $117 $110 $119 $112 $106 $123 $111 $121 $116 $109 Example: If crude was $130 in Q308, our cos

Slide 21: Unit Revenues Are Increasing
21 Unit Revenues Are Increasing Numerous legacy fare increases since 2007 AirTran has also increased prices — Multiple fare increases since Sep 2007 — Fuel surcharge implemented in Nov 2007 and increased in Jan and Apr 2008 Ancillary fees have also increased — Seat assignment fees — Change / cancel
Slide 22: AirTran's Ancillary Revenue Continues To Surge
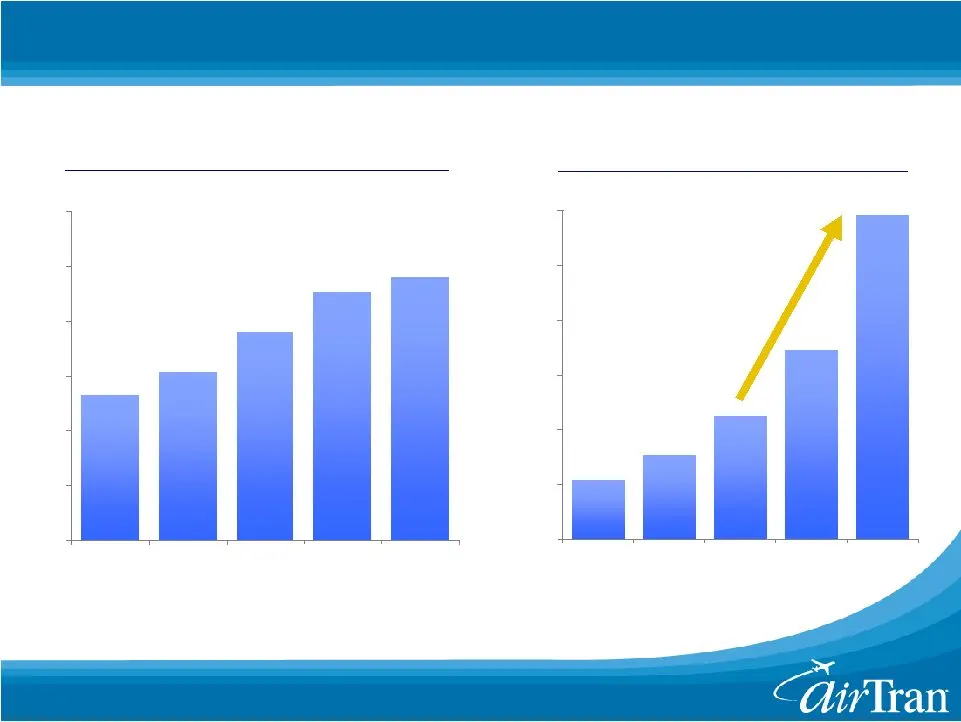
22 72% 54% 45% 43% 23% AirTran’s Ancillary Revenue Continues To Surge 5 - 6% 19% 24% 16% 22% (Millions) Ancillary Revenue $- $50 $100 $150 $200 $250 $300 2004 2005 2006 2007 2008E - 2004 2005 2006 2007 2008E ASM’s (Billions)

Slide 23: Domestic Capacity Is Shrinking
23 Domestic Capacity Is Shrinking Competitors have also announced mainline domestic capacity reductions — American capacity will be down 11-12% in Q408 — Continental capacity will be down 11% in Q408 — United capacity will be down 9.5-10.5% in Q408 — US Airways capacity will be down 6-8% in Q408 — S
Slide 24: Significant Redundant Legacy Capacity
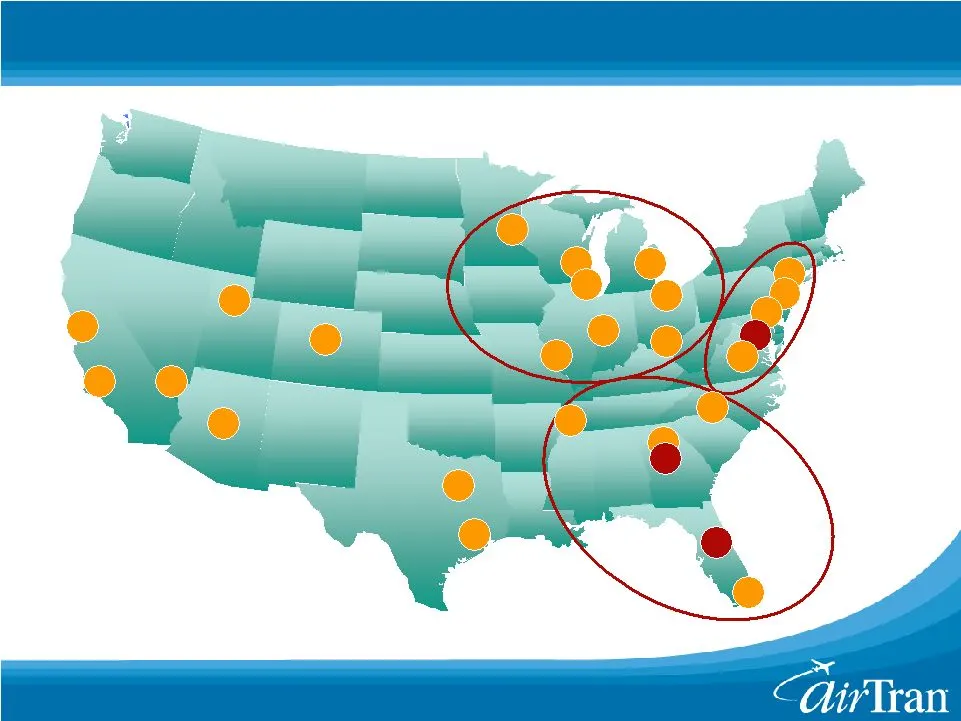
24 Significant Redundant Legacy Capacity Salt Lake City - DAL Las Vegas - LCC Legacy Hub Redundancies San Francisco - UAUA Los Angeles - UAUA Chicago - AMR Denver - UAUA Detroit - NWA Chicago - UAUA Minneapolis - NWA Cincinnati - DAL Milwaukee - NWA Indianapolis - NWA St. Louis - AMR Houston - CAL D
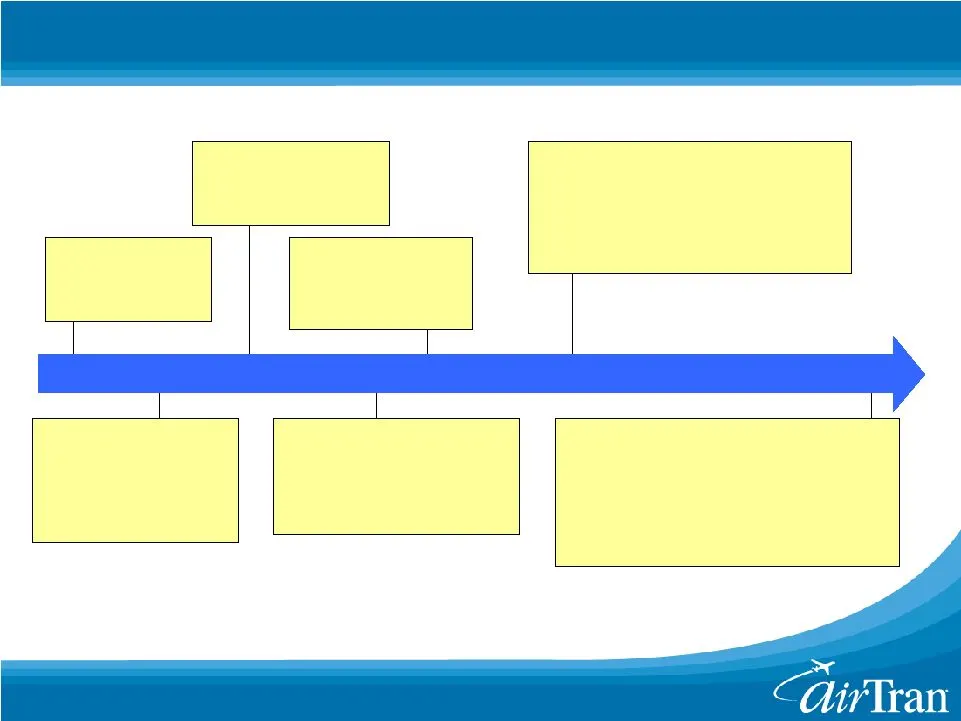
Slide 25: Proactive Record In Overcoming Industry Challenges
25 2000 1999 2002 2004 2006 2001 2003 2005 2007 2008 Proactive Record In Overcoming Industry Challenges • Under new management AirTran restores profitability in 1999 • Emerged stronger from 9/11 by lowering costs and capitalizing on legacy domestic retrenching • Increased cash balance to $100MM from

Slide 26: Summary
26 Summary AirTran is well positioned to adapt — High quality product and extremely low costs — Solid foundation and resourceful mindset Current oil prices are dramatically changing the airline industry — Domestic airline capacity will shrink — Unit revenues will continue to rise as capacity is remo
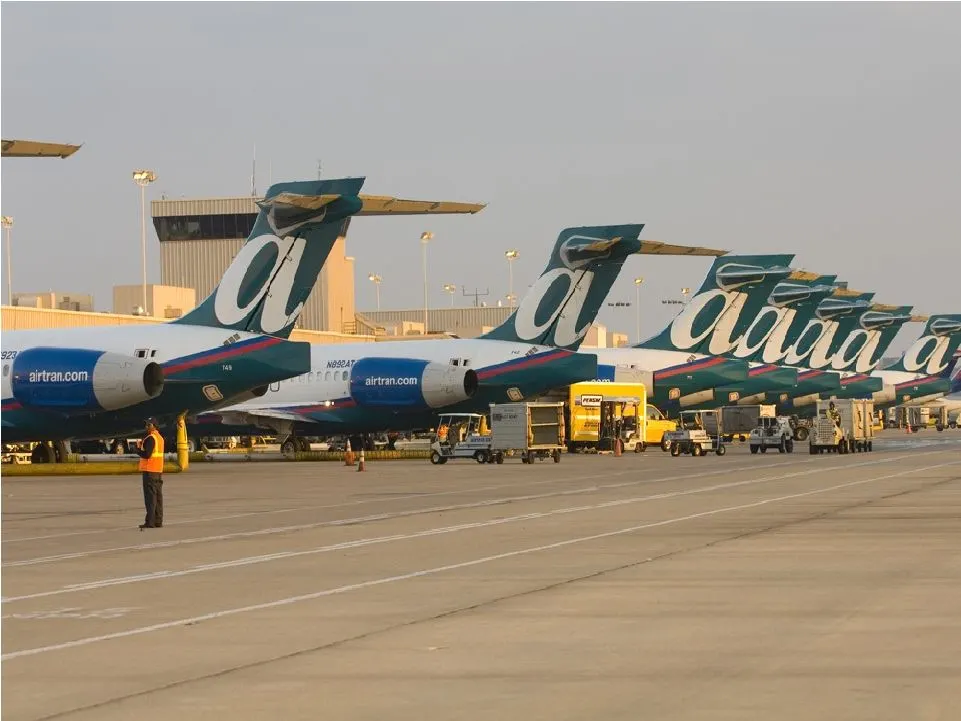
Slide 27
Source: SEC EDGAR · 8-K filed Jun 19, 2008
More decks from Airtran Holdings Inc
 Merger or Acquisition (September 2010)21 slides · Sep 27, 2010
 Bank of America - Merrill Lynch Global Transportation Conference 201025 slides · Jun 15, 2010
 Shareholder Meeting (May 2010)33 slides · May 18, 2010
 Investor Presentation (May 2010)26 slides · May 13, 2010
 JP Morgan Aviation, Transportation and Defense Conference 201025 slides · Mar 9, 2010
 Raymond James 2010 Growth Airline Conference25 slides · Feb 4, 2010