Legacy Reserves LP — Legacy Reserves L P — EnerCom Oil & Gas Conference 2007
22 slides from Legacy Reserves LP's conference presentation, Aug 23, 2007
Slide 1: EnerCom Oil & Gas Conference August 23, 2007
EnerCom Oil & Gas Conference August 23, 2007 Legacy Reserves LP

Slide 2: Forward-Looking Statements
Forward-Looking Statements Statements made by representatives of Legacy Reserves LP (the “Partnership”) during the course of this presentation that are not historical facts are forward-looking statements. These statements are based on certain assumptions made by the Partnership based on management’s
Slide 3: Legacy Overview
Legacy Overview Legacy Reserves LP
Slide 4: Legacy History
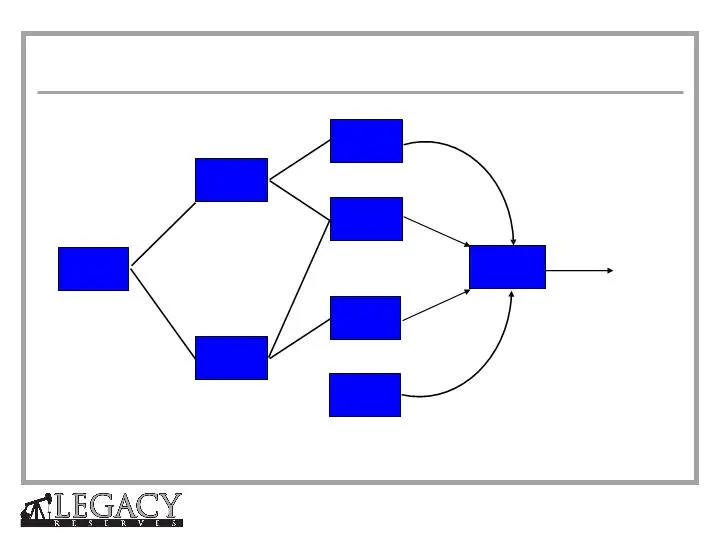
Other Related Entities Brothers Production Company Brothers Moriah Brothers MBN Moriah Legacy Dale Brown & Jack McGraw form Partnership Cary & Dale Brown form Moriah Formation Transaction Through Private Placement 1981 1991 2005 March 2006 January 2007 IPO Kyle McGraw & Cary Brown Assume Management
Slide 5: Legacy Management Team
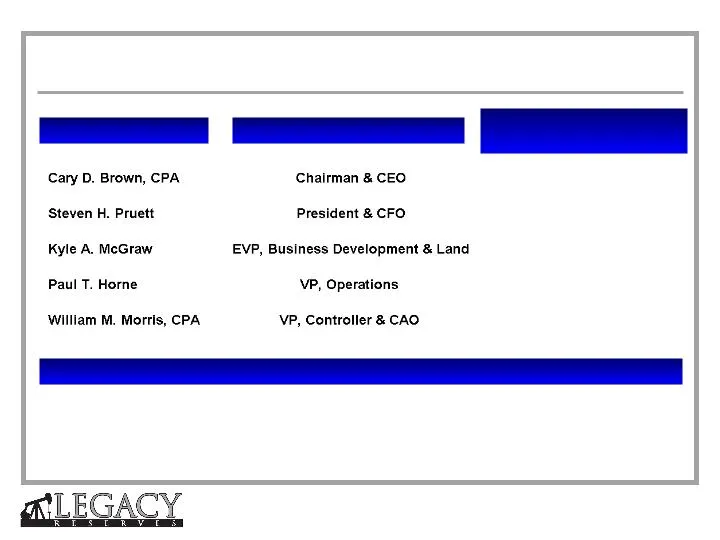
Name Title Years of Experience Permian / Total Oil & Gas Independent Board Members William D. Sullivan Former EVP Anadarko Petroleum G. Larry Lawrence Former Controller Pure Resources Kyle D. Vann Former CEO Entergy - Koch, LP Legacy Management Team
Slide 6: Asset Overview
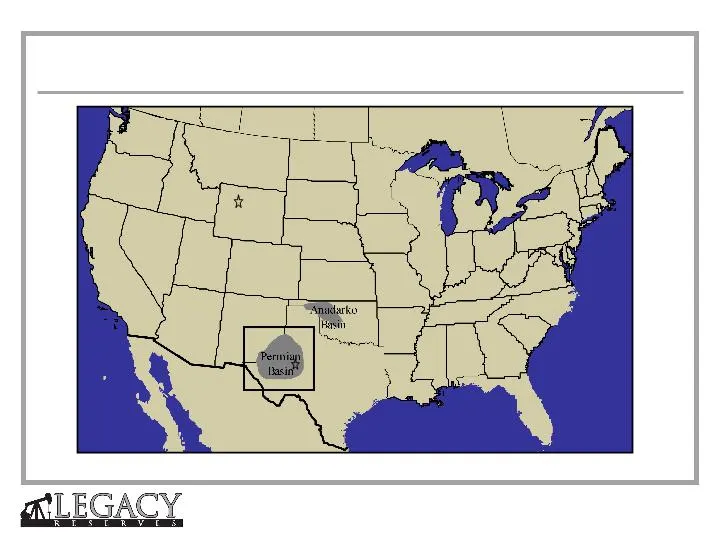
Cody, WY Asset Overview
Slide 7: Asset Overview
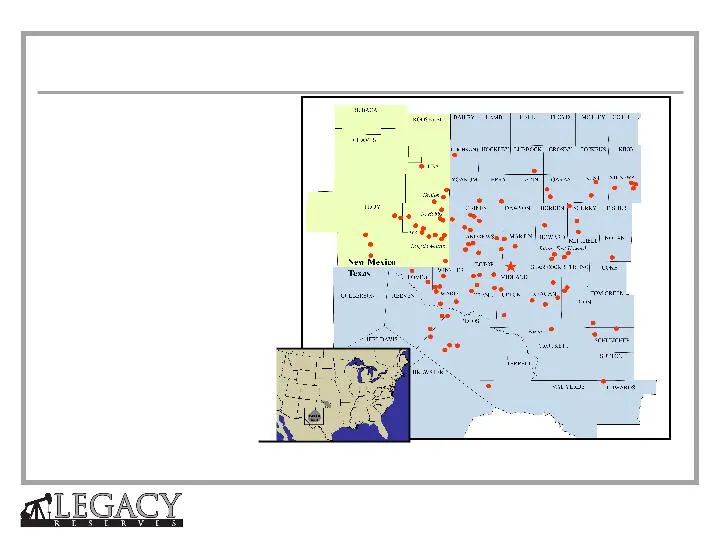
(1) Taken from reserve reports prepared by LaRoche Petroleum Consultants, Ltd. as of 12/31/06 for Legacy Reserves LP plus proved reserves from 2007 acquisitions from internal reserve reports: Binger (4.1 MMBoe), TSF/Ameristate (1.4 MMBoe), Slaughter/Rocker A (1.0 MMBoe), and Raven (1.2 MMBoe). (2) P
Slide 8: Stable Platform
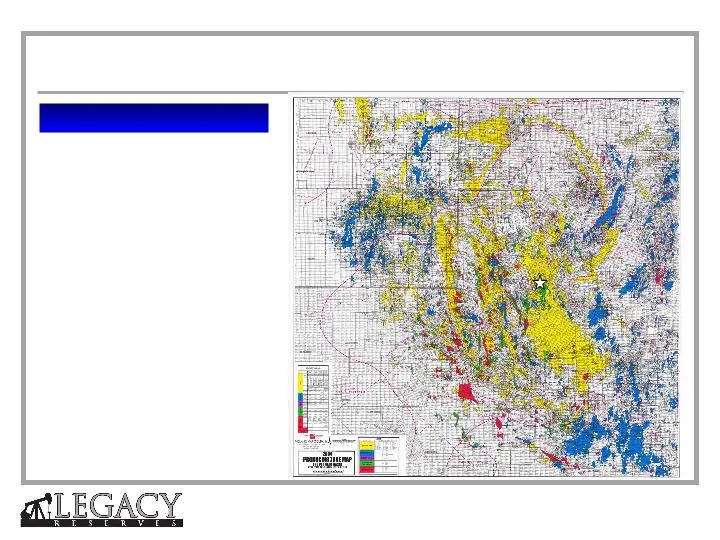
Stable Platform (1) Source: http://www.utpb.edu Map Source: Midland Map Company. Why the Permian Basin? • Over 24 BBbls produced since 1921 • Represents 20% of lower 48 states and 68% of Texas oil production (1) • Multiple producing formations • Established infrastructure and ample take-away capacit
Slide 9: Consolidation Opportunities in the Permian Basin
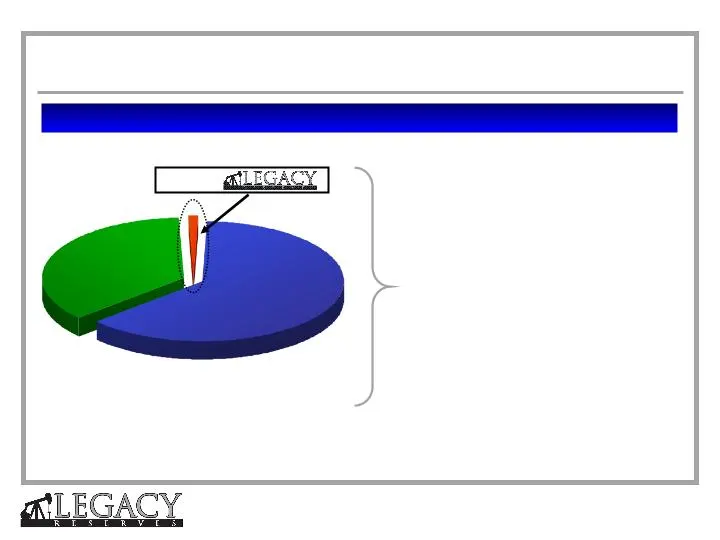
Top 5 Operators 1,700+ Operators Permian Basin Ownership Profile (1) 0.3% (1) Ownership based on production. Permian Basin includes Texas Railroad Commission Districts 7C, 8, 8A and Lea and Eddy County, New Mexico. Permian Basin data as of July 31, 2005; Legacy production data as of September 30, 20
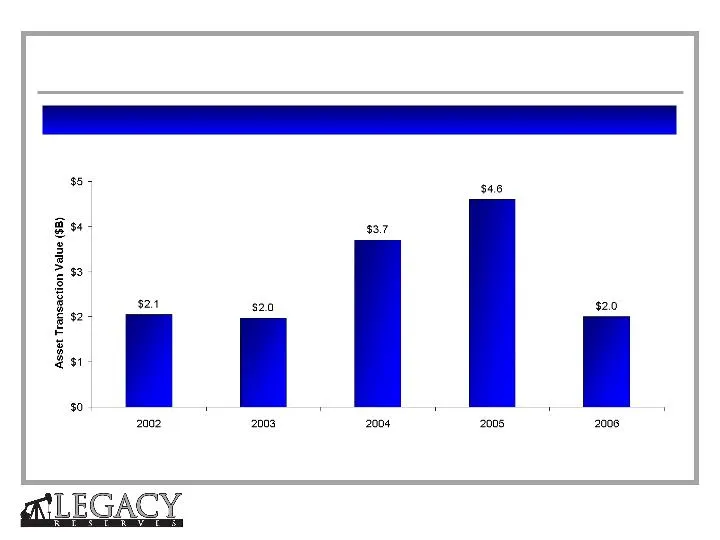
Slide 10: Active Acquisition Market
Multi-Billion Dollar Acquisition Market Note: Per John S. Herold, Inc’s 2007 Global Upstream M&A Review (from publicly available data). Mid-Continent includes the Permian Basin, excludes corporate transactions. Active Acquisition Market
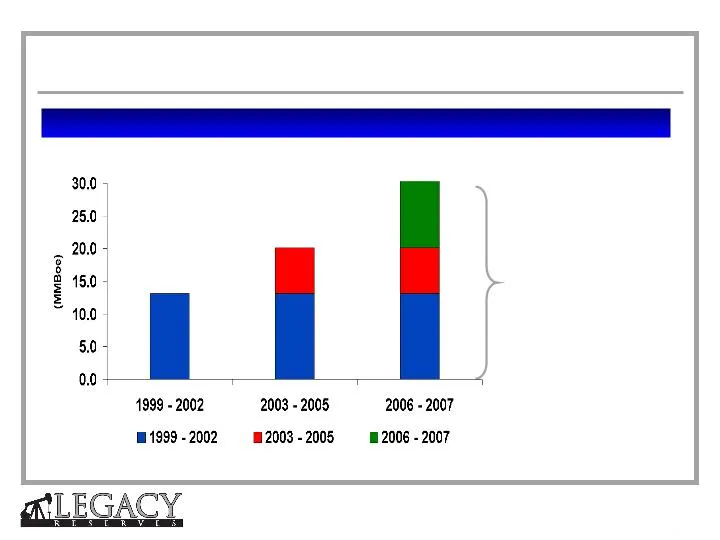
Slide 11: Acquisition Track Record
7.0 13.1 7.0 13.1 10.4 Acquired Reserves (1999 - 2007) Aggregate cost of $245 million at an average cost of $8.02 per Boe 13.1 20.1 30.6 Acquisition Track Record
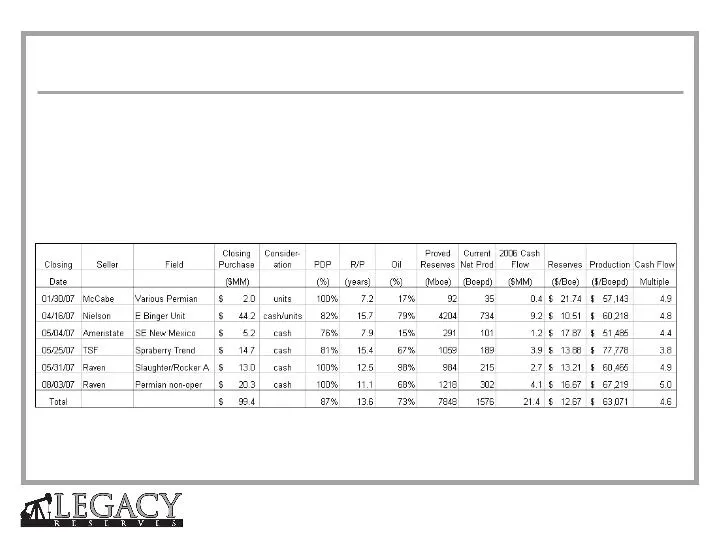
Slide 12: 2007 Acquisition Summary
6 negotiated transactions averaging: • $12.67 per Boe of proved reserves • 87% PDP, 13.6 year R/P • $63,071 per Boepd • 4.6 times 2006 cash flow 2007 Acquisition Summary
Slide 13: Financial Summary
Financial Summary Legacy Reserves LP
Slide 14: Ownership
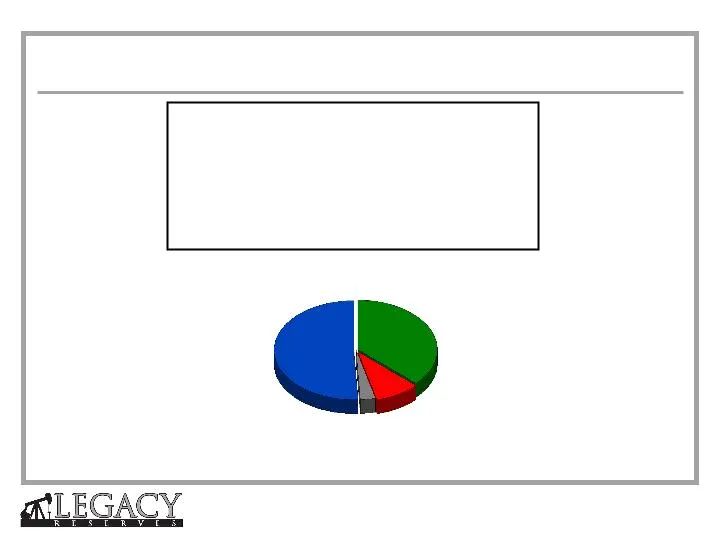
GP Interest <0.1% Public Unitholders 37% 144A & Reg D Unitholders 9% Sellers of Assets to Legacy 3% Founding Investors, Directors and Management 51% Ticker: LGCY Exchange: NASDAQ Unit Price (8/22/07): $22.93 per unit Quarterly Distribution: $0.42 per unit Yield: 7.3% Market Capitalization: $598 mill
Slide 15: Legacy Balance Sheet
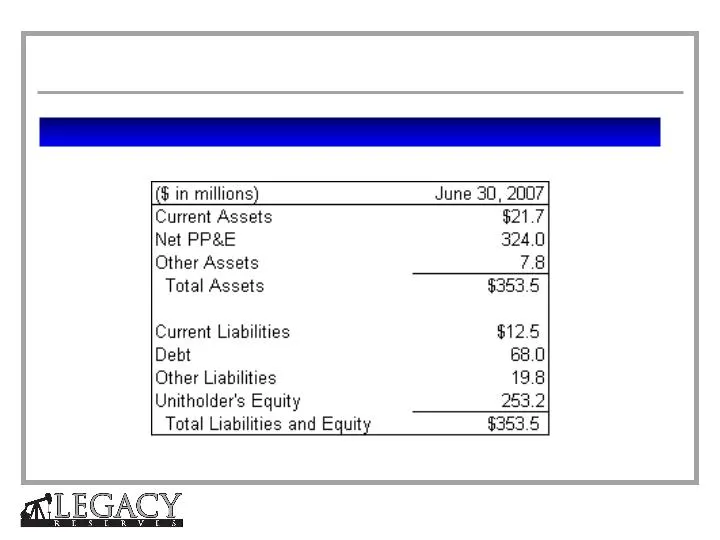
Summary Balance Sheet Legacy Balance Sheet
Slide 16: Summary Financial Information
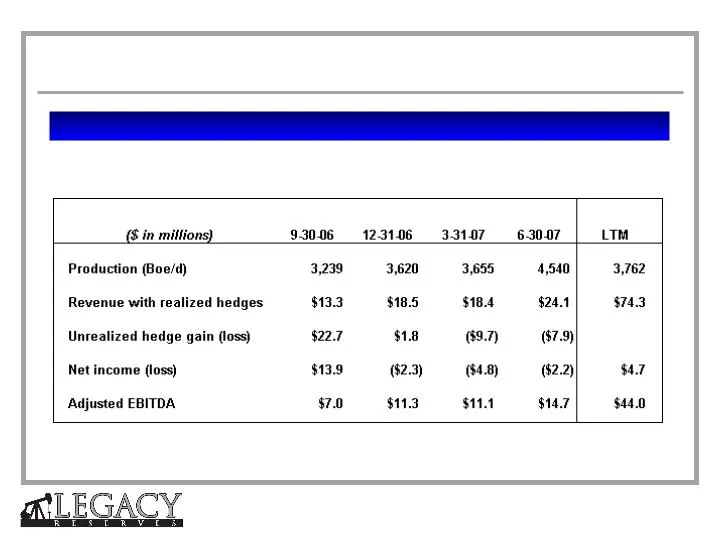
Financial and Operating Data - Latest Twelve Months Note: Adjusted EBITDA for the quarter ended 9-30-06 unfavorably impacted by $4.0 million swap termination payment for 2007-2008 oil swaps. Summary Financial Information
Slide 17: Commodity Price Hedging Summary
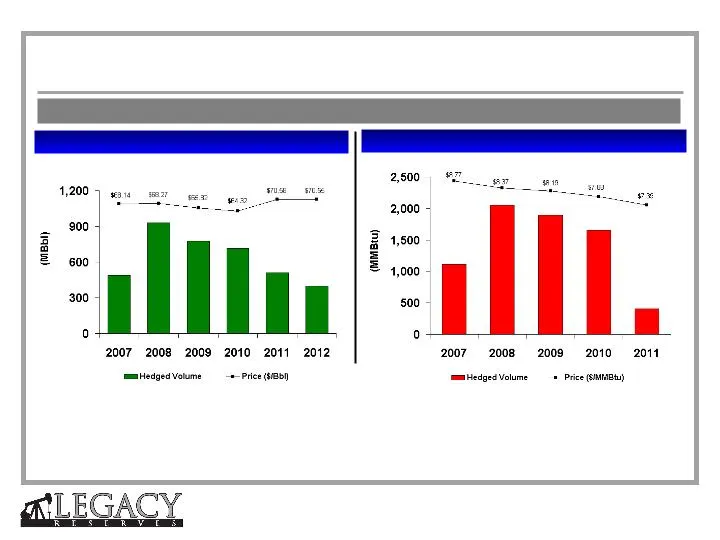
Oil (1) Natural Gas (1) Over 75% of forecasted production hedged for 2007 and over 58% hedged through 2010. (1) All hedges are floating for fixed price swaps. Swap volumes and prices starting July 1, 2007 through December 31, 2012. Waha-NYMEX basis swaps in place on Henry Hub gas swaps. Natural gas
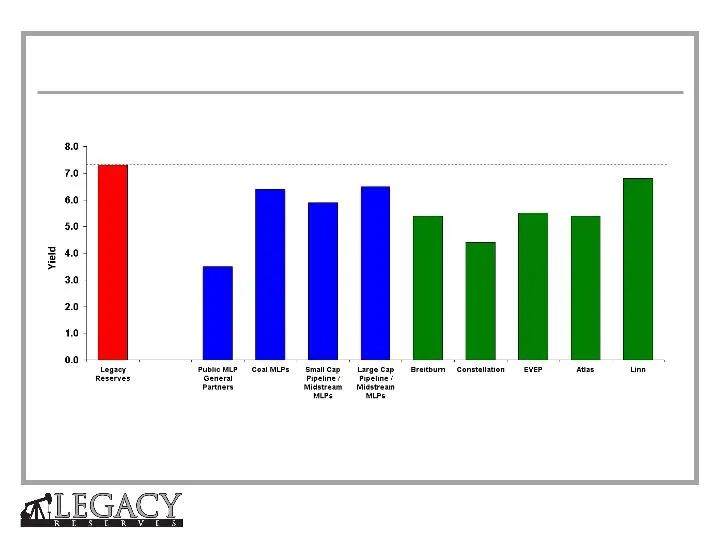
Slide 18: Distribution Yield
Note: Energy MLP data as of 8/22/07. Other MLP Market data from Wachovia Capital Markets Equity Research Department as of 8/13/2007. Large Cap Pipeline / Midstream MLPs Index: Market Cap > $1.4 B. Includes Buckeye, Boardwalk, Enbridge, Energy Transfer, Enterprise, Kinder Morgan, Magellan, Oneok, Pla

Slide 19: Significant Advantages of MLP without IDR
Significant Advantages of MLP without IDR • Lower cost of capital than traditional MLP structure – Unit distribution growth not burdened by IDRs to the GP – Cost of equity equals market yield • Simple and fair alignment of interests among all investors – Investors share equally in all cash flows – W

Slide 20: Legacy Summary
Legacy Summary • Only MLP focused on the oil-weighted Permian Basin • Experienced management team with significant equity ownership • Tax advantaged yield • Significant organic and external growth opportunities • Long-lived, diversified multi-pay properties • Demonstrated reserve replacement capabil

Slide 21: Adjusted EBITDA Reconciliation
Adjusted EBITDA Reconciliation This presentation, the financial tables and other supplemental information, including the reconciliations of certain non-generally accepted accounting principles ("non-GAAP") measures to their nearest comparable generally accepted accounting principles ("GAAP") measure
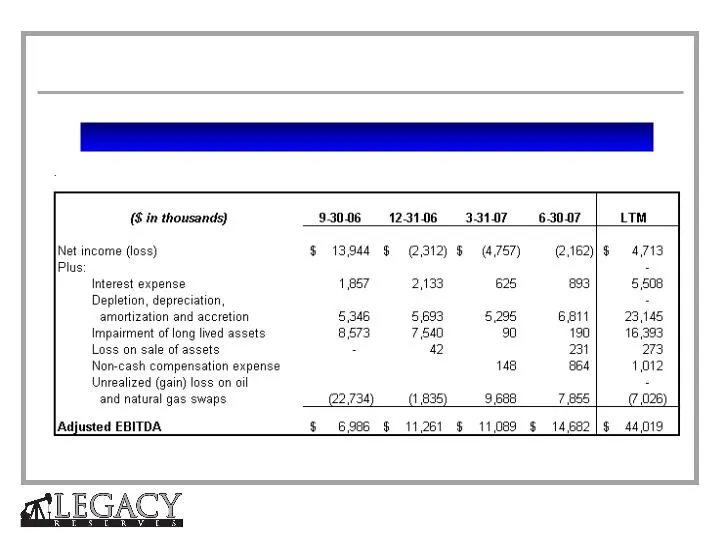
Slide 22: Reconciliation of Net Income to Adjusted EBITDA
Reconciliation of Net Income to Adjusted EBITDA Note: Adjusted EBITDA is a non-GAAP financial measure. Adjusted EBITDA Reconciliation
Source: SEC EDGAR · 8-K filed Aug 23, 2007
More decks from Legacy Reserves LP
 Investor Presentation (June 2019)9 slides · Jun 14, 2019
 Enercom Oil & Gas Conference 201818 slides · Aug 22, 2018
 Q2 2018 Earnings Presentation19 slides · Aug 2, 2018
 IPAA OGIS New York April 201812 slides · Apr 9, 2018
 Merger or Acquisition (March 2018)9 slides · Mar 26, 2018
 Executive Oil Conference 200919 slides · Apr 14, 2009