Investors Bancorp — New Investors Bancorp — IPO Roadshow (April 2014)
31 slides from Investors Bancorp's IPO roadshow presentation, Apr 21, 2014
Slide 1: Investor Presentation
Issuer Free Writing Prospectus Filed Pursuant to Rule 433 Registration No. 333-192966 April 21, 2014 Investor Presentation April 21, 2014 Second-Step Conversion Offering
Slide 2: Free Writing Prospectus
Free Writing Prospectus New Investors Bancorp, Inc. (“New Investors Bancorp”) has filed a registration statement (including a prospectus) with the SEC for the offering to which this communication relates. Before you invest, you should read the prospectus in that registration statement and other docu
Slide 3: I. Offering Summary
I. Offering Summary & investors Bancorp,»
Slide 4: Offering Summary
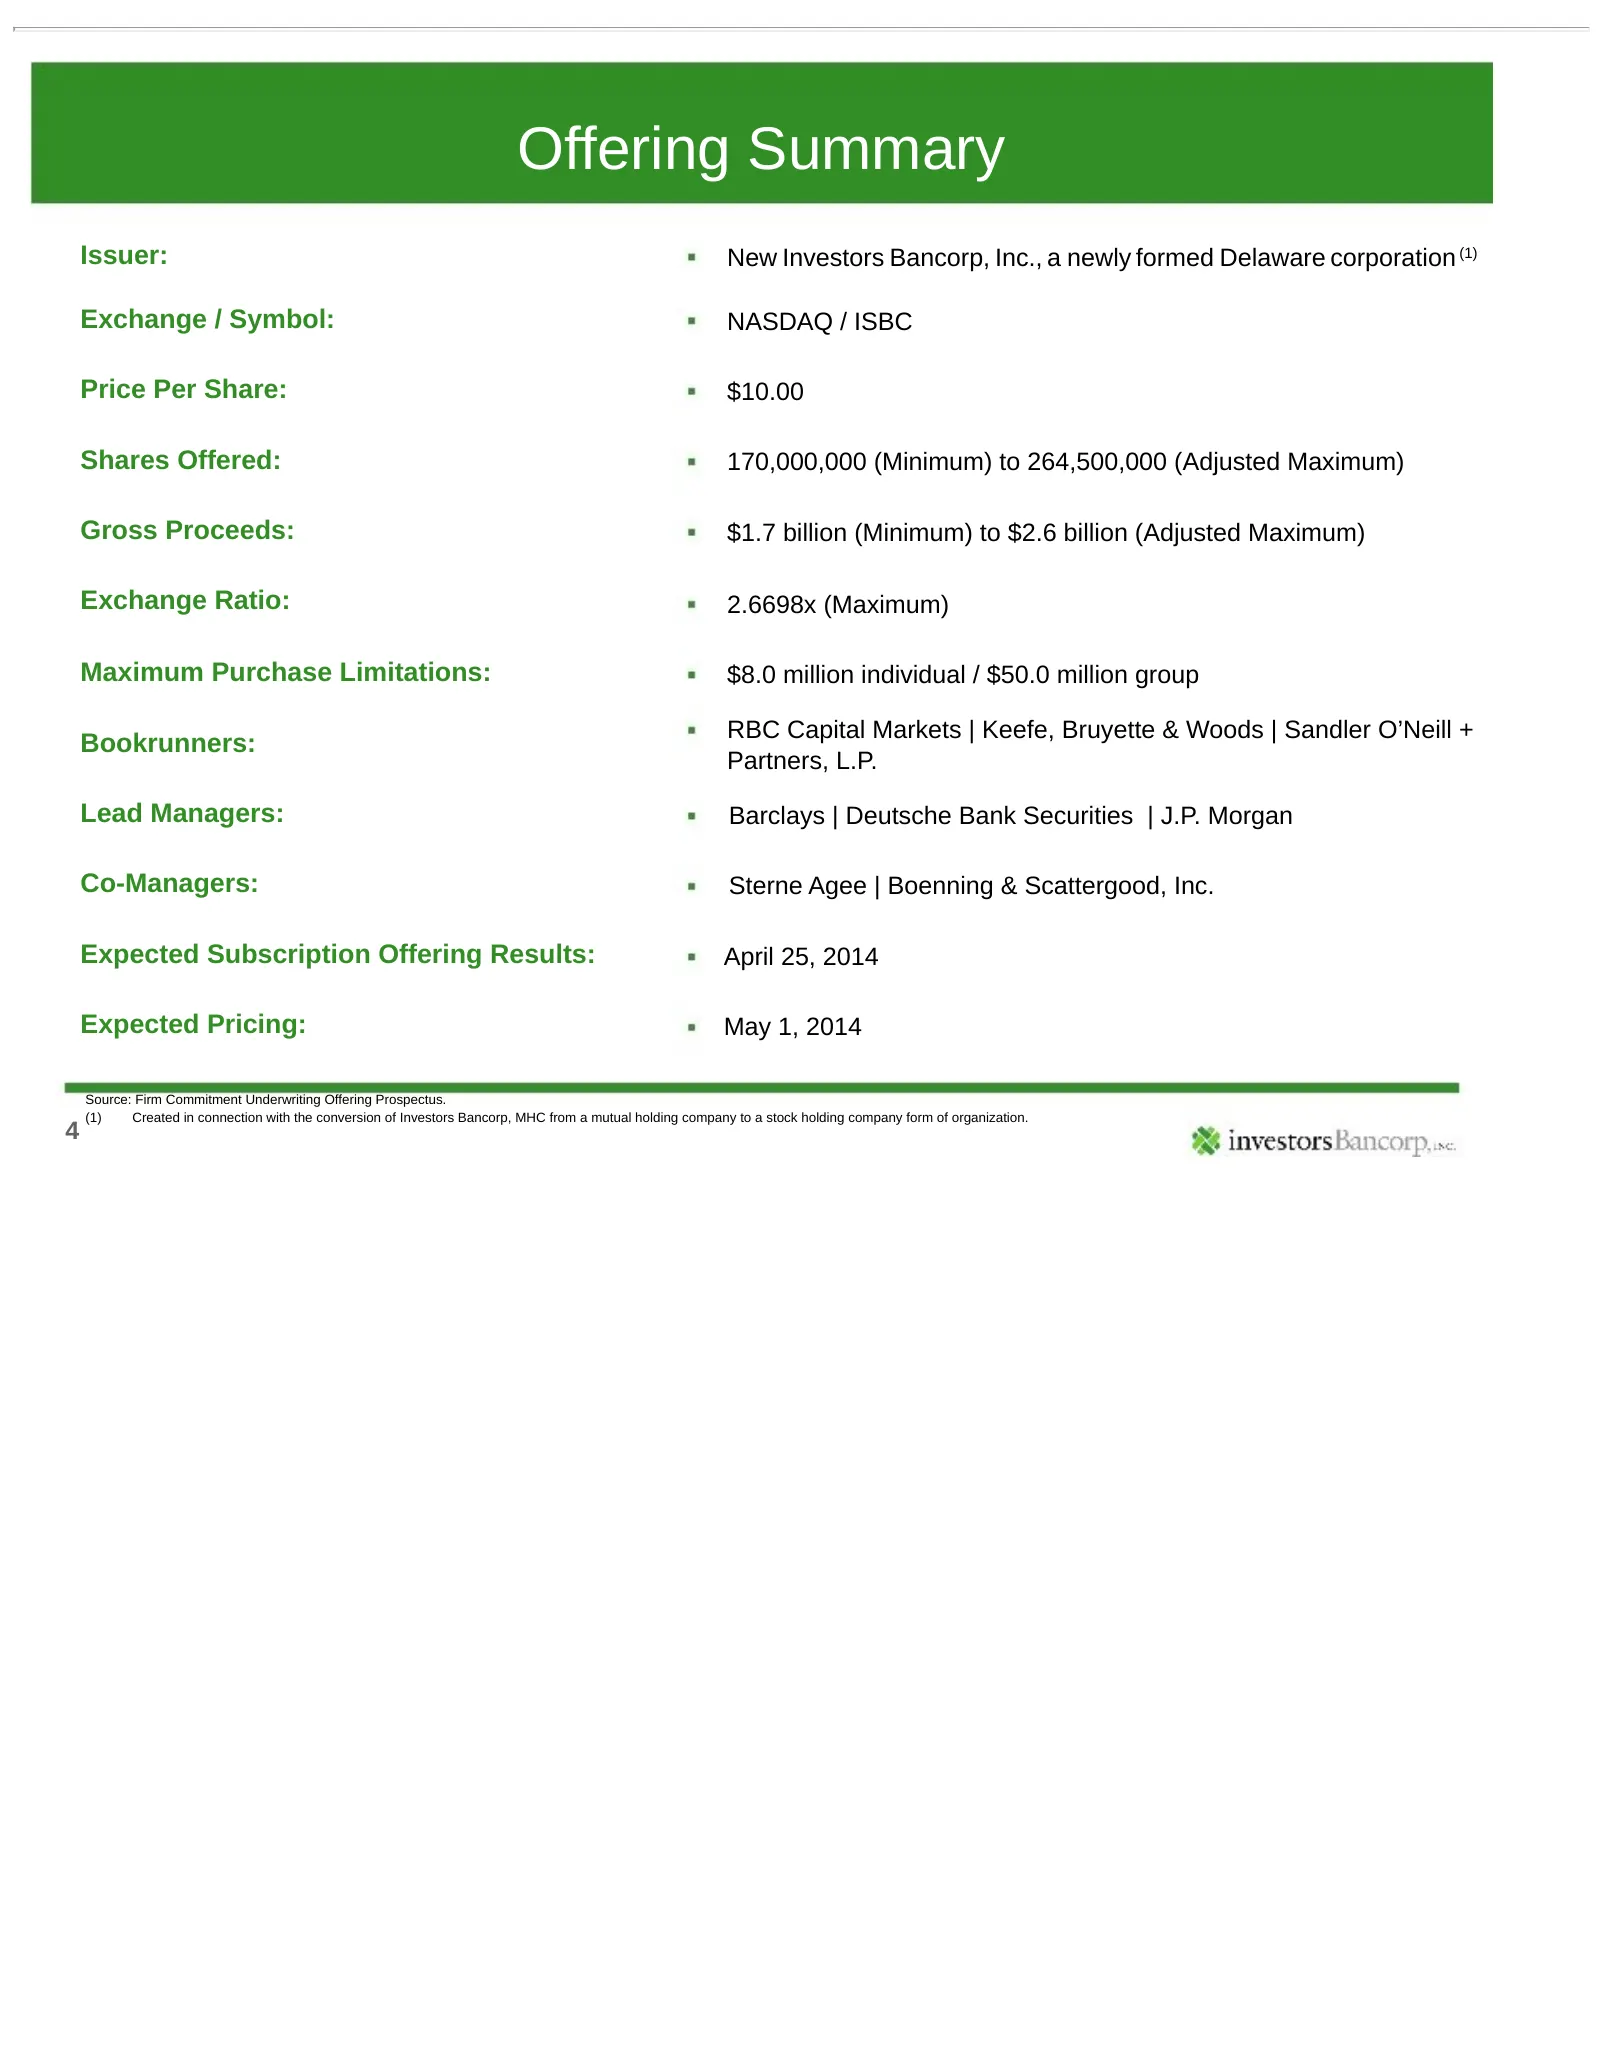
Offering Summary Issuer: New Investors Bancorp, Inc., a newly formed Delaware corporation (1) Exchange / Symbol: NASDAQ / ISBC Price Per Share: $10.00 Shares Offered: 170,000,000 (Minimum) to 264,500,000 (Adjusted Maximum) Gross Proceeds: $1.7 billion (Minimum) to $2.6 billion (Adjusted Maximum) Exc
Slide 5: Pro Forma Financial Information
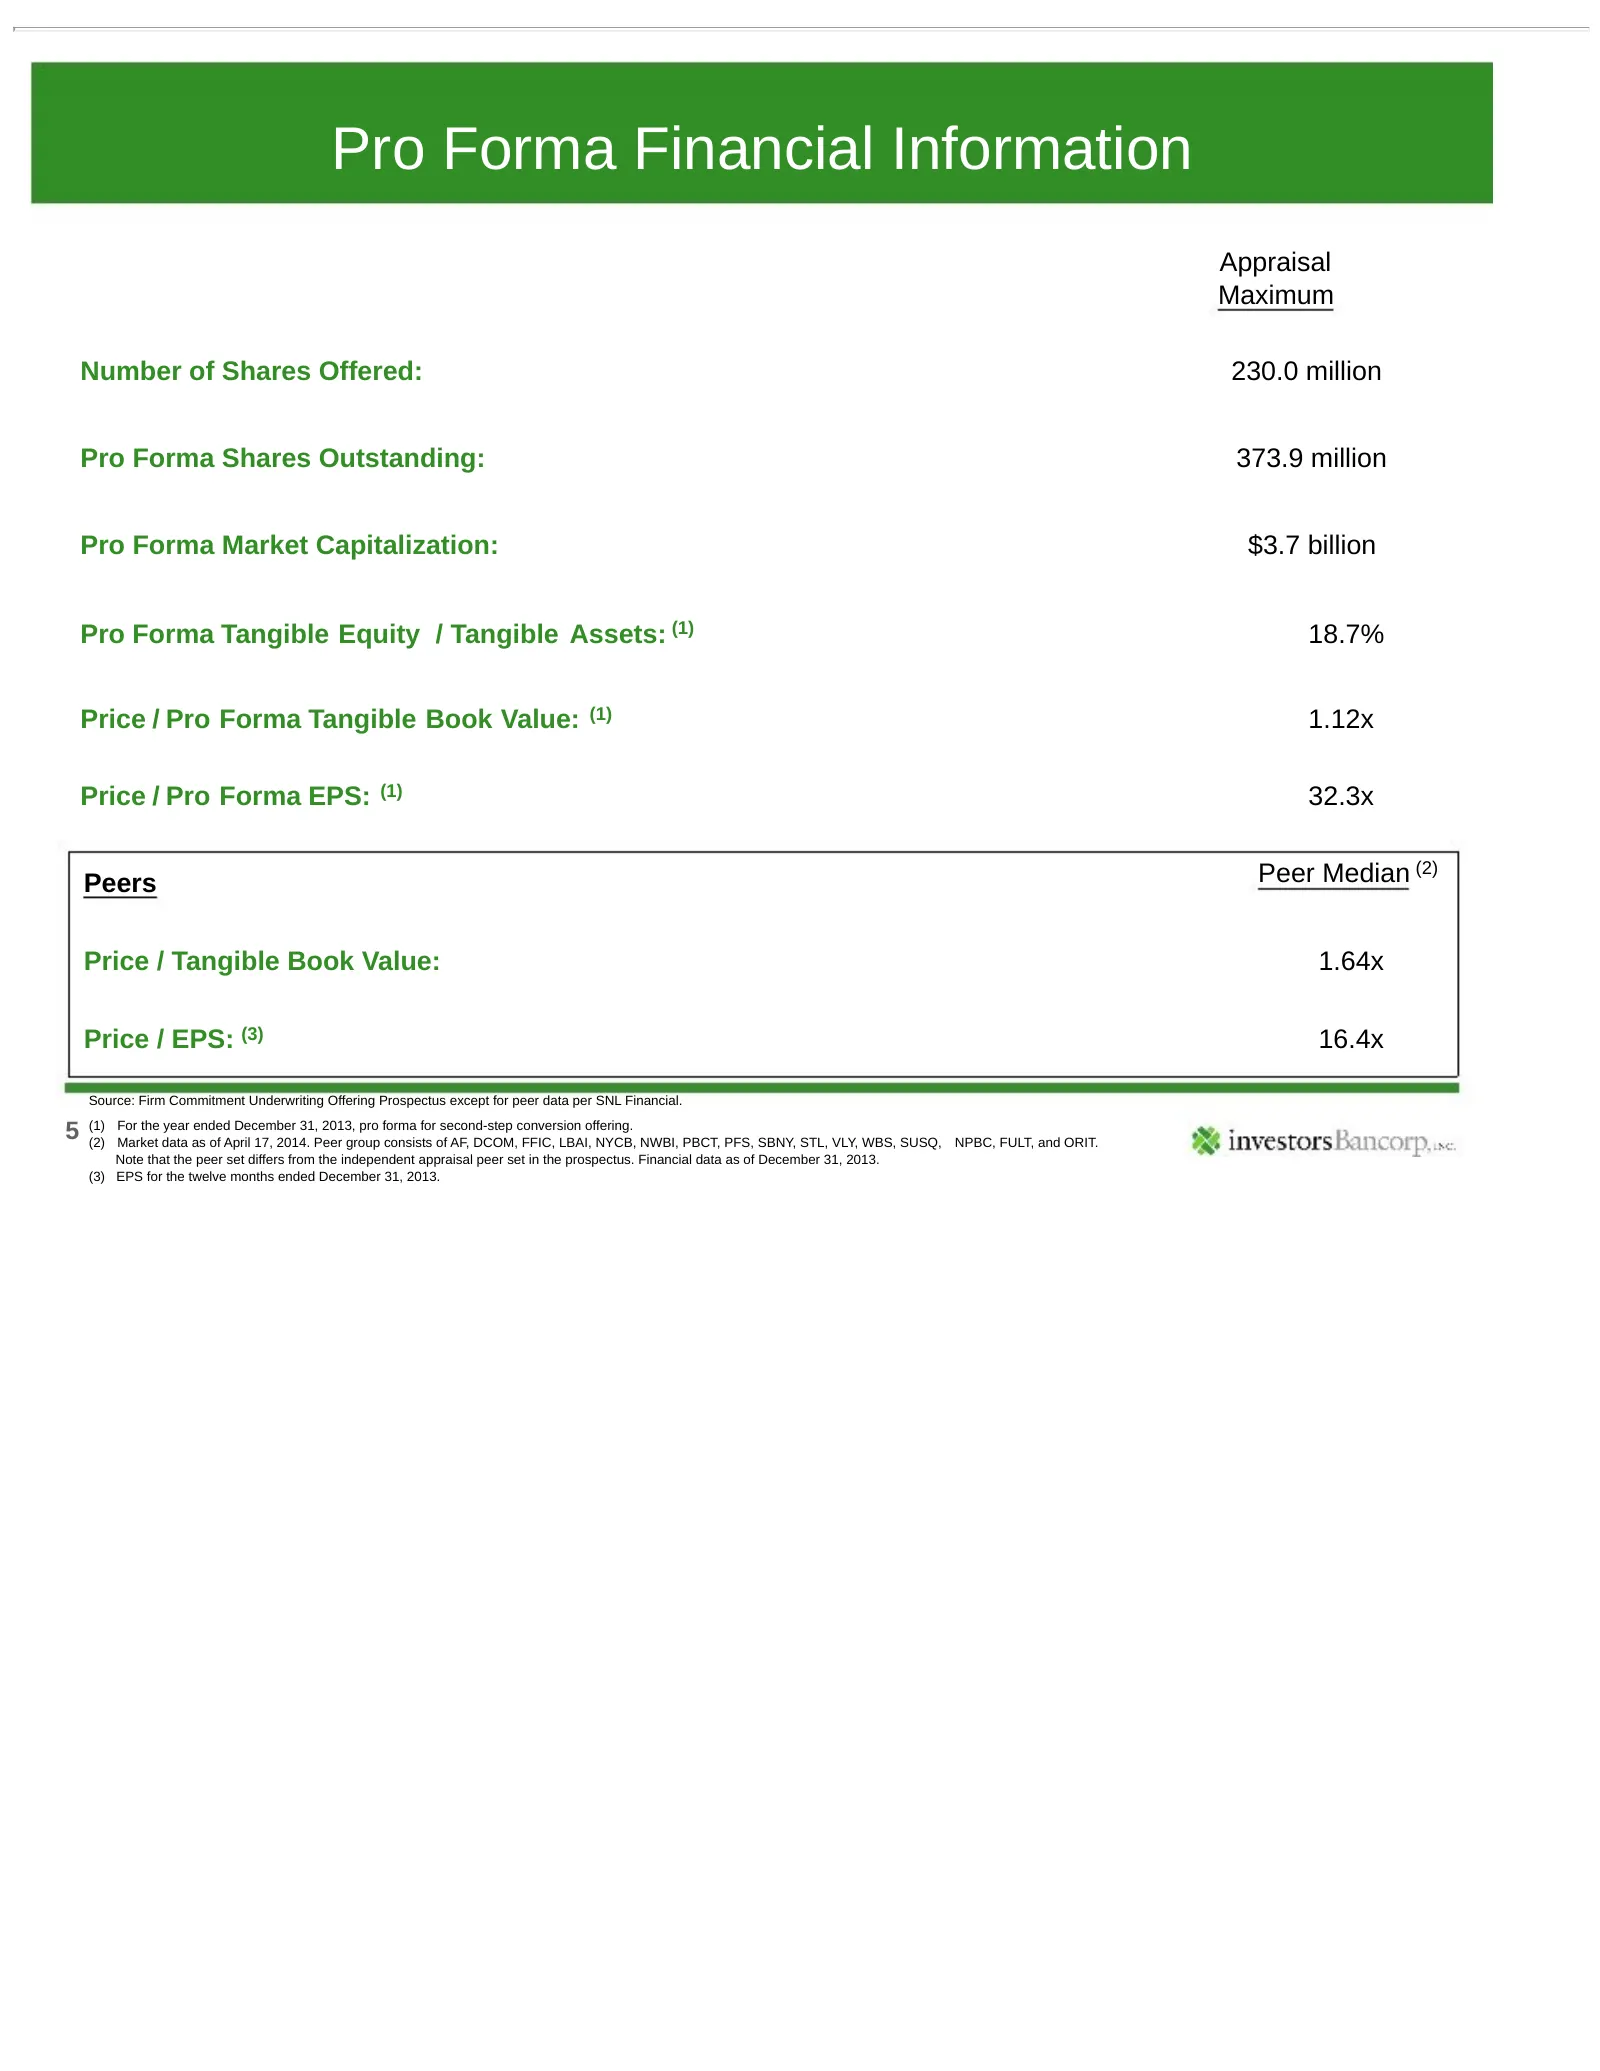
Pro Forma Financial Information Appraisal Maximum Number of Shares Offered: 230.0 million Pro Forma Shares Outstanding: 373.9 million Pro Forma Market Capitalization: $3.7 billion Pro Forma Tangible Equity / Tangible Assets: (1) 18.7% Price / Pro Forma Tangible Book Value: (1) 1.12x Price / Pro Form
Slide 6: Conversion Structure
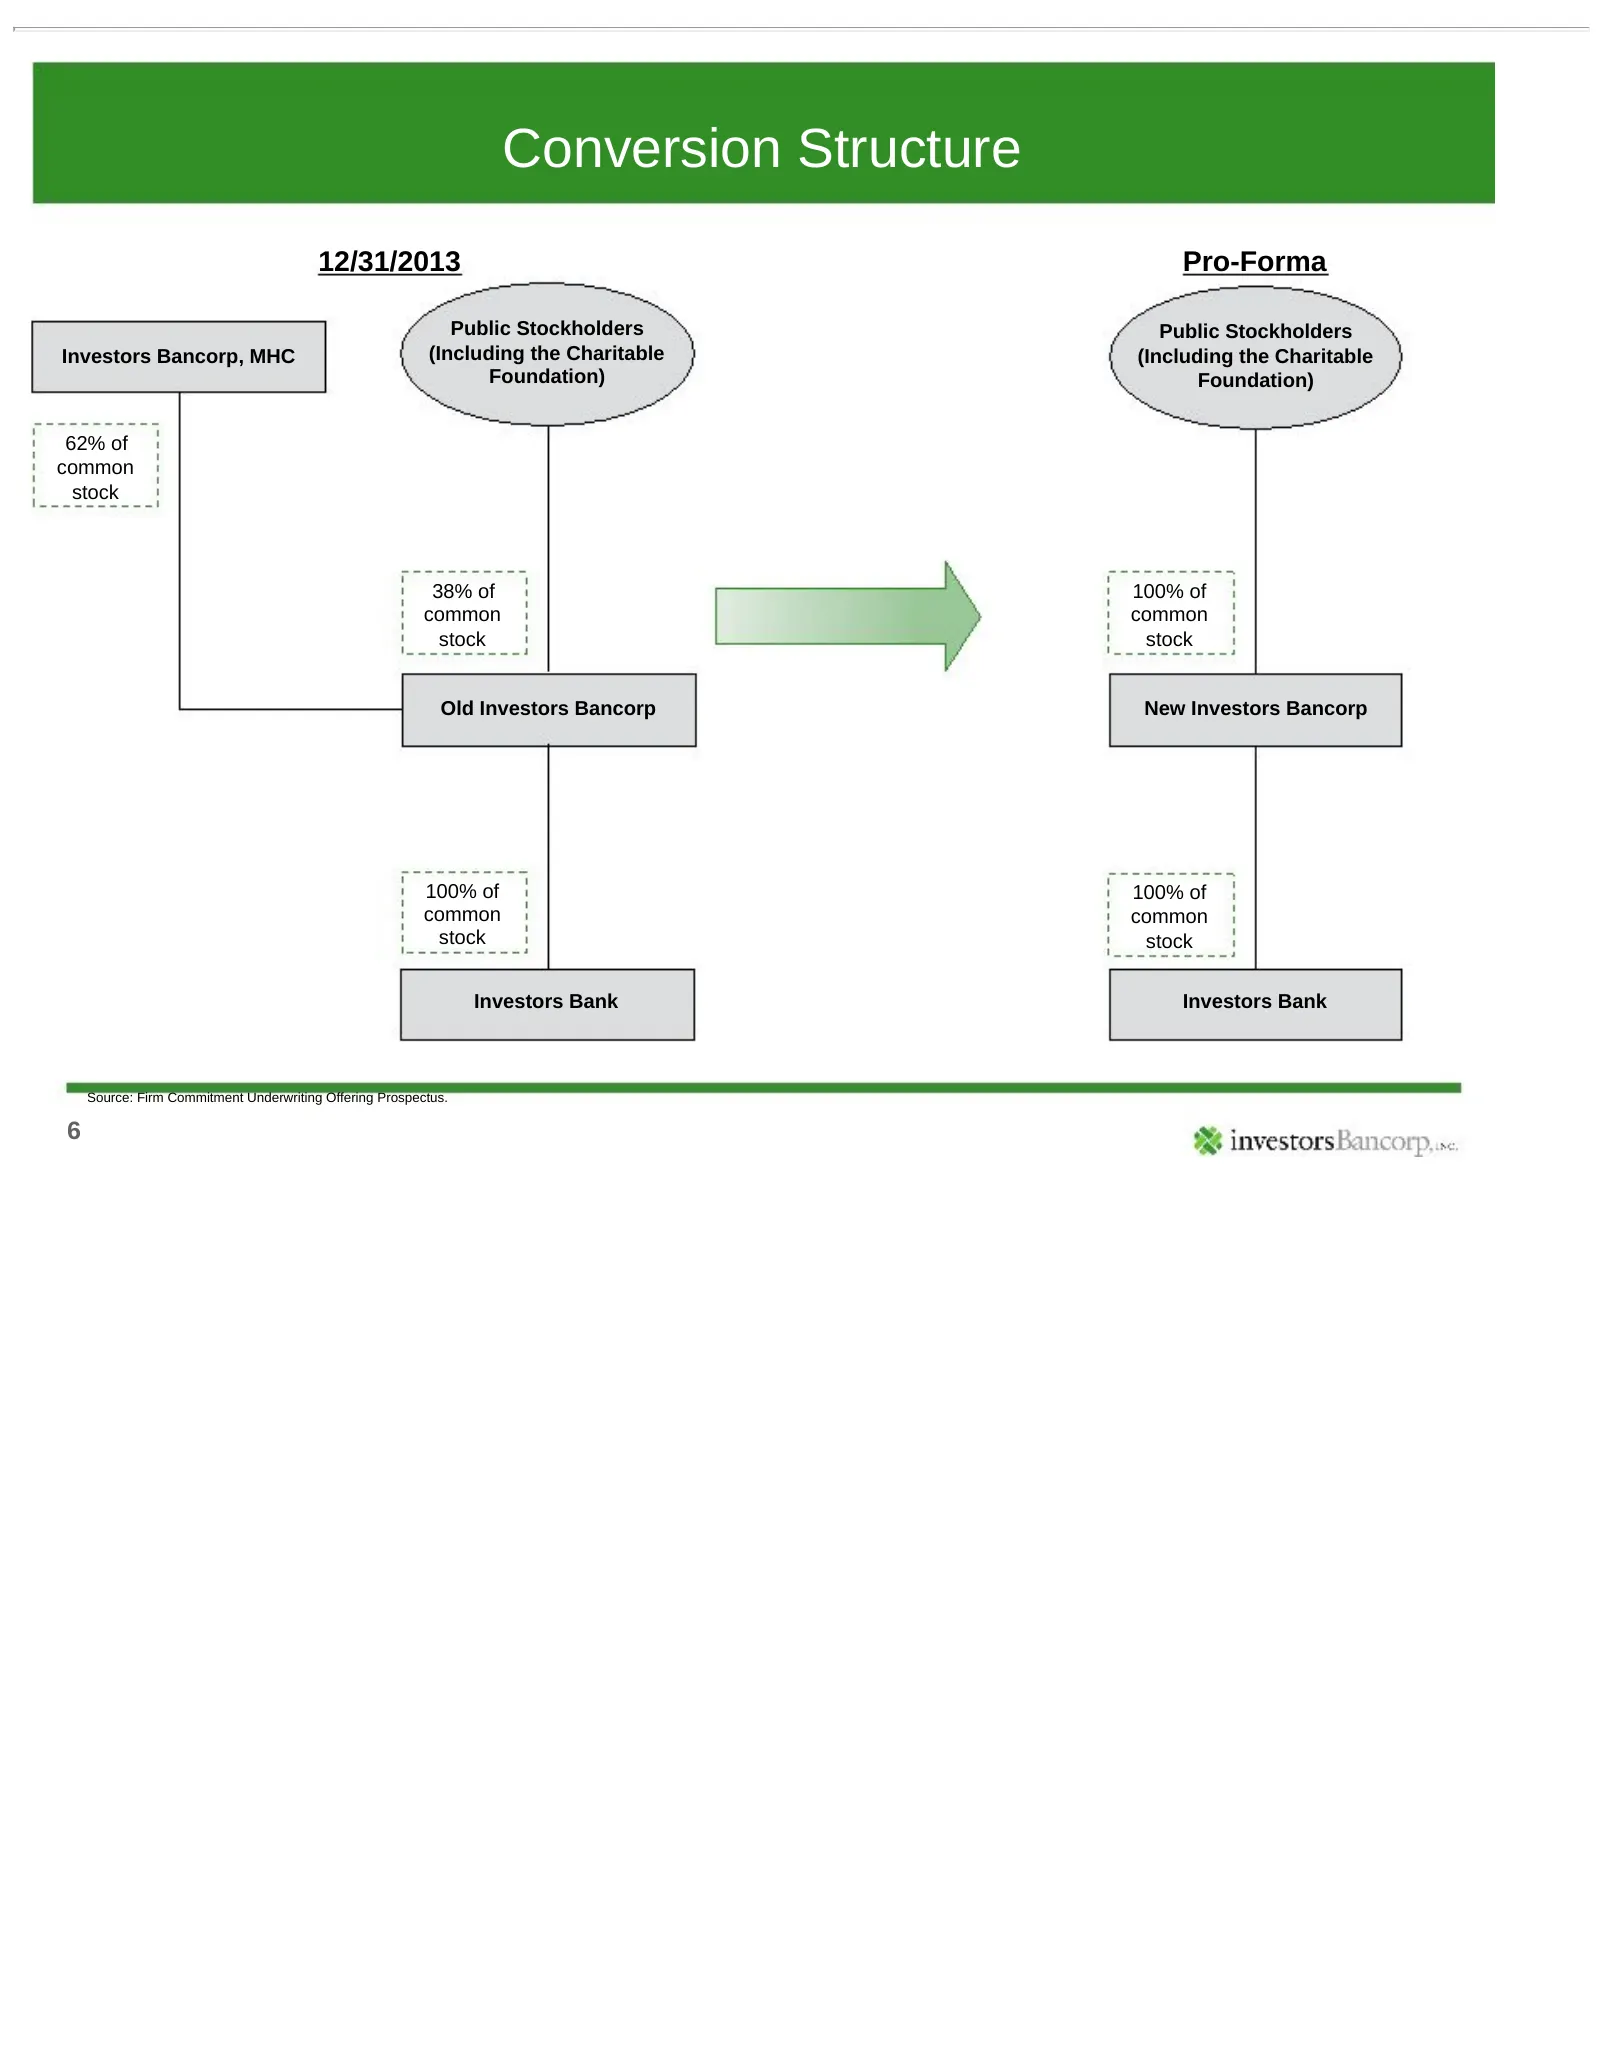
Conversion Structure 12/31/2013 Pro-Forma Public Stockholders Public Stockholders Investors Bancorp, MHC (Including the Charitable (Including the Charitable Foundation) Foundation) 62% of common stock 38% of 100% of common common stock stock Old Investors Bancorp New Investors Bancorp 100% of 100% o
Slide 7: II. Investment & Company Highlights
II. Investment & Company Highlights 7
Slide 8: Largest Bank Headquartered in New Jersey and Fifth Largest in Metro NY
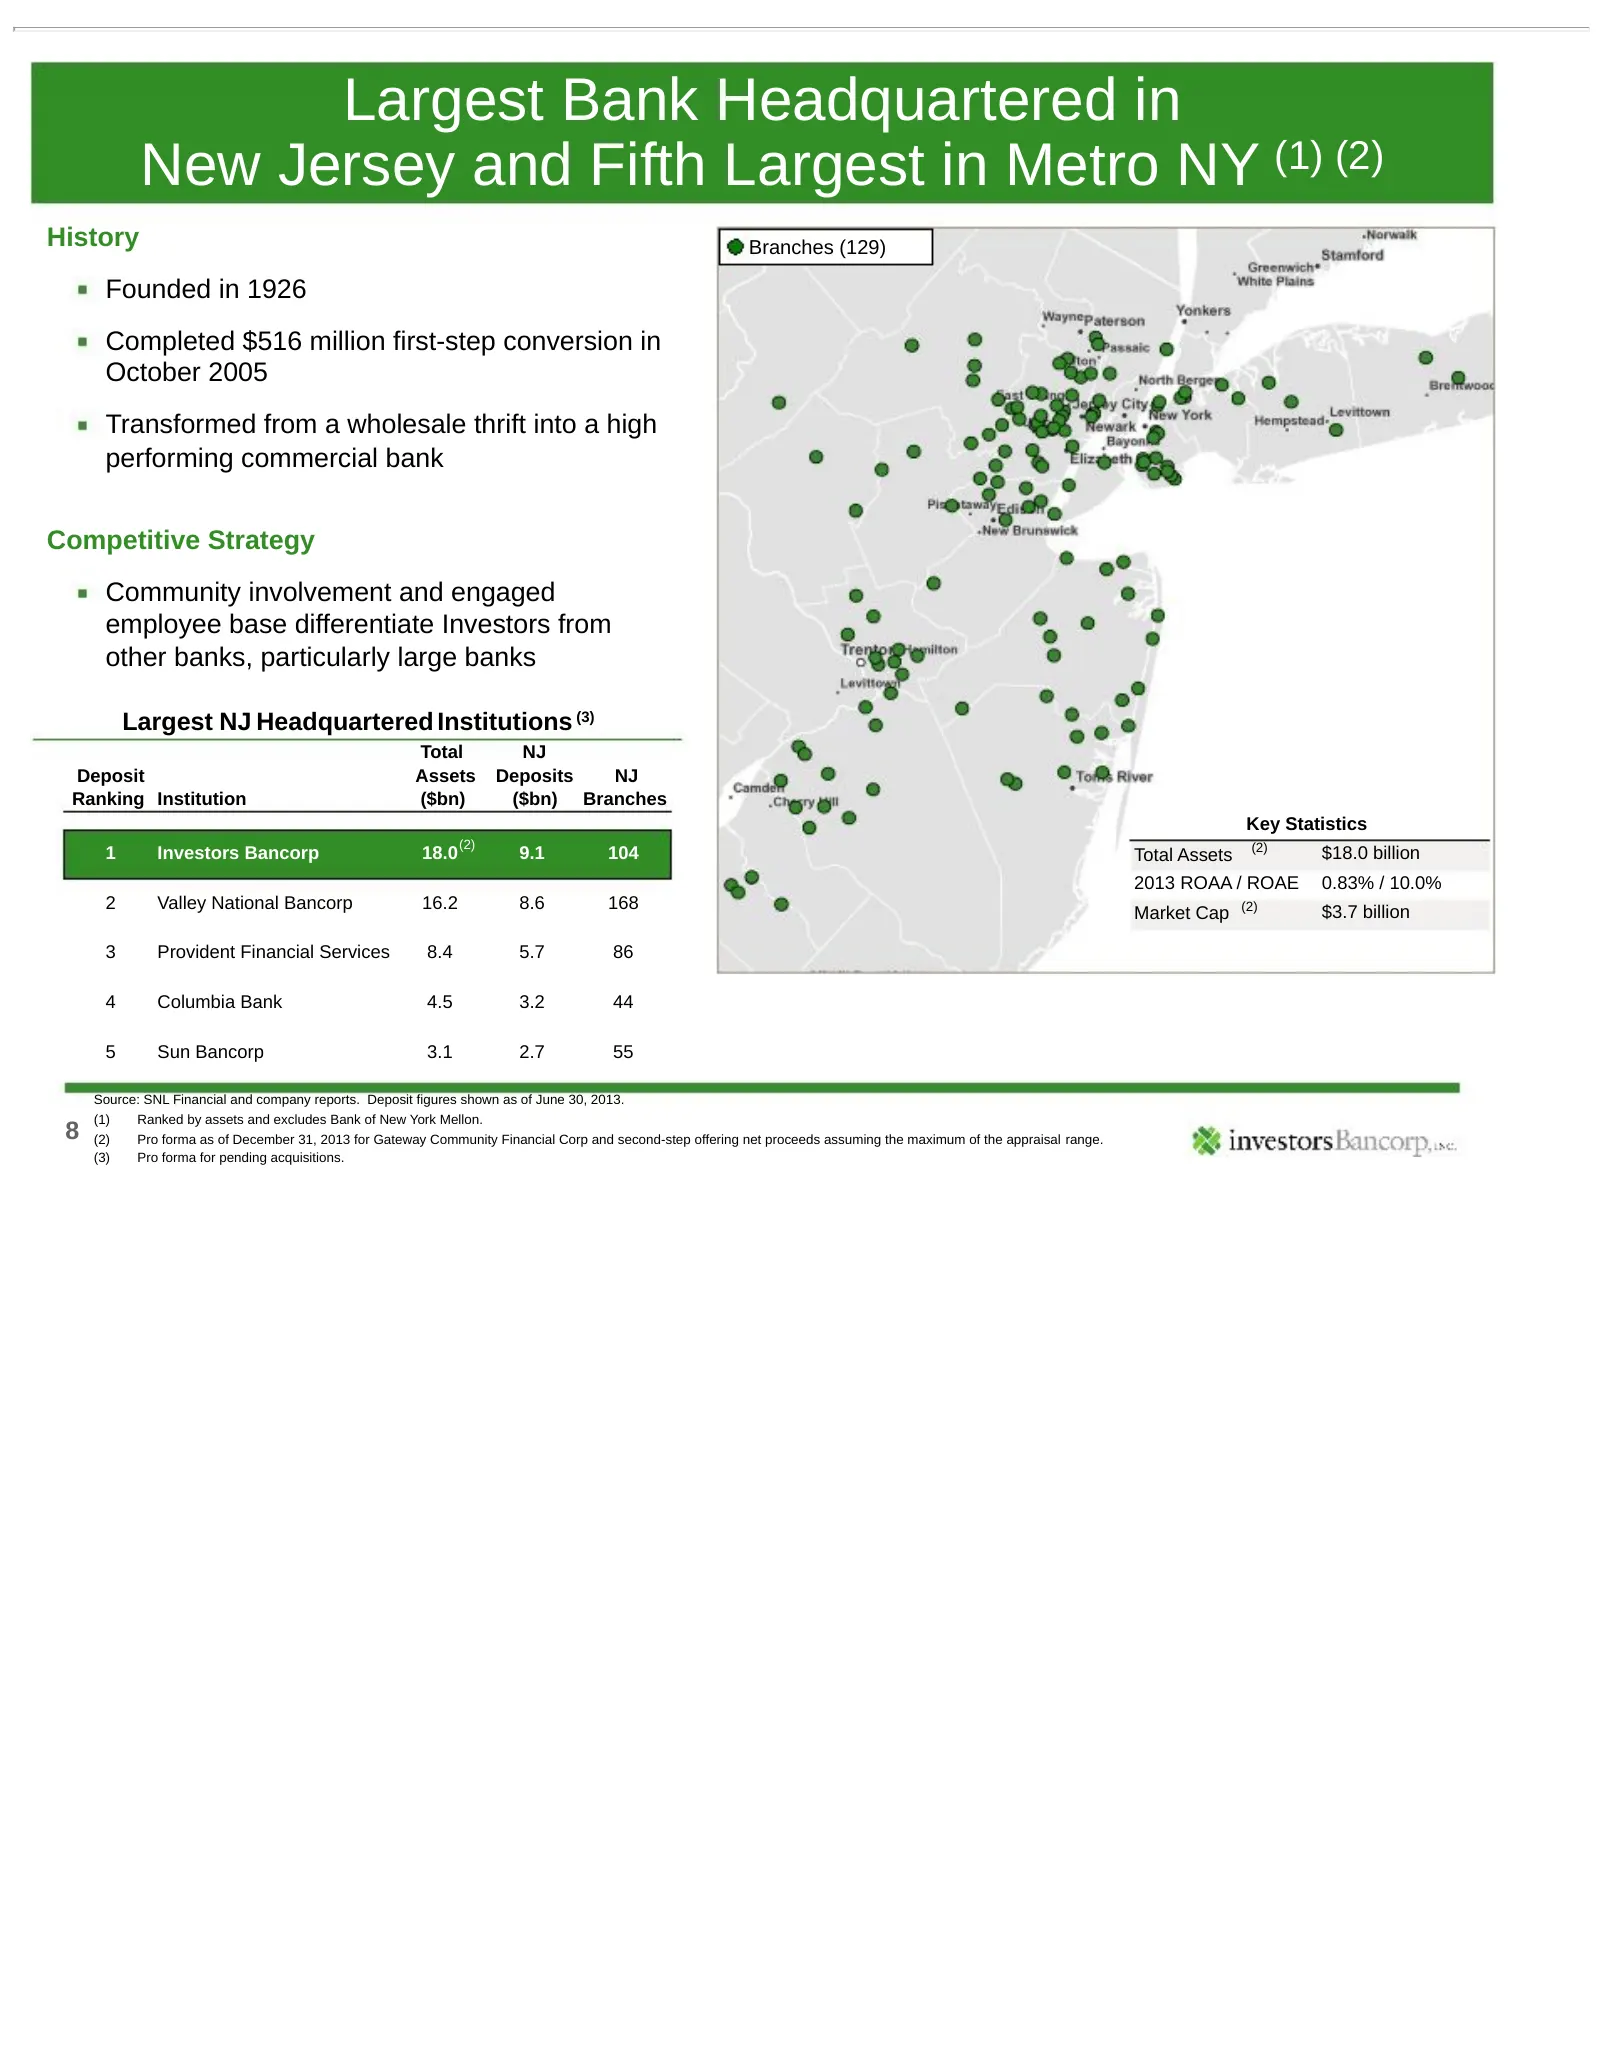
Largest Bank Headquartered in New Jersey and Fifth Largest in Metro NY (1) (2) History Branches (129) Founded in 1926 Completed $516 million first-step conversion in October 2005 Transformed from a wholesale thrift into a high performing commercial bank Competitive Strategy Community involvement and
Slide 9: Investment Rationale
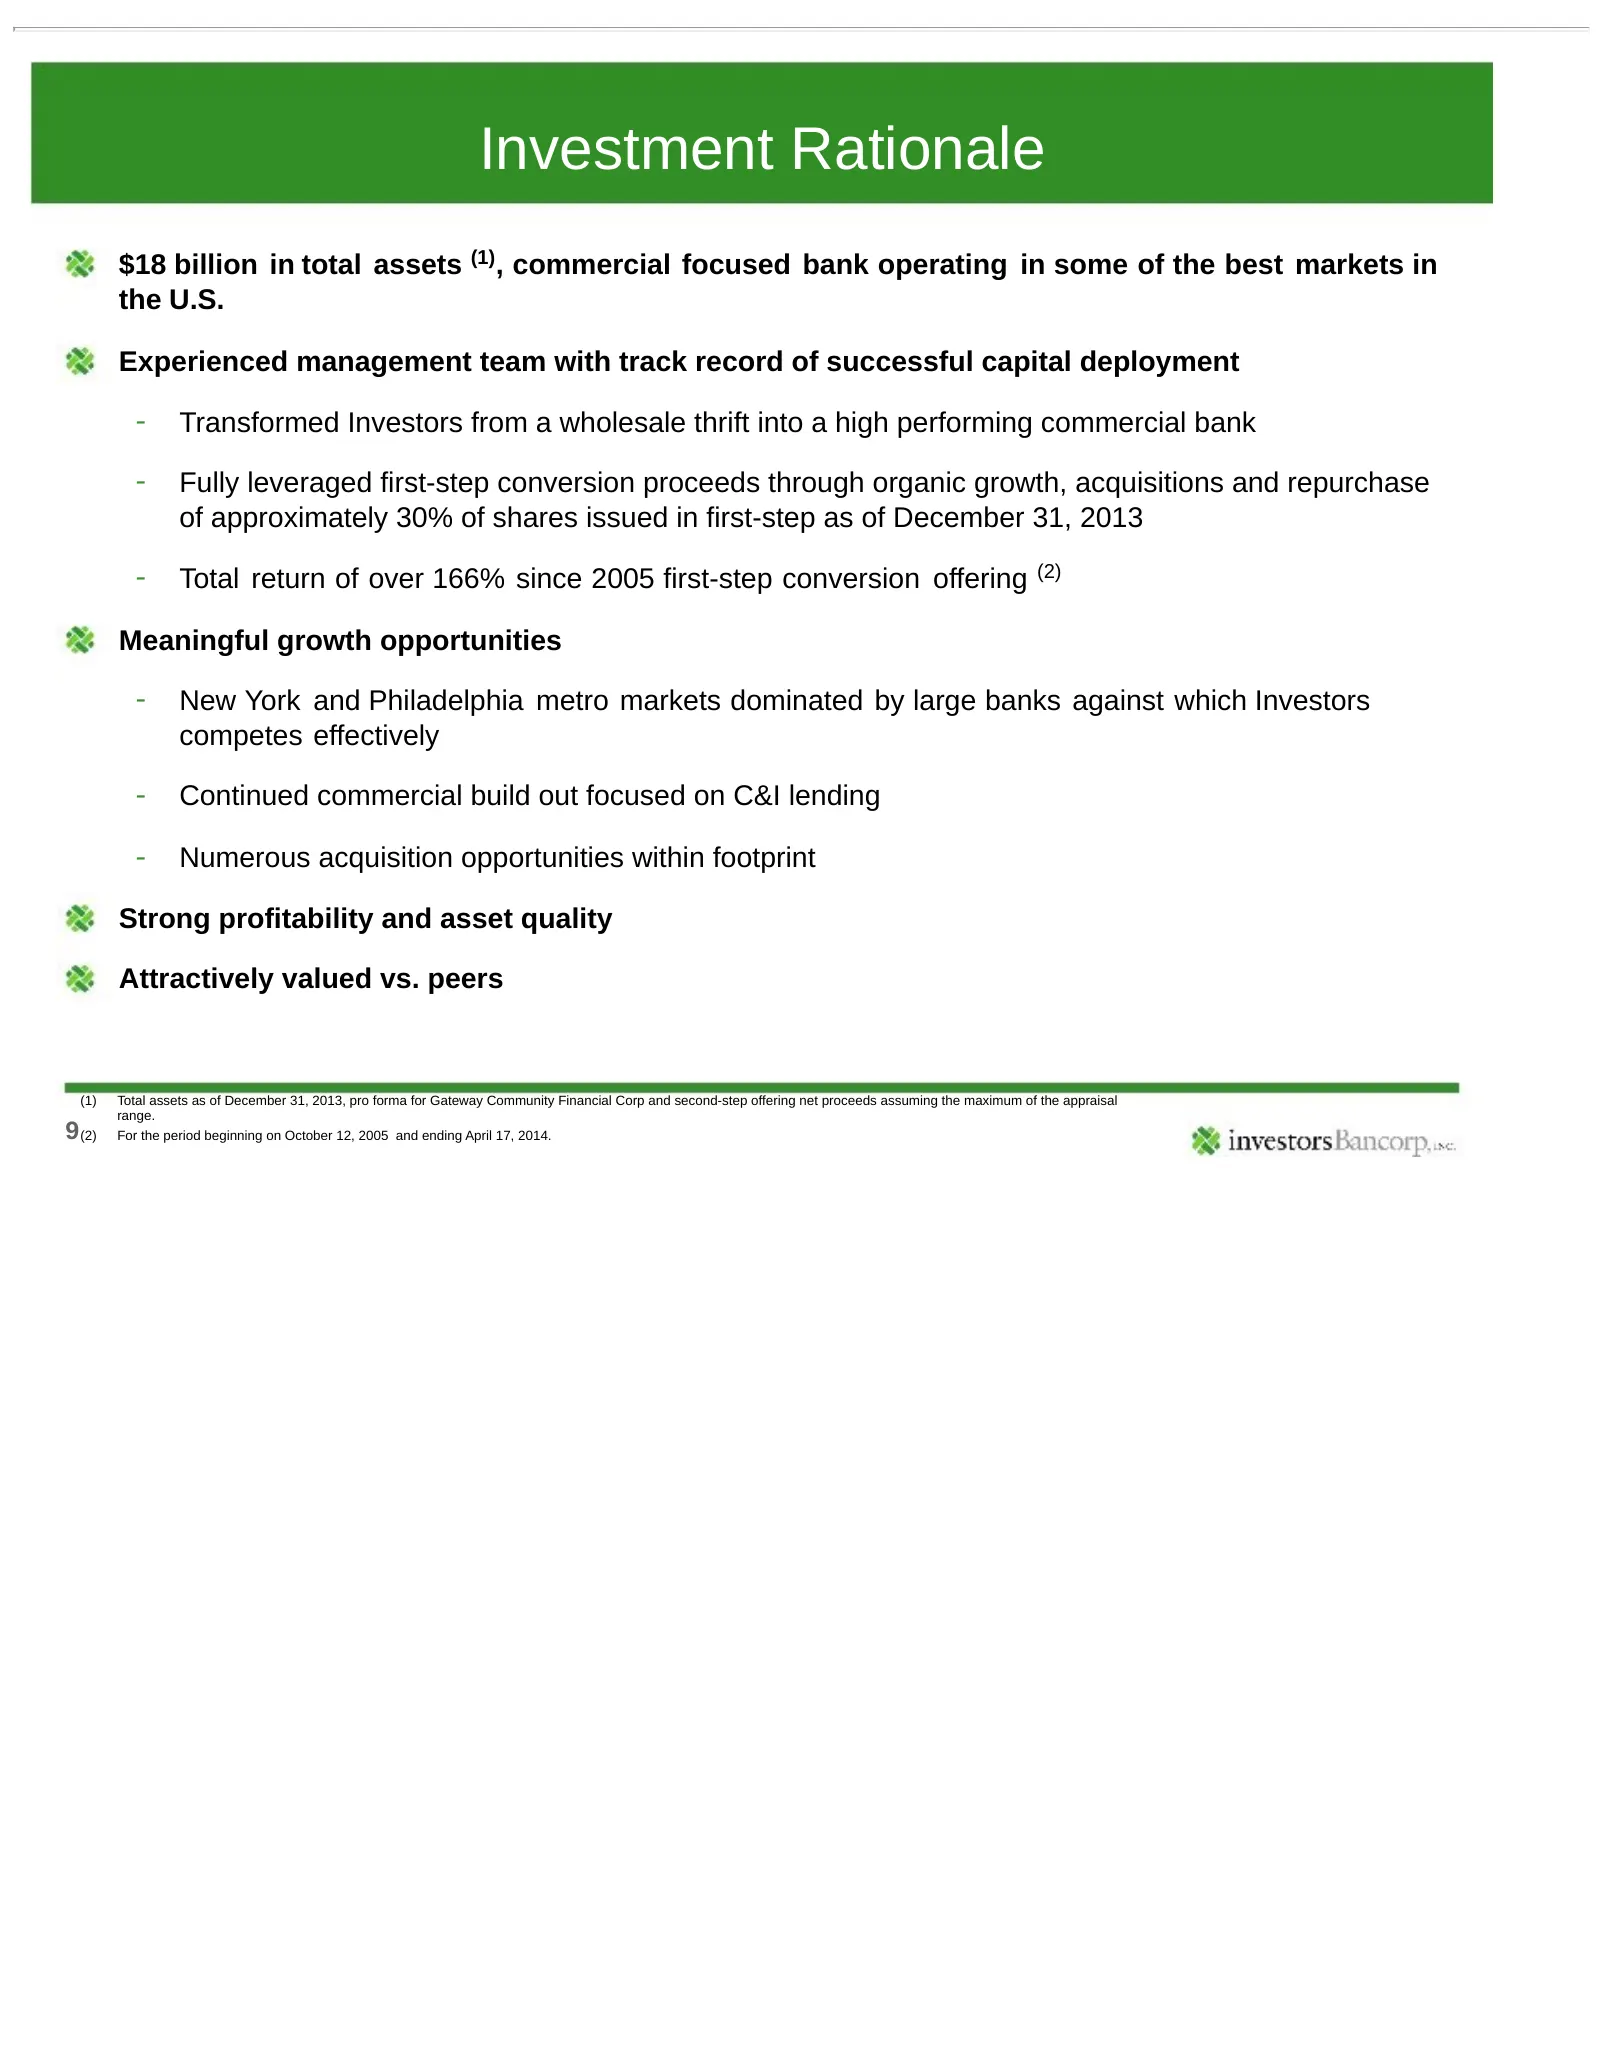
Investment Rationale $18 billion in total assets (1), commercial focused bank operating in some of the best markets in the U.S. Experienced management team with track record of successful capital deployment - Transformed Investors from a wholesale thrift into a high performing commercial bank - Full
Slide 10: Experienced Management Team
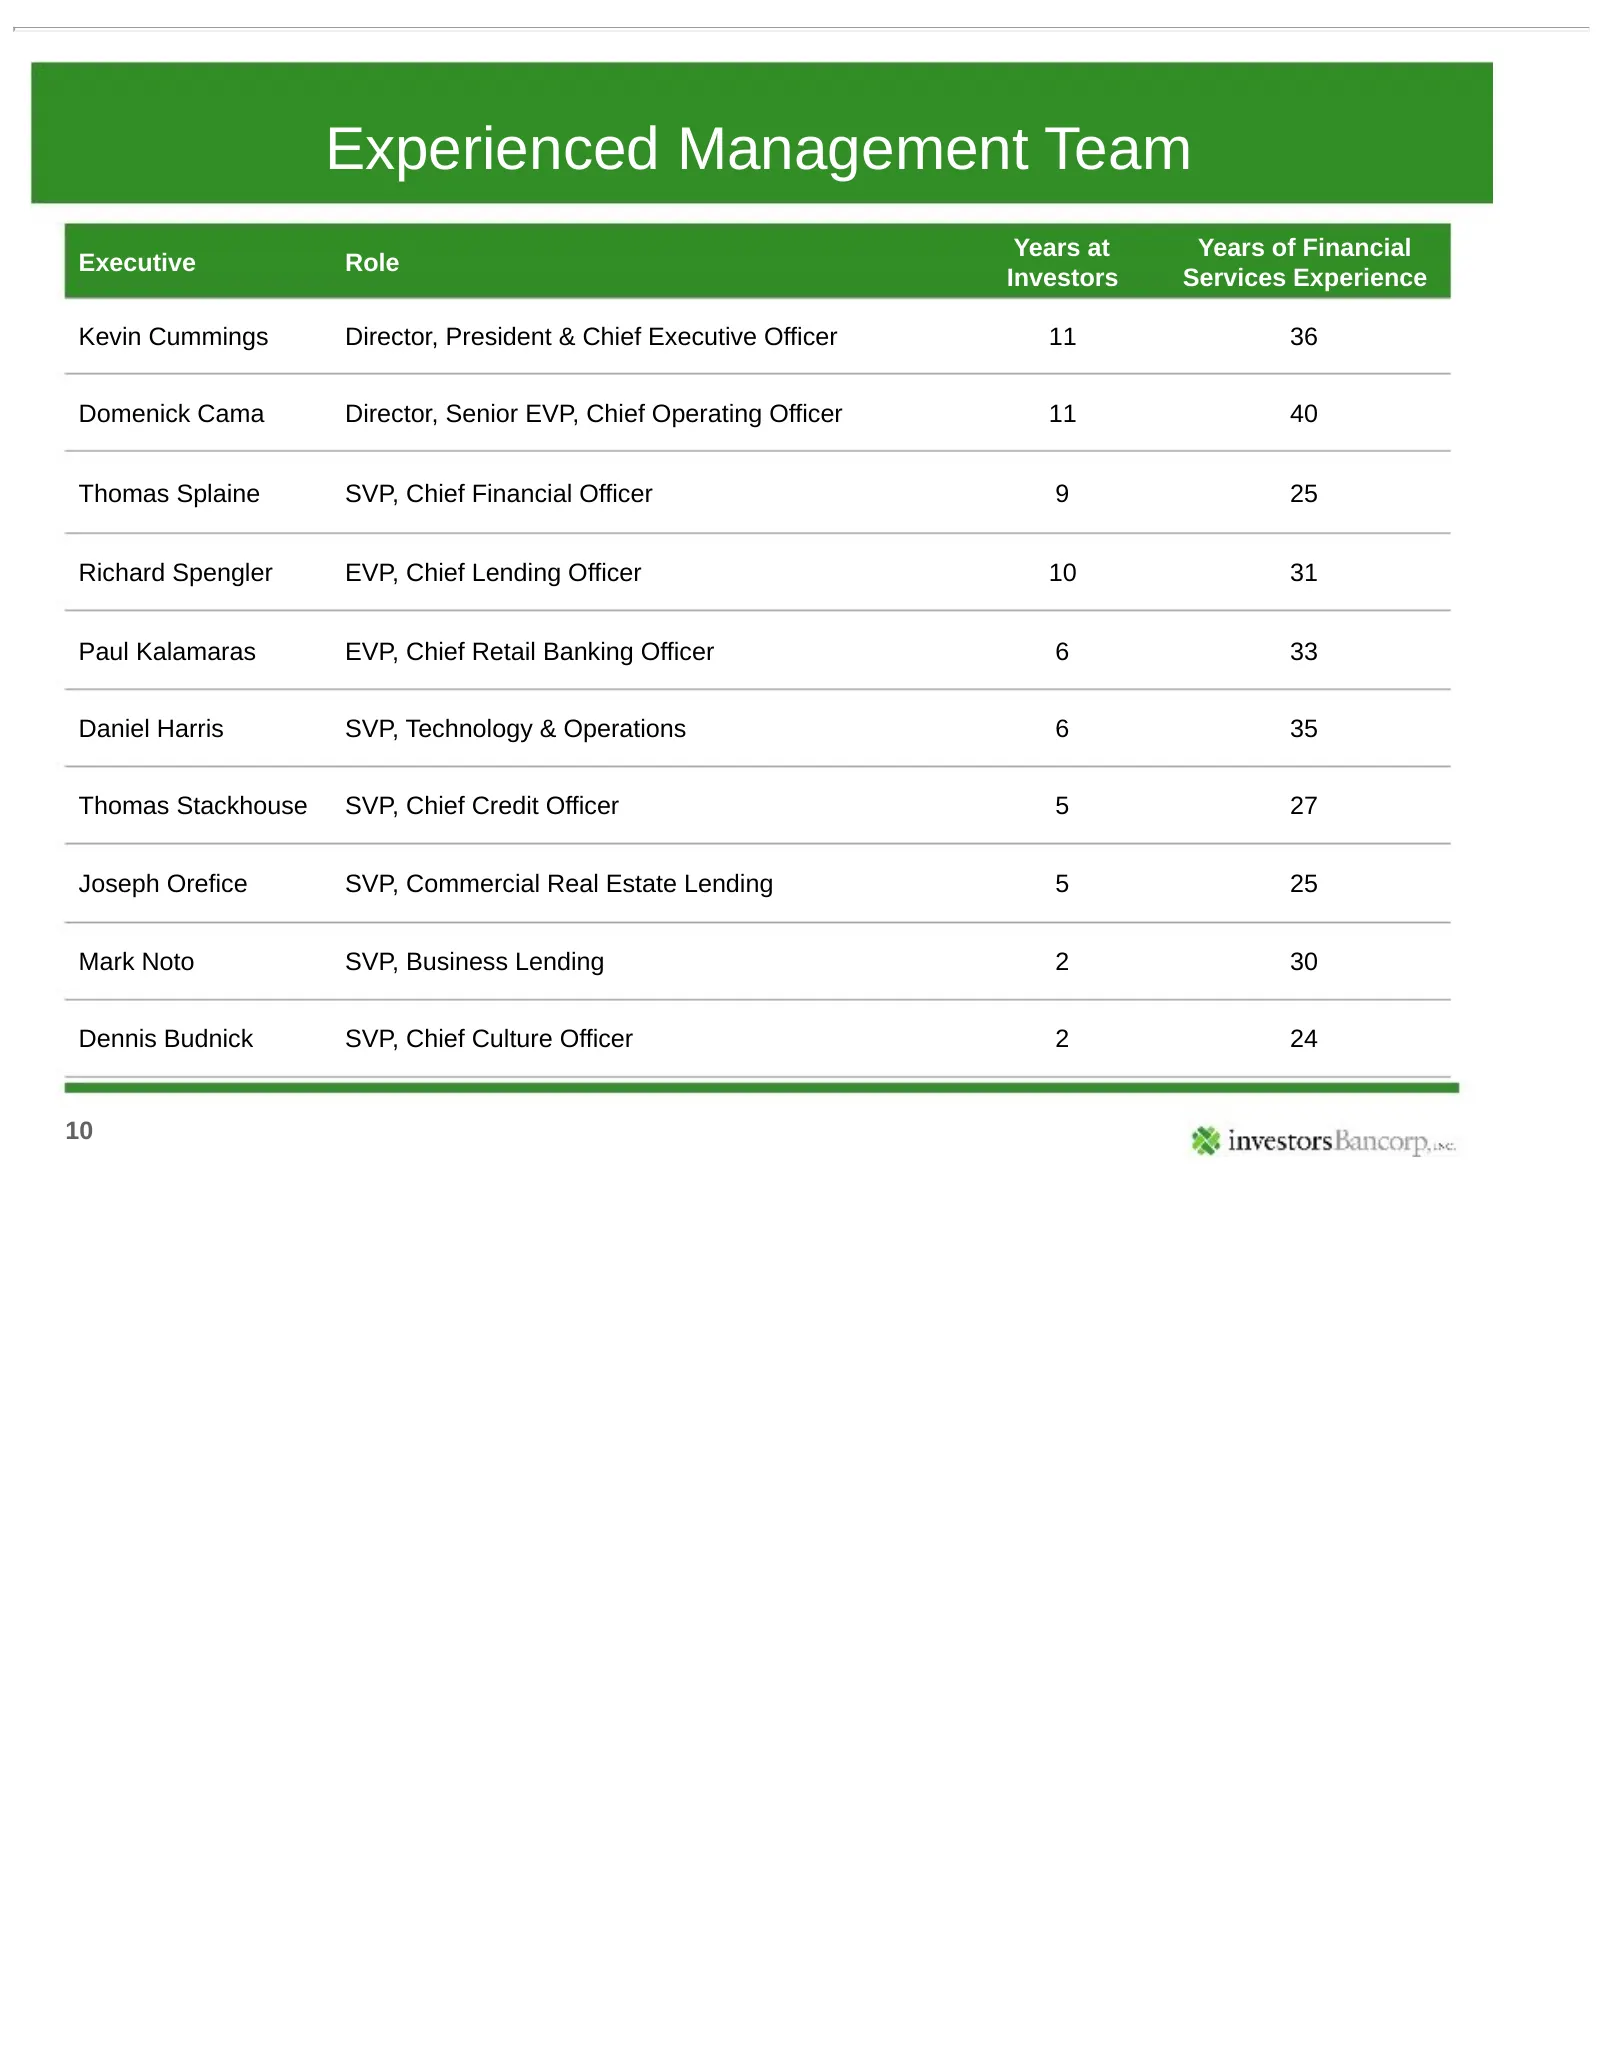
Experienced Management Team Years at Years of Financial Executive Role Investors Services Experience Kevin Cummings Director, President & Chief Executive Officer 11 36 Domenick Cama Director, Senior EVP, Chief Operating Officer 11 40 Thomas Splaine SVP, Chief Financial Officer 9 25 Richard Spengler
Slide 11: Growth Since First-Step Conversion
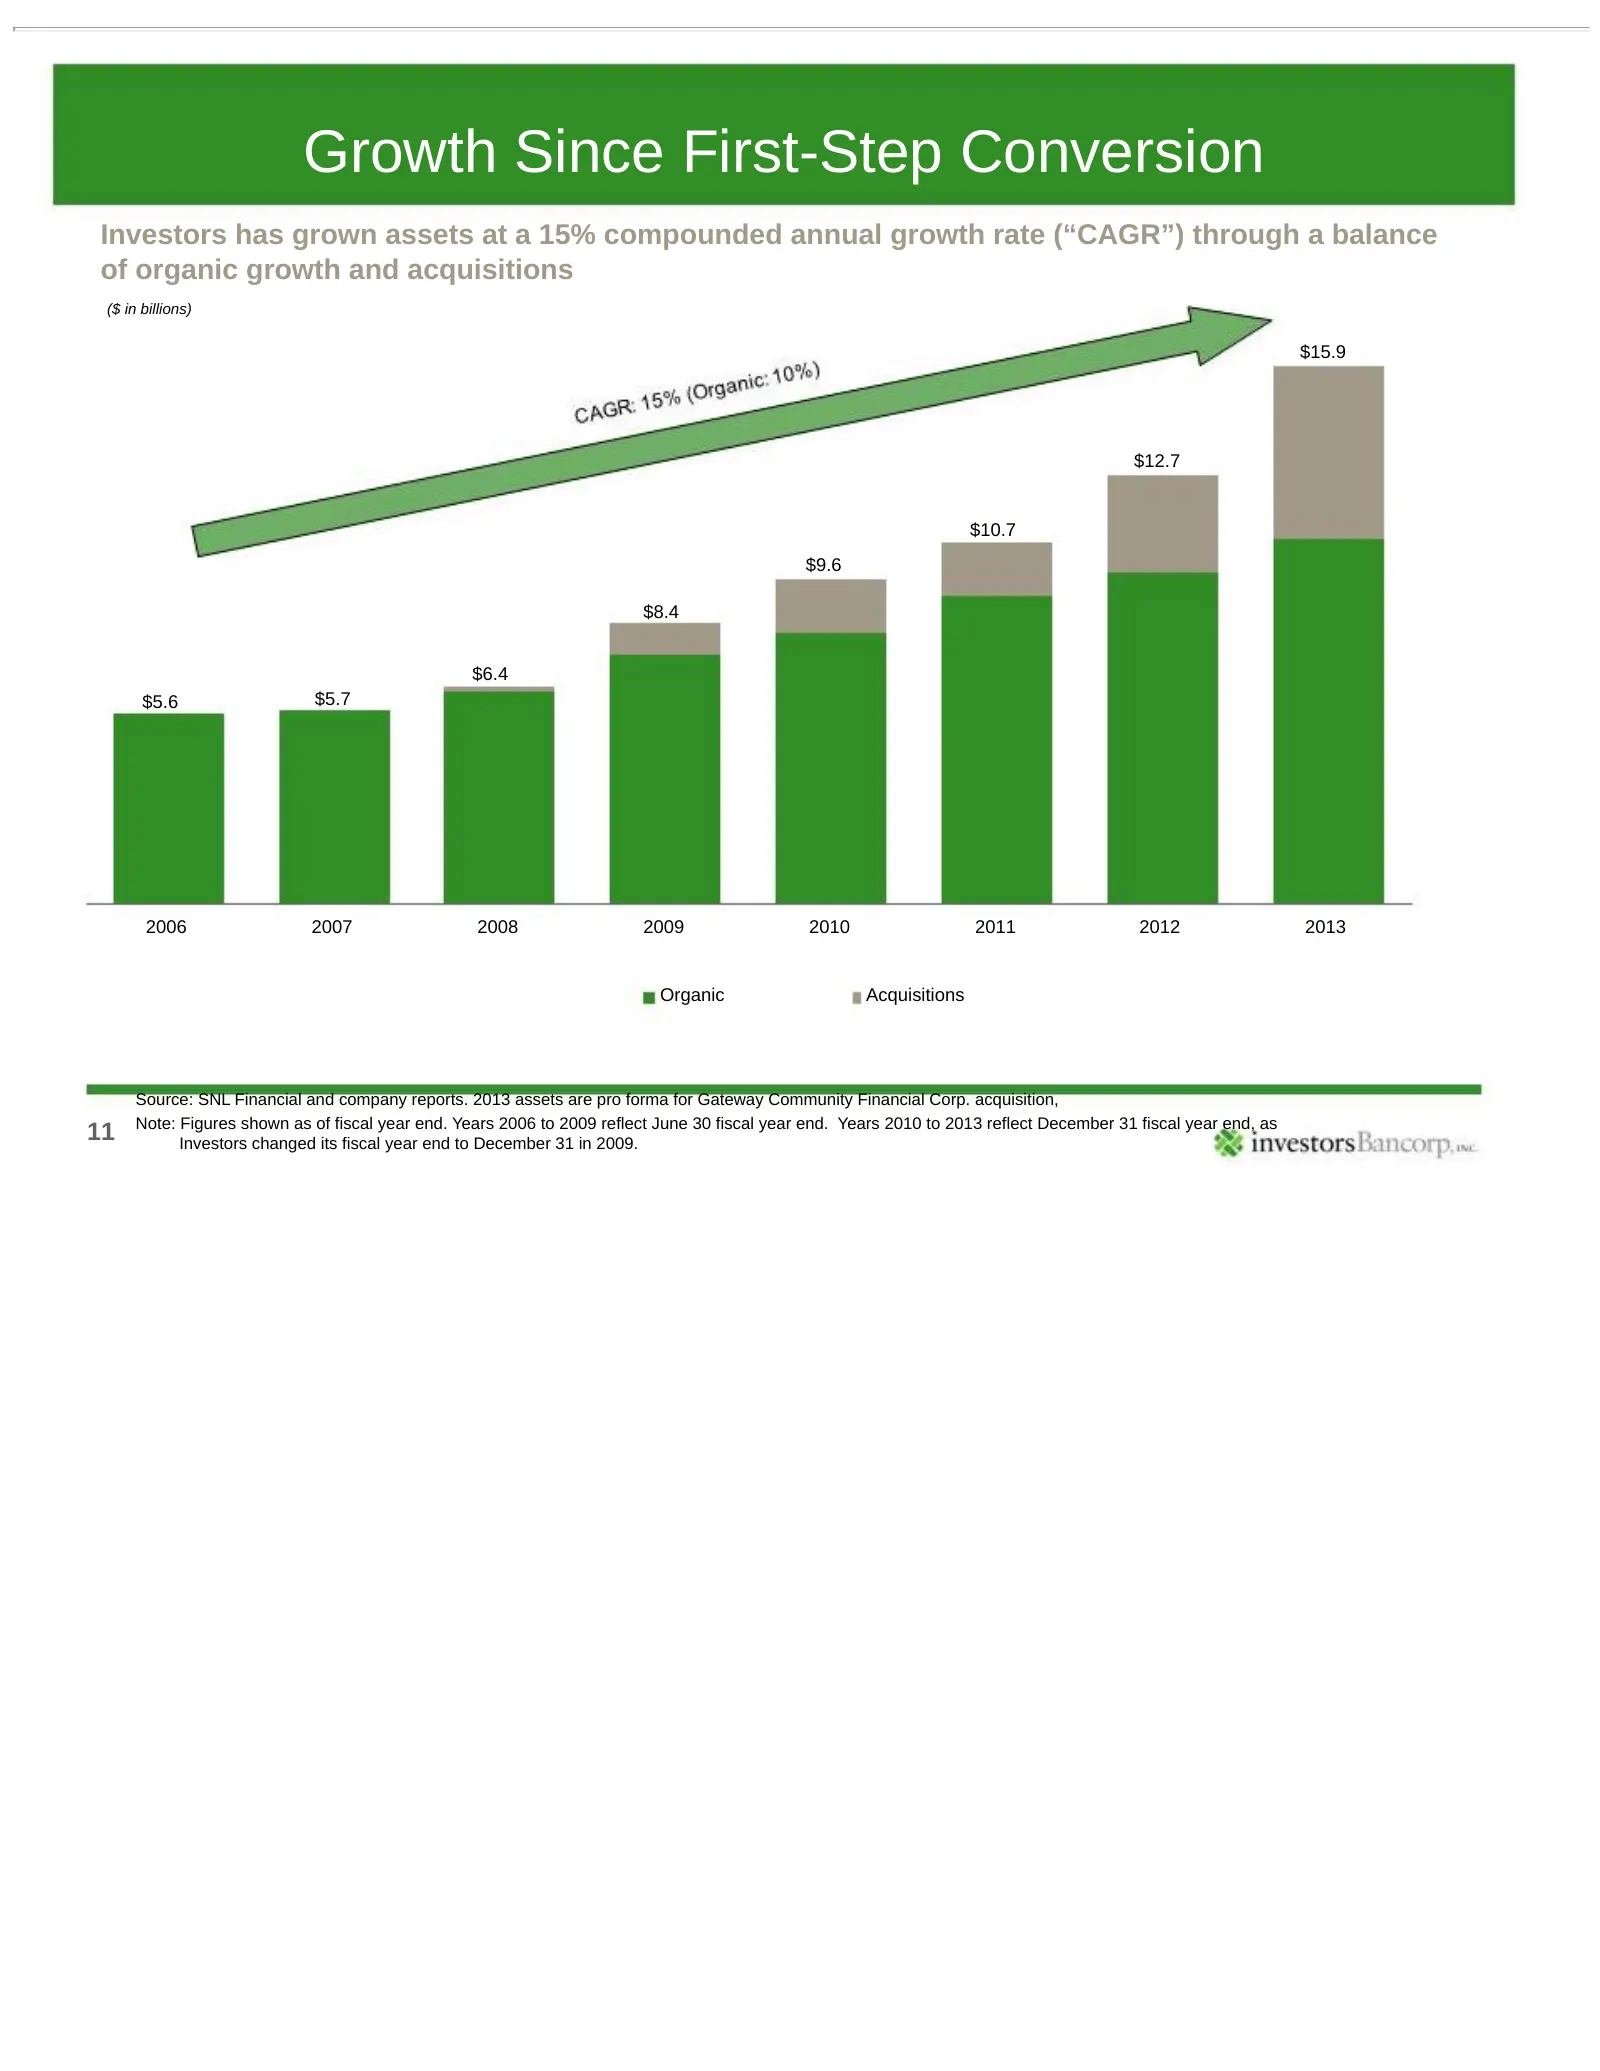
Growth Since First-Step Conversion Investors has grown assets at a 15% compounded annual growth rate (“CAGR”) through a balance of organic growth and acquisitions ($ in billions) $15.9 $12.7 $10.7 $9.6 $8.4 $6.4 $5.6 $5.7 2006 2007 2008 2009 2010 2011 2012 2013 Organic Acquisitions Source: SNL Finan
Slide 12: Franchise Transformation
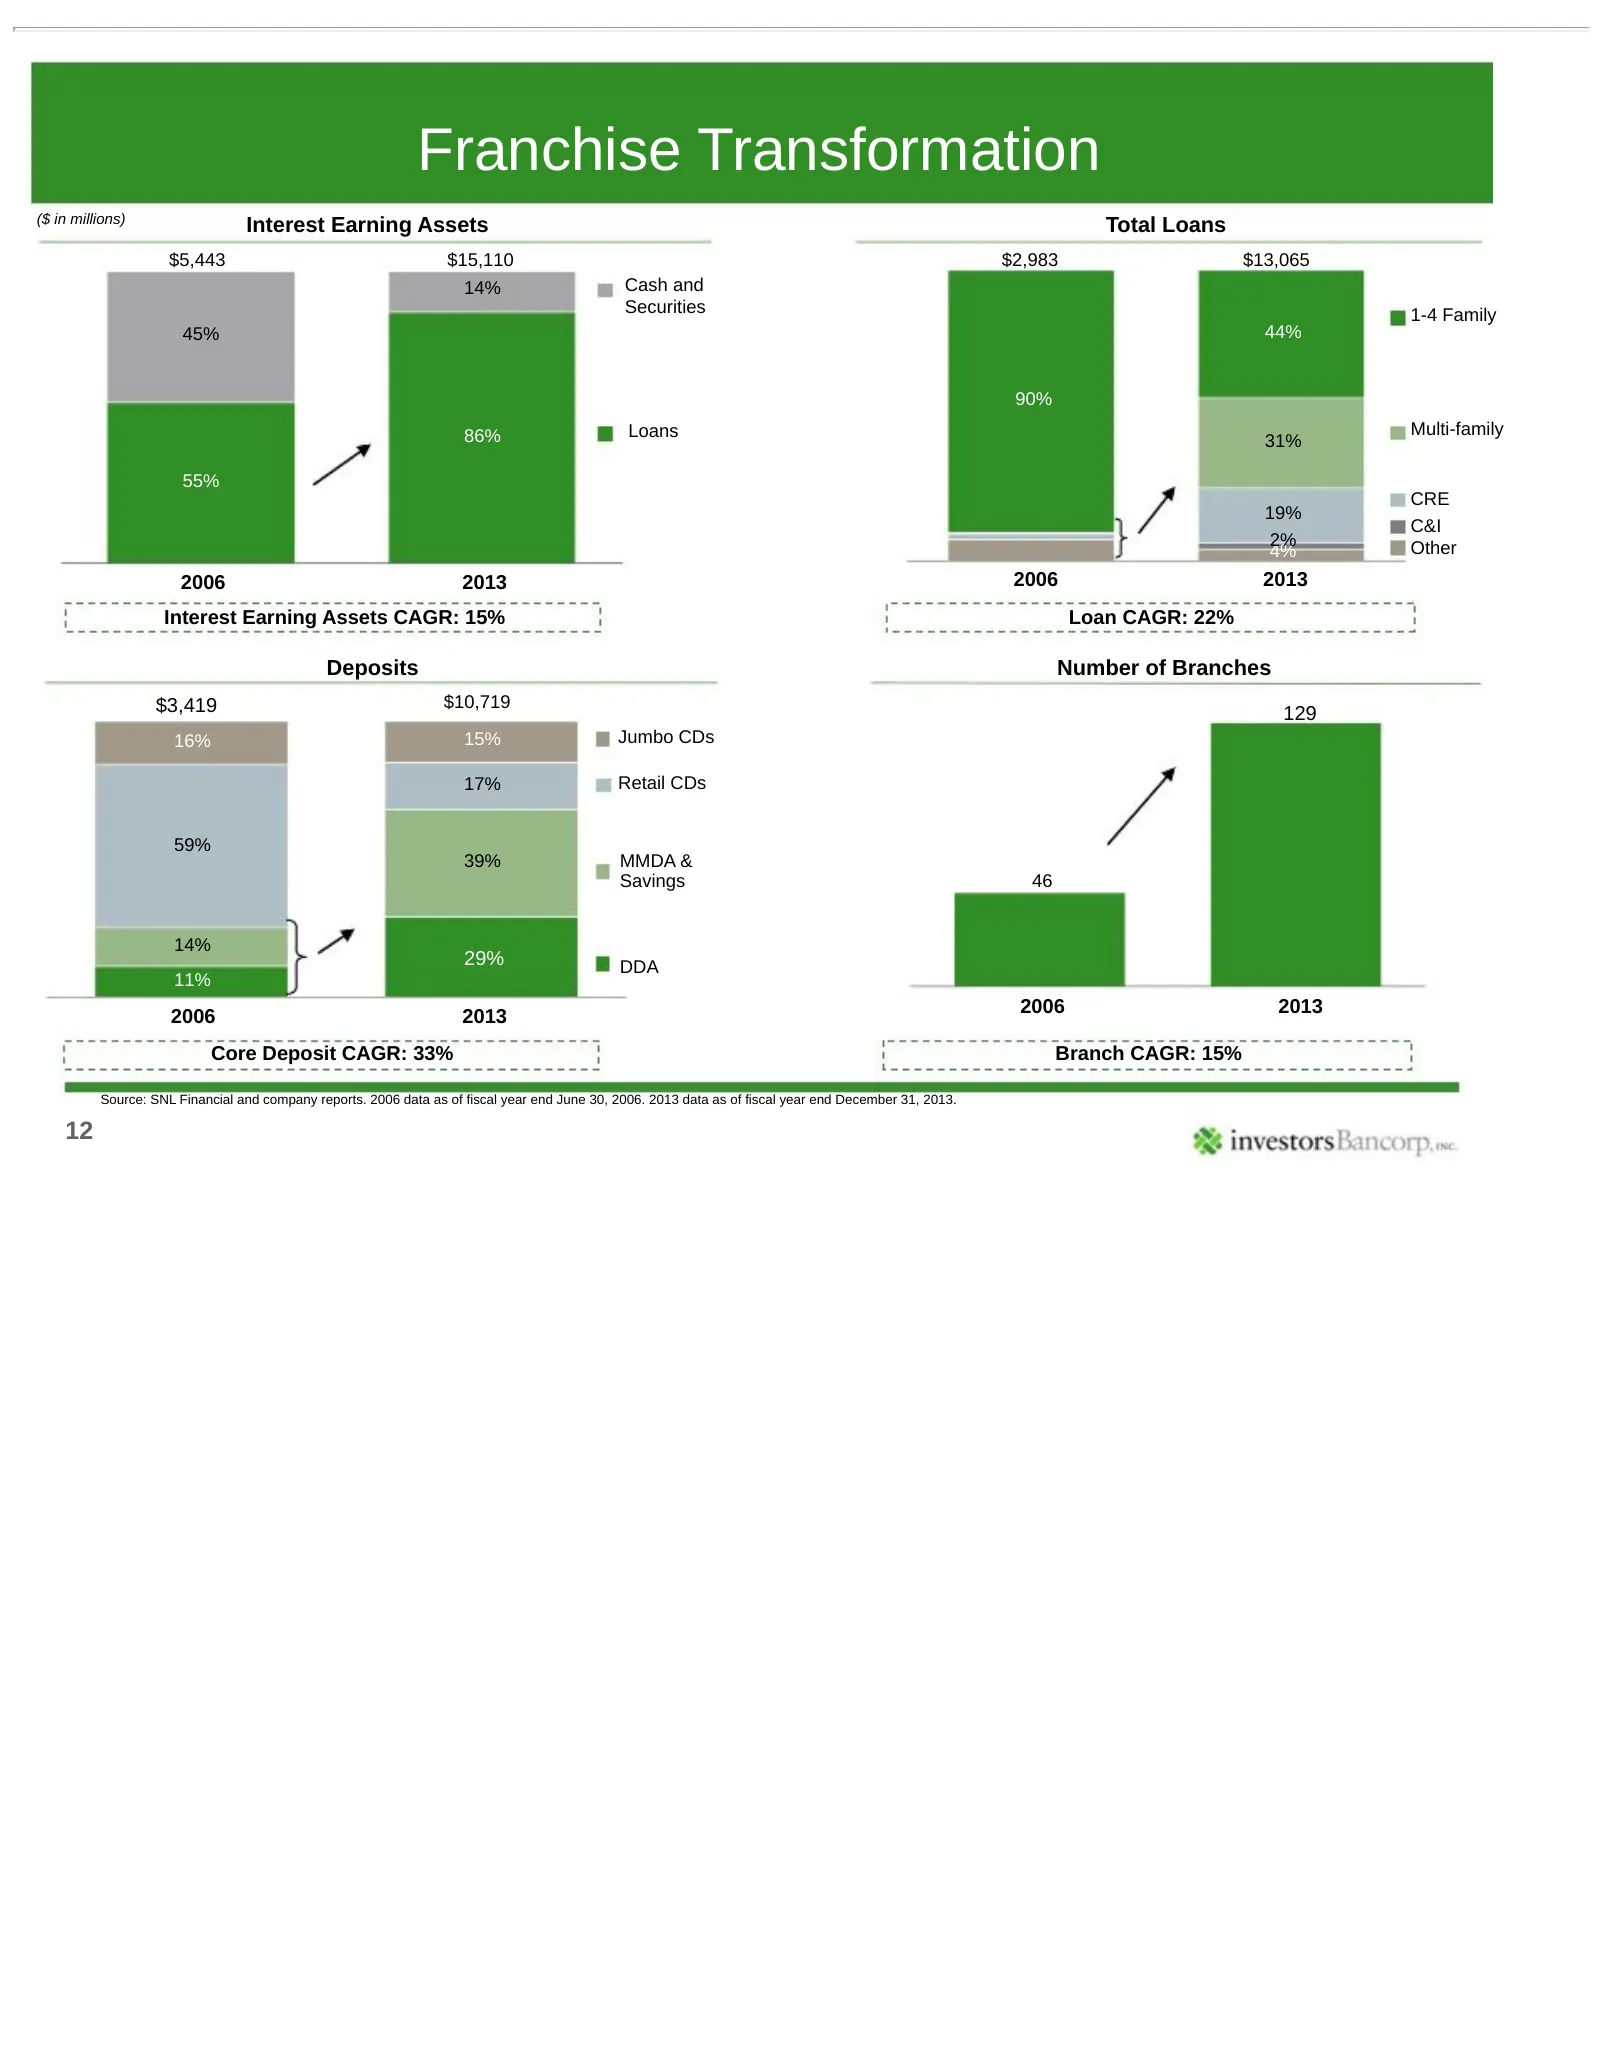
Franchise Transformation ($ in millions) Interest Earning Assets Total Loans $5,443 $15,110 $2,983 $13,065 14% Cash and Securities 1-4 Family 45% 44% 90% 86% Loans Multi-family 31% 55% CRE 19% C&I 2% Other 4% 2006 2013 2006 2013 Interest Earning Assets CAGR: 15% Loan CAGR: 22% Deposits Number of Bra
Slide 13: Opportunistic and Disciplined Acquiror
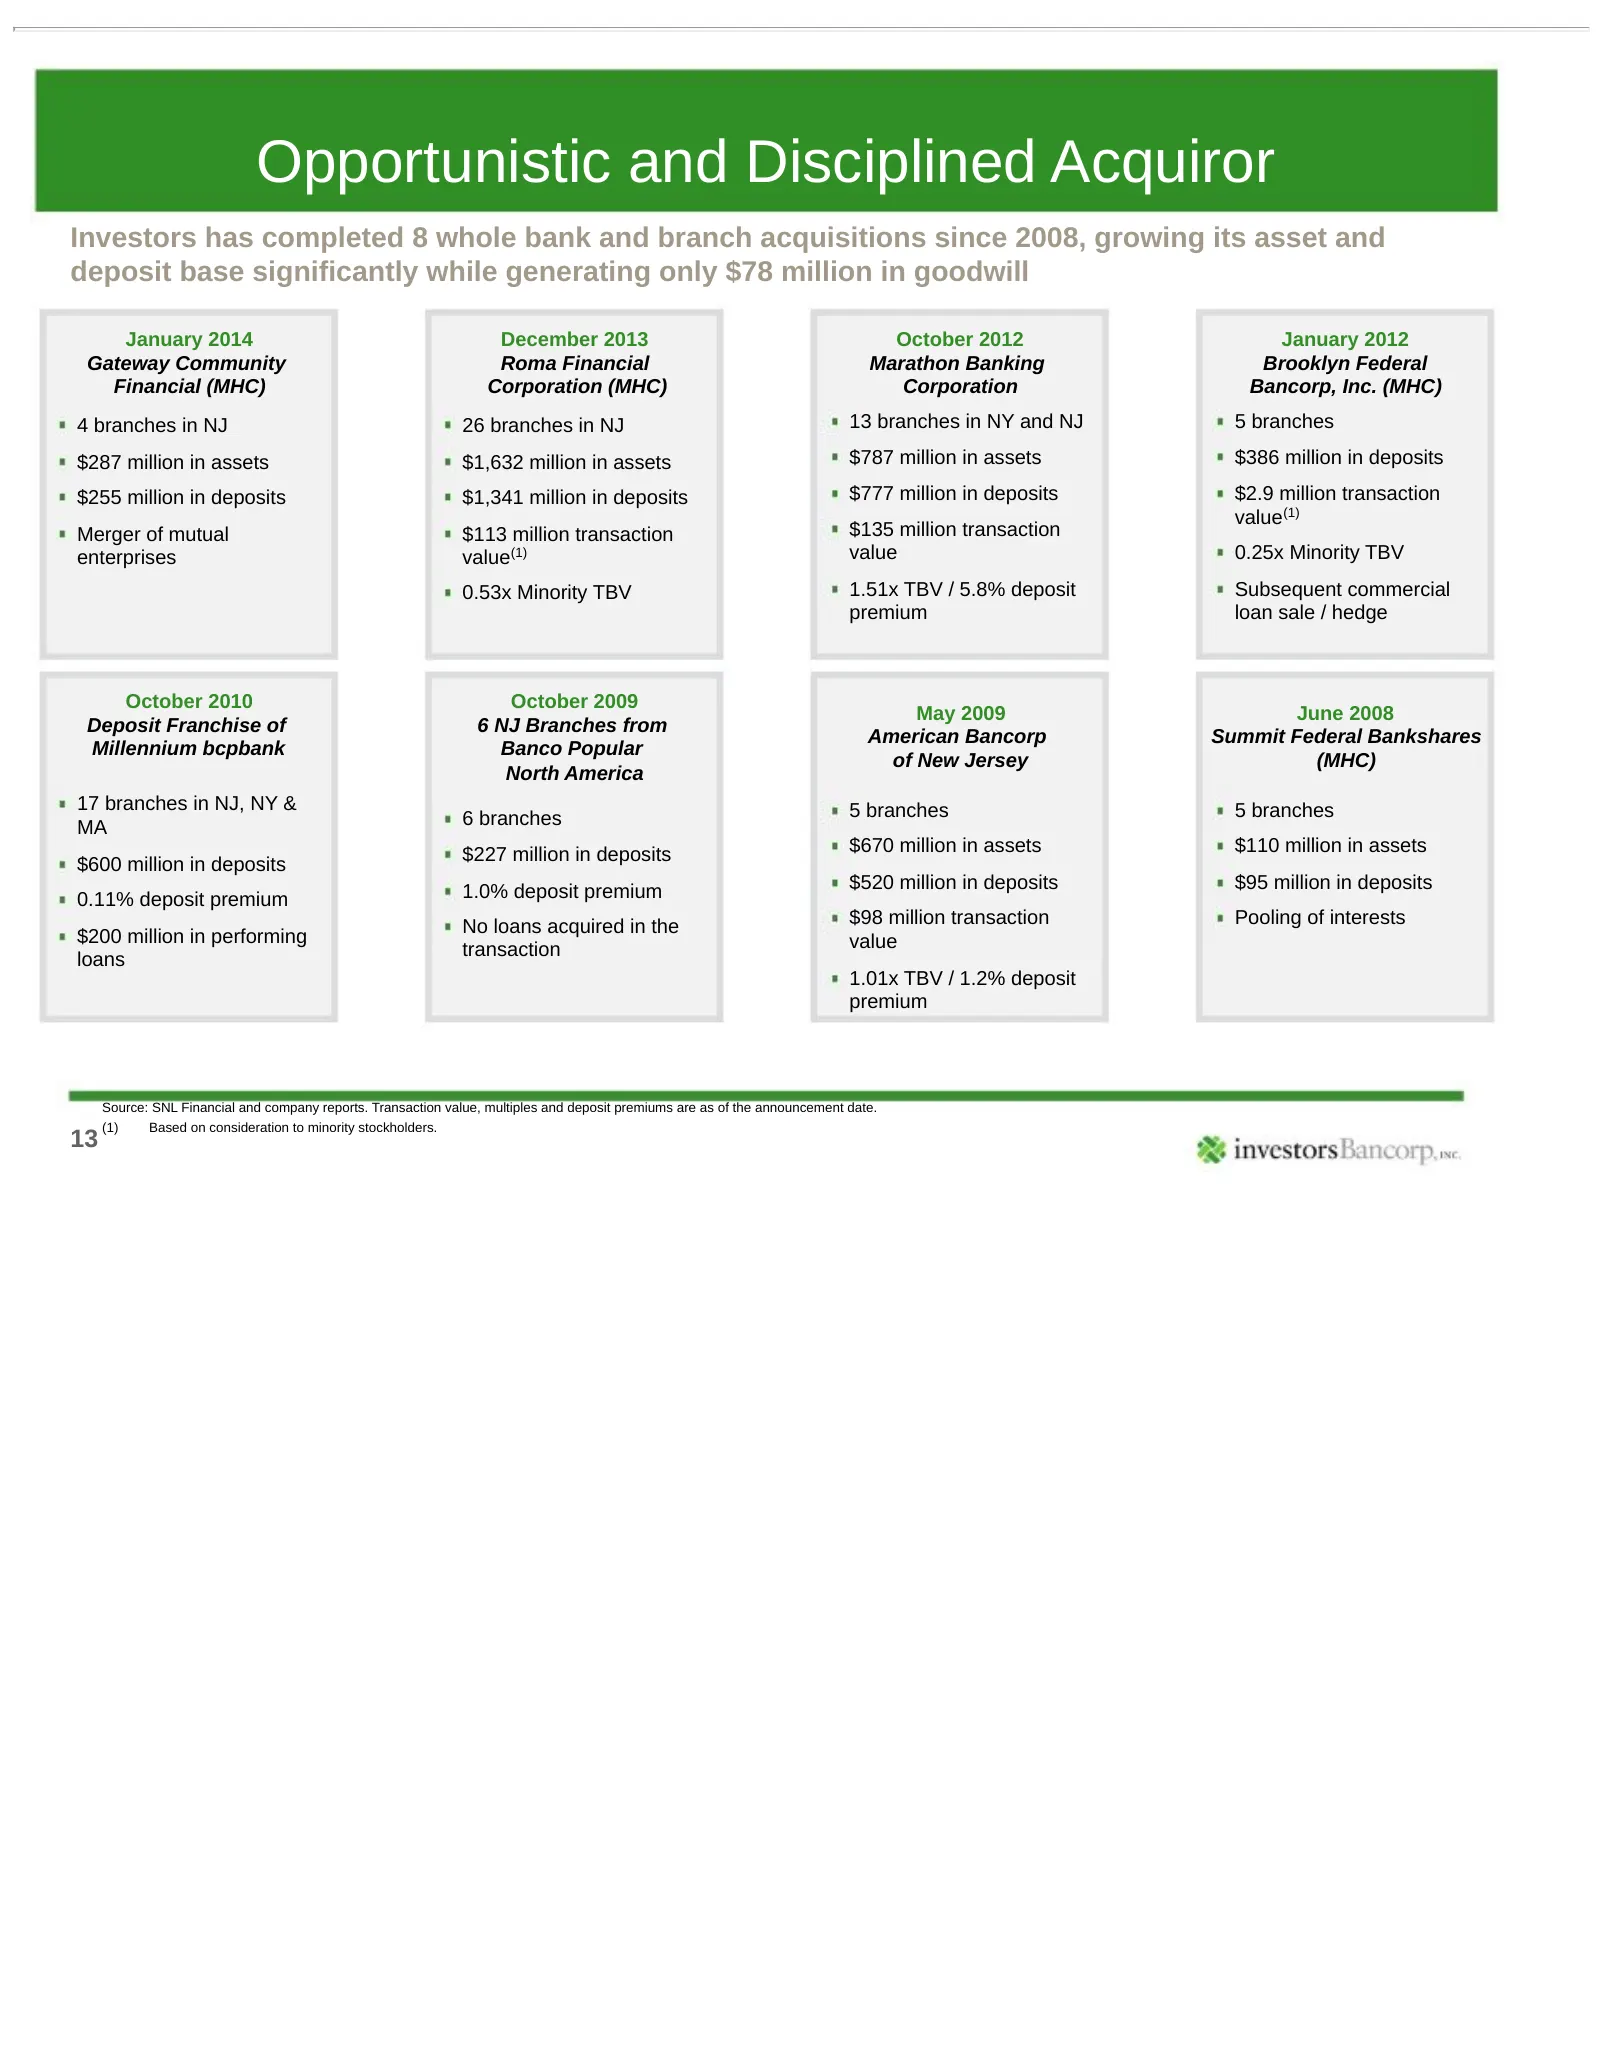
Opportunistic and Disciplined Acquiror Investors has completed 8 whole bank and branch acquisitions since 2008, growing its asset and deposit base significantly while generating only $78 million in goodwill January 2014 December 2013 October 2012 January 2012 Gateway Community Roma Financial Maratho
Slide 14: Strong and Improving Profitability
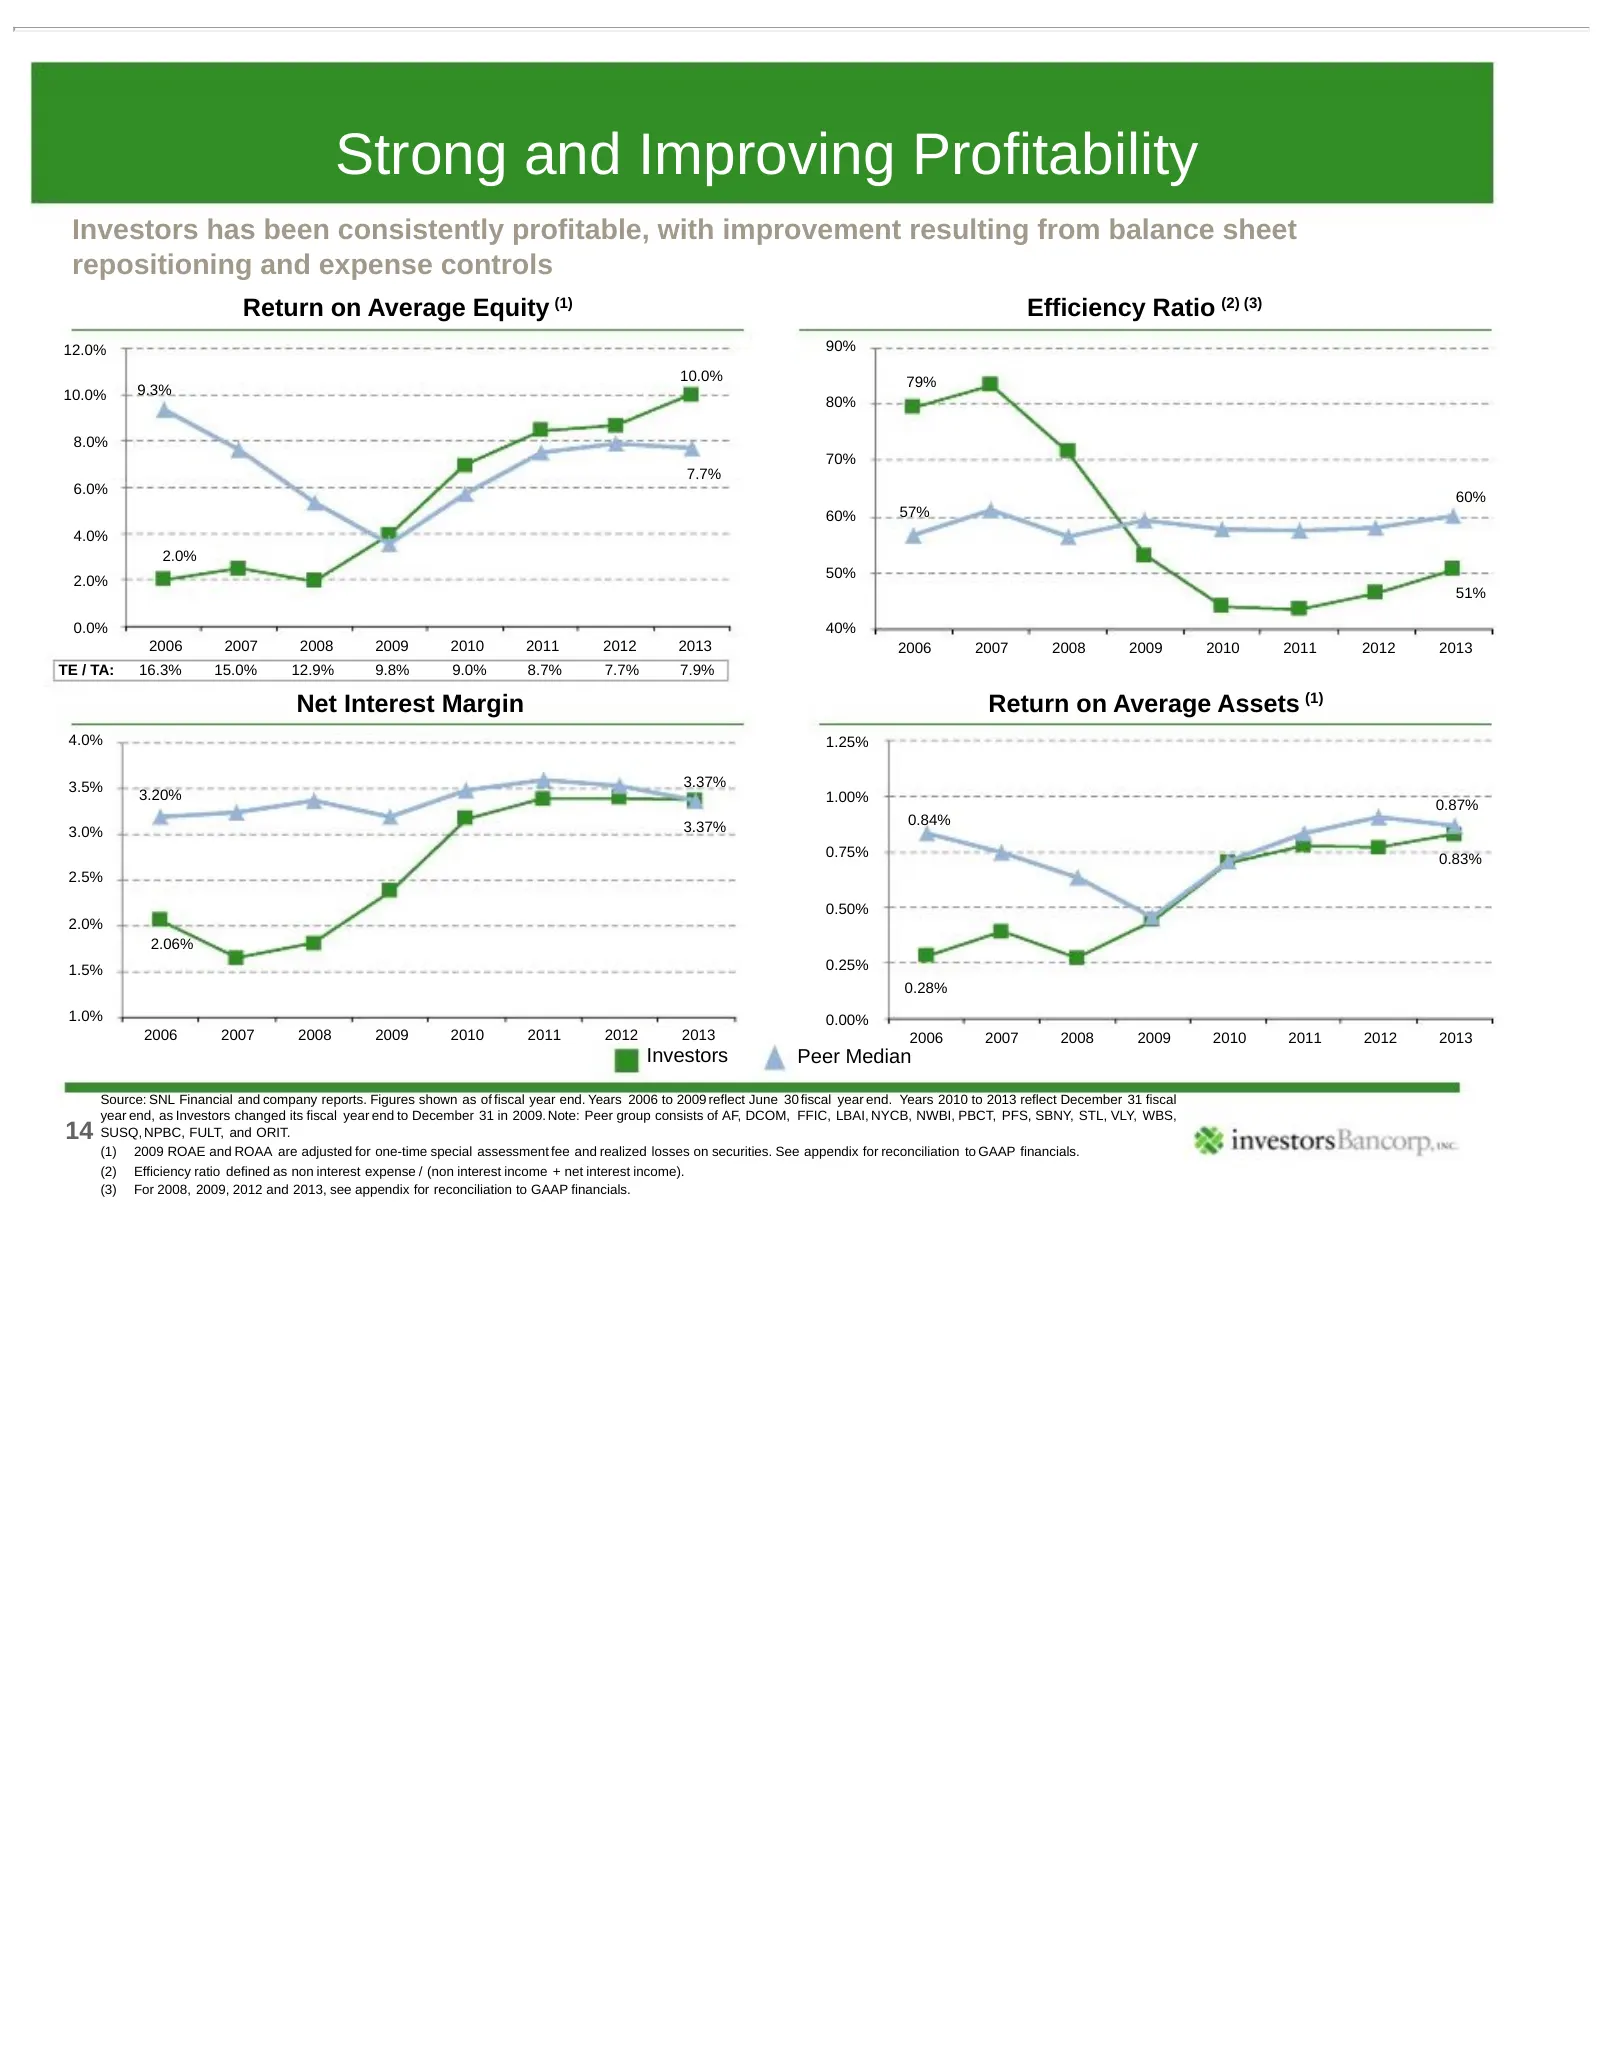
Strong and Improving Profitability Investors has been consistently profitable, with improvement resulting from balance sheet repositioning and expense controls Return on Average Equity (1) Efficiency Ratio (2) (3) 12.0% 90% 10.0% 79% 10.0% 9.3% 80% 8.0% 70% 7.7% 6.0% 60% 60% 57% 4.0% 2.0% 50% 2.0% 5
Slide 15: Excellent Credit Quality
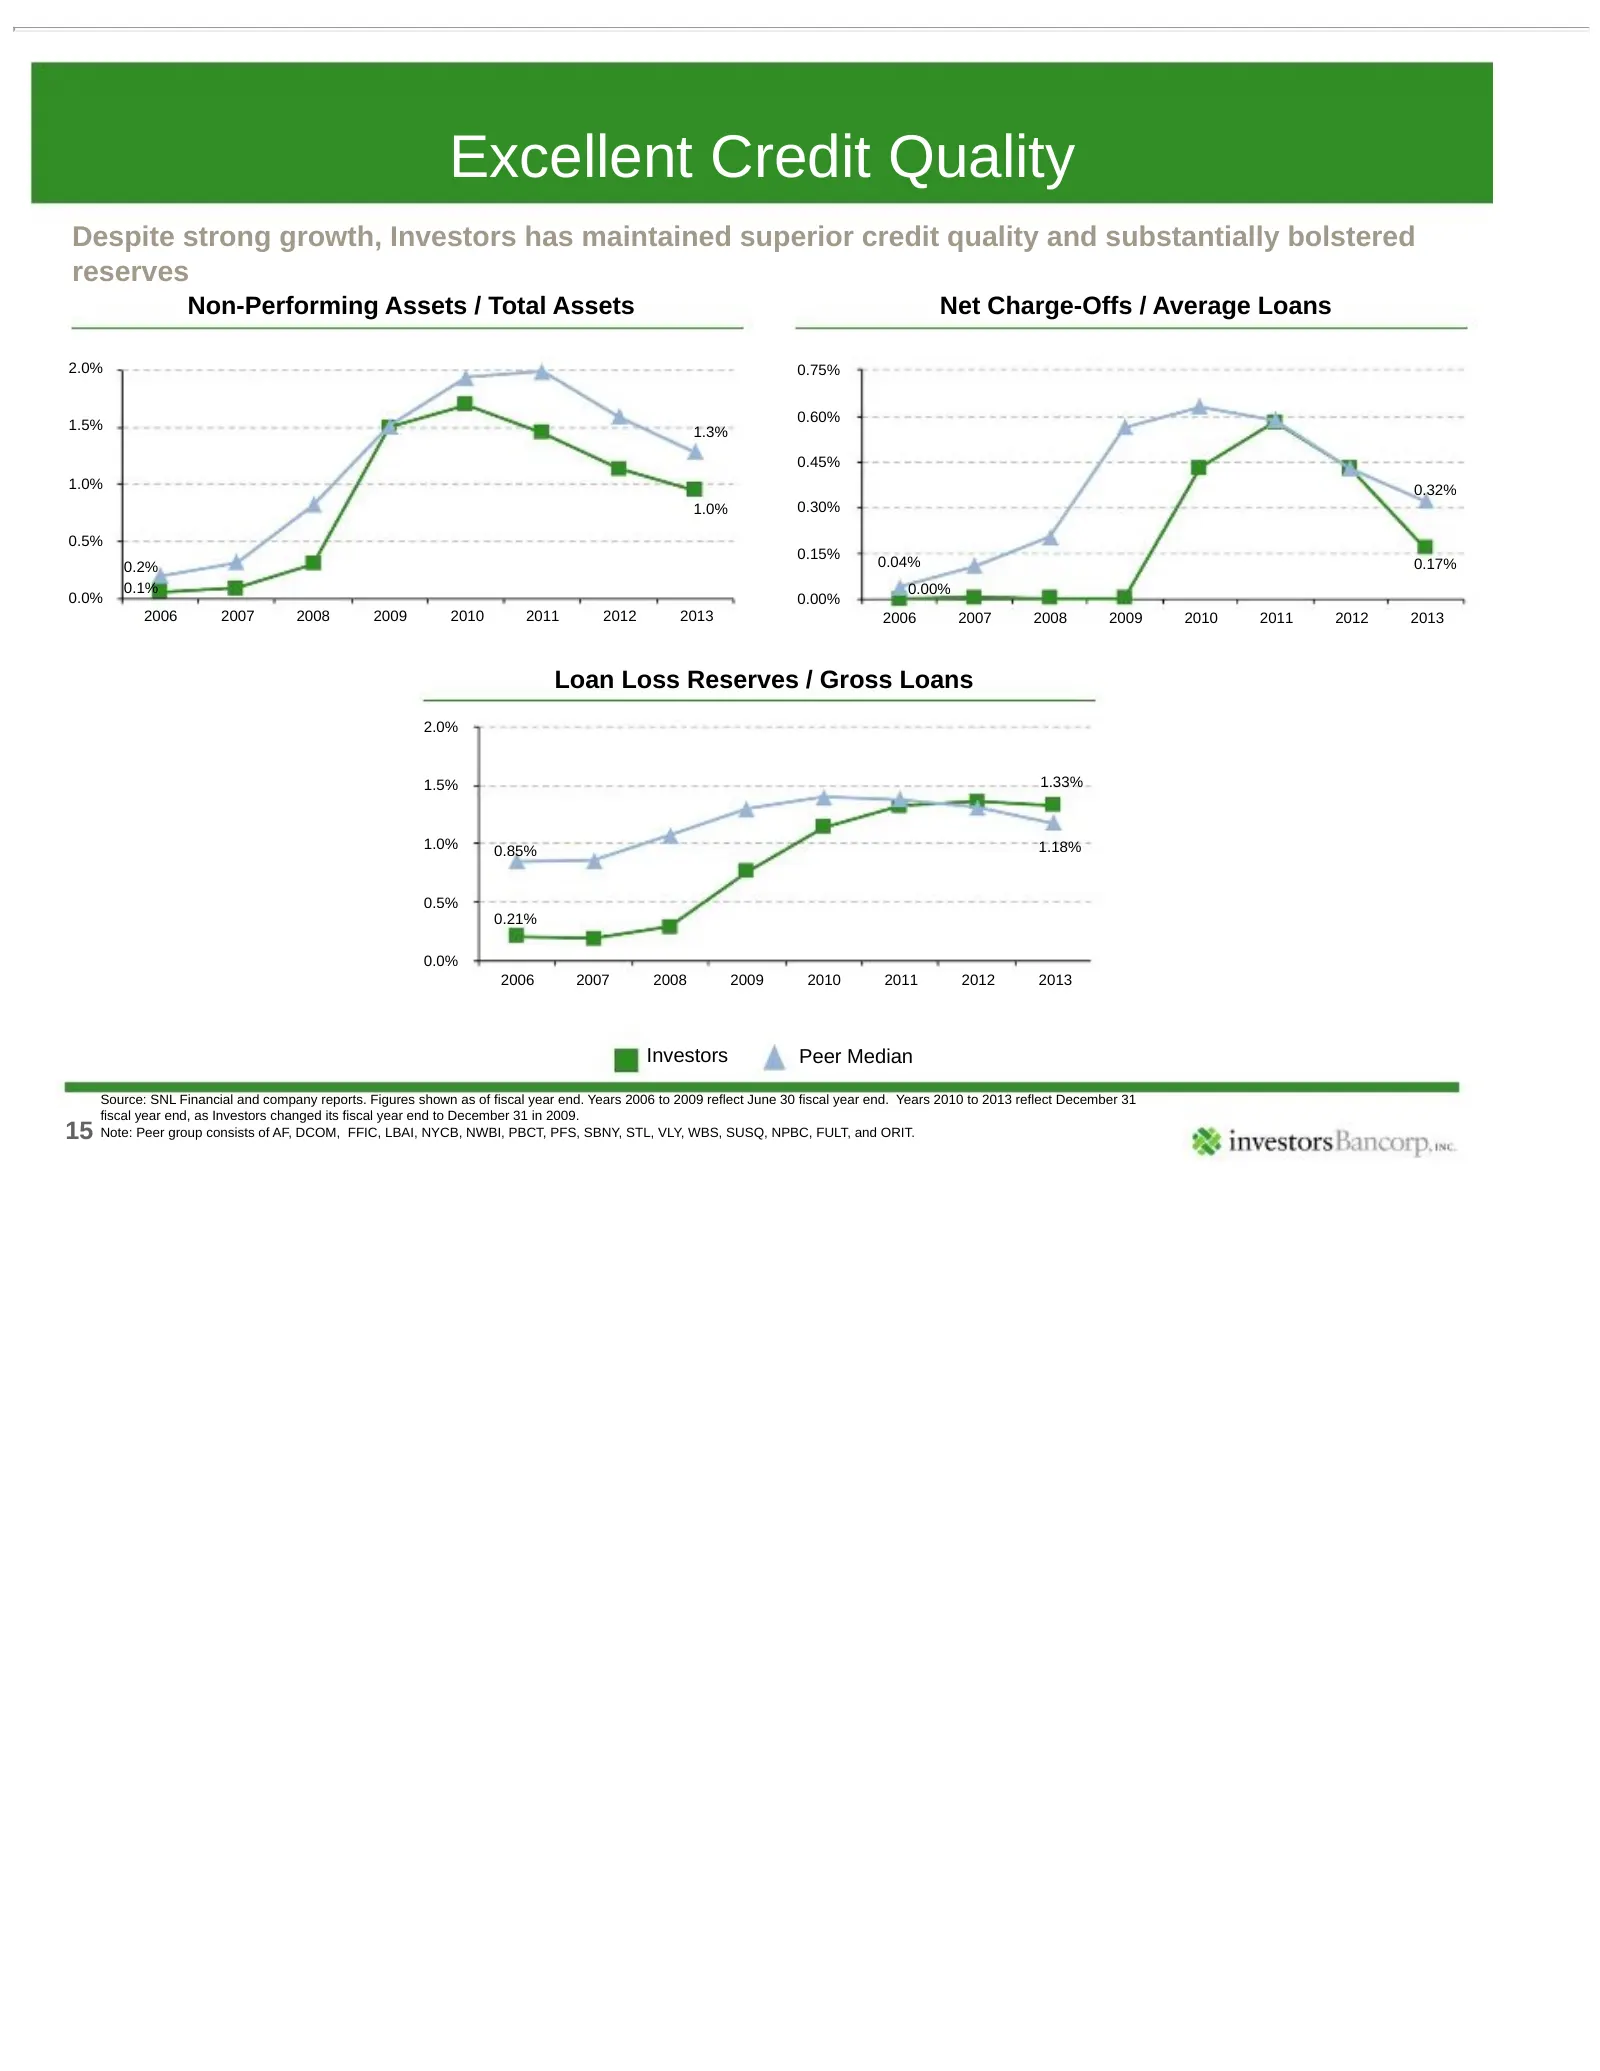
Excellent Credit Quality Despite strong growth, Investors has maintained superior credit quality and substantially bolstered reserves Non-Performing Assets / Total Assets Net Charge-Offs / Average Loans 2.0% 0.75% 0.60% 1.5% 1.3% 0.45% 1.0% 0.32% 1.0% 0.30% 0.5% 0.15% 0.2% 0.04% 0.17% 0.1% 0.00% 0.0
Slide 16: Total Return Since First-Step Conversion
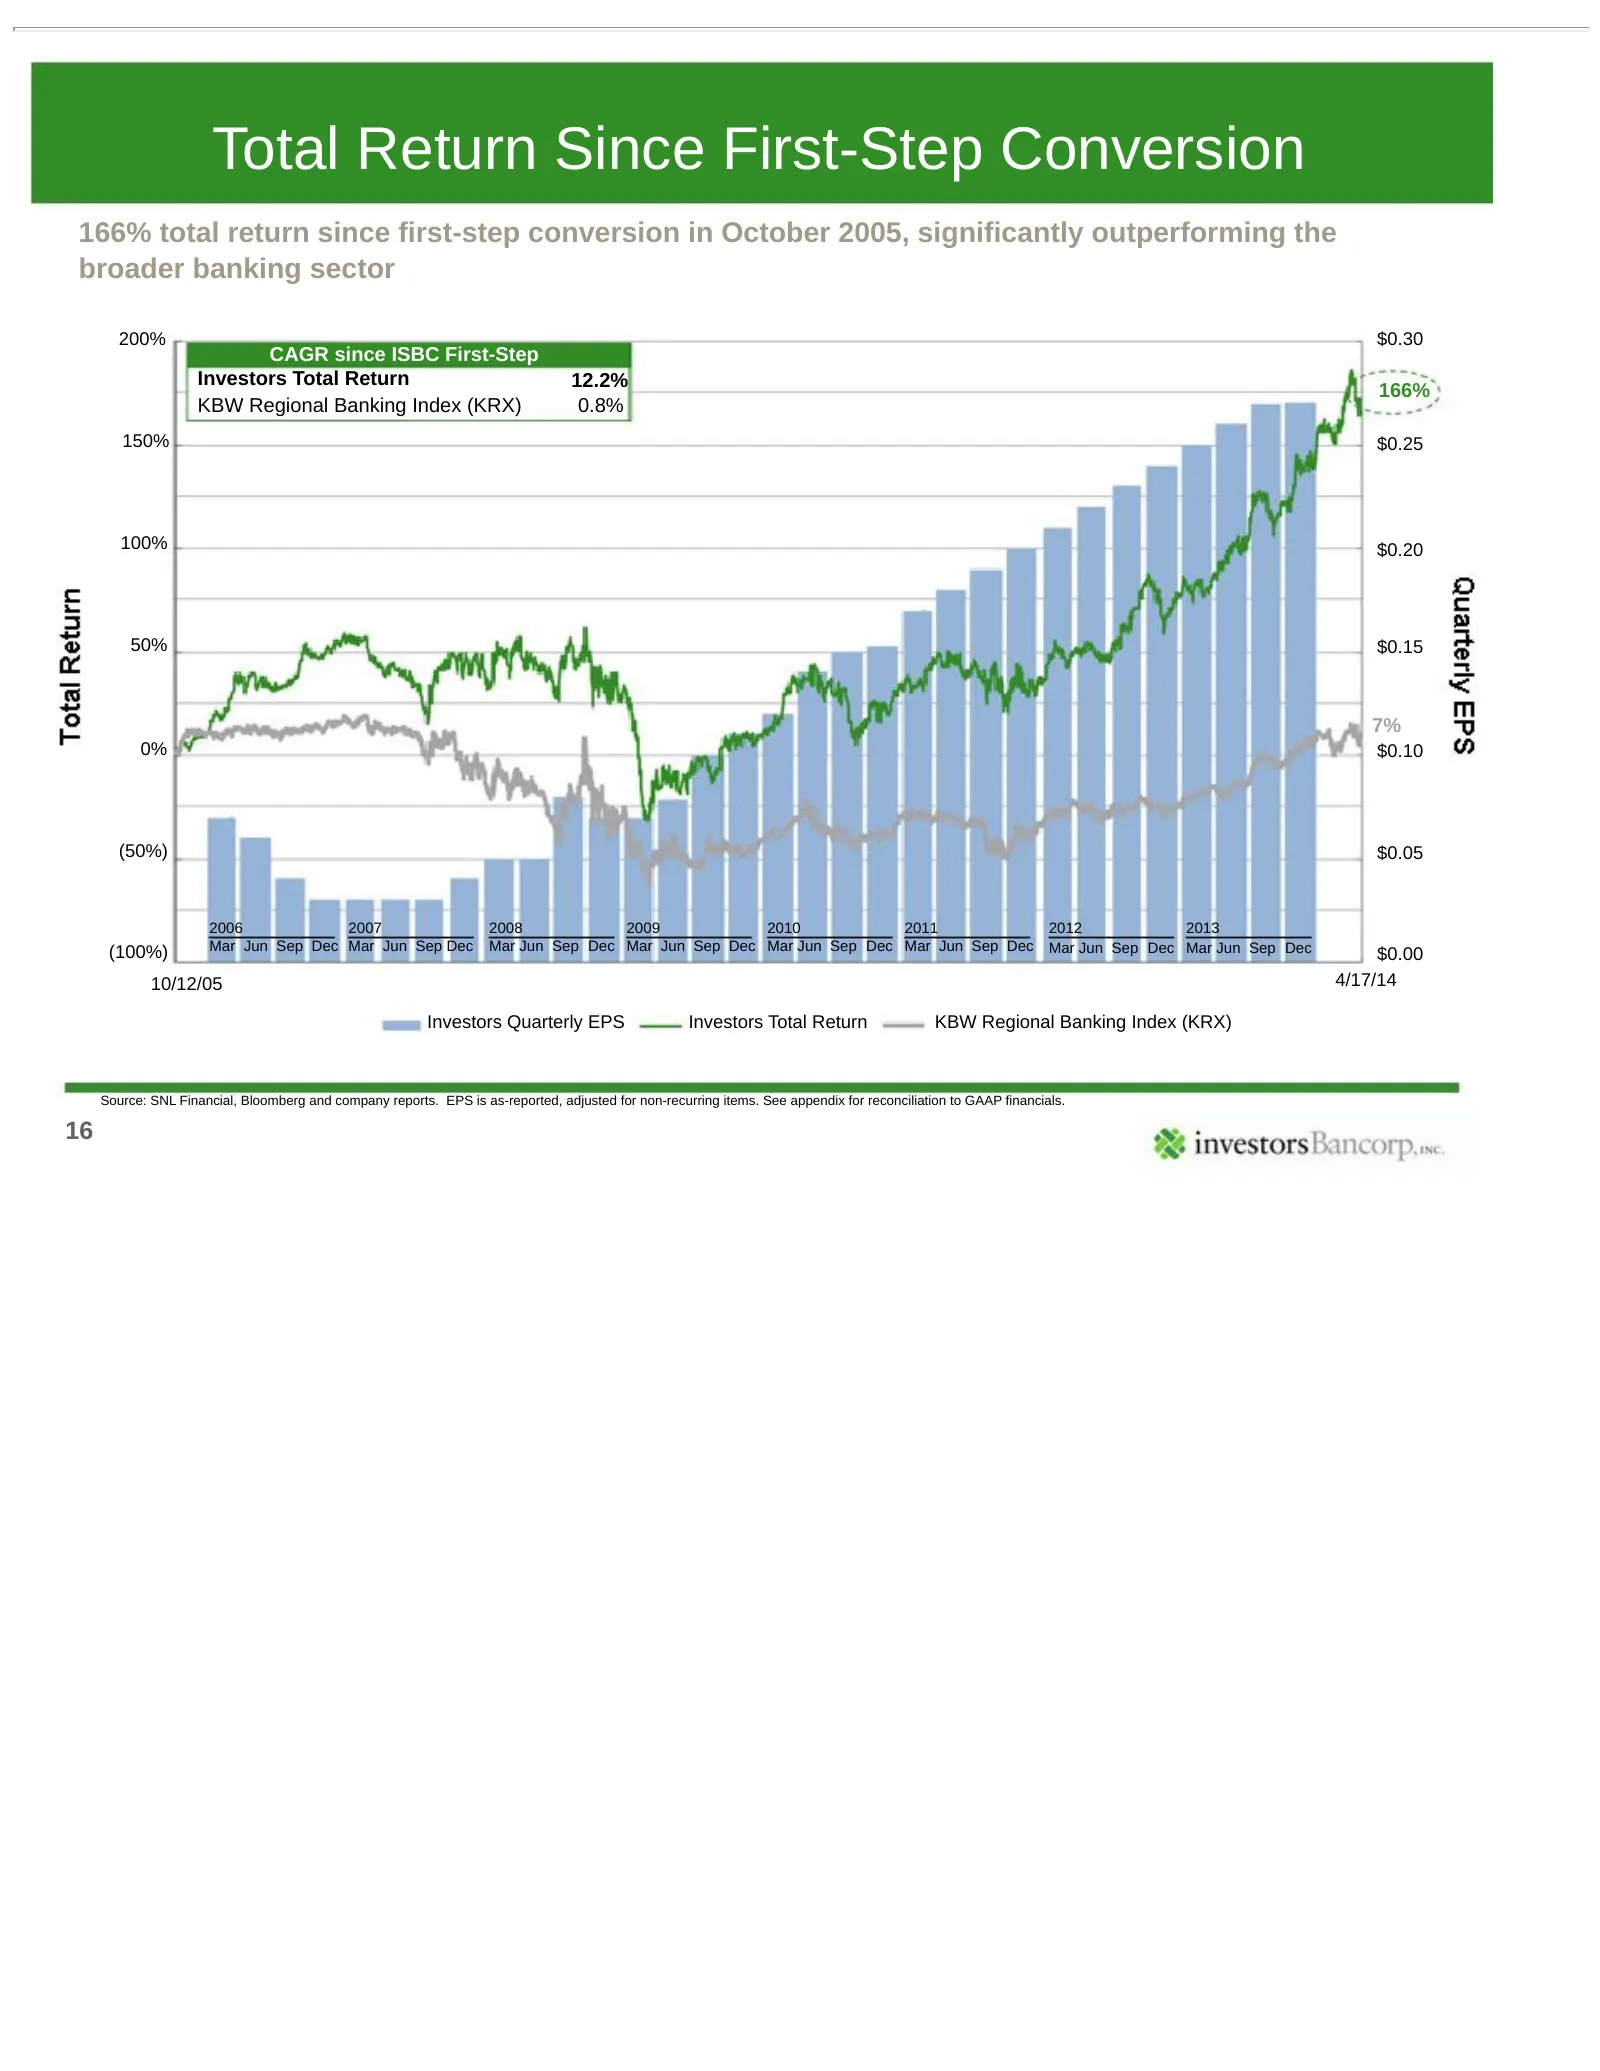
Total Return Since First-Step Conversion 166% total return since first-step conversion in October 2005, significantly outperforming the broader banking sector 200% $0.30 CAGR since ISBC First-Step Investors Total Return 12.2% 166% KBW Regional Banking Index (KRX) 0.8% 150% $0.25 100% $0.20 50% $0.15
Slide 17: Business Priorities
Business Priorities Continue transition into a commercial bank - Increase commercial loans and core deposits - Build credit and risk management infrastructure - Convert core processing system Grow organically and through acquisitions in existing markets Focus on core competencies - Safety and soundn
Slide 18: Market Share Opportunities
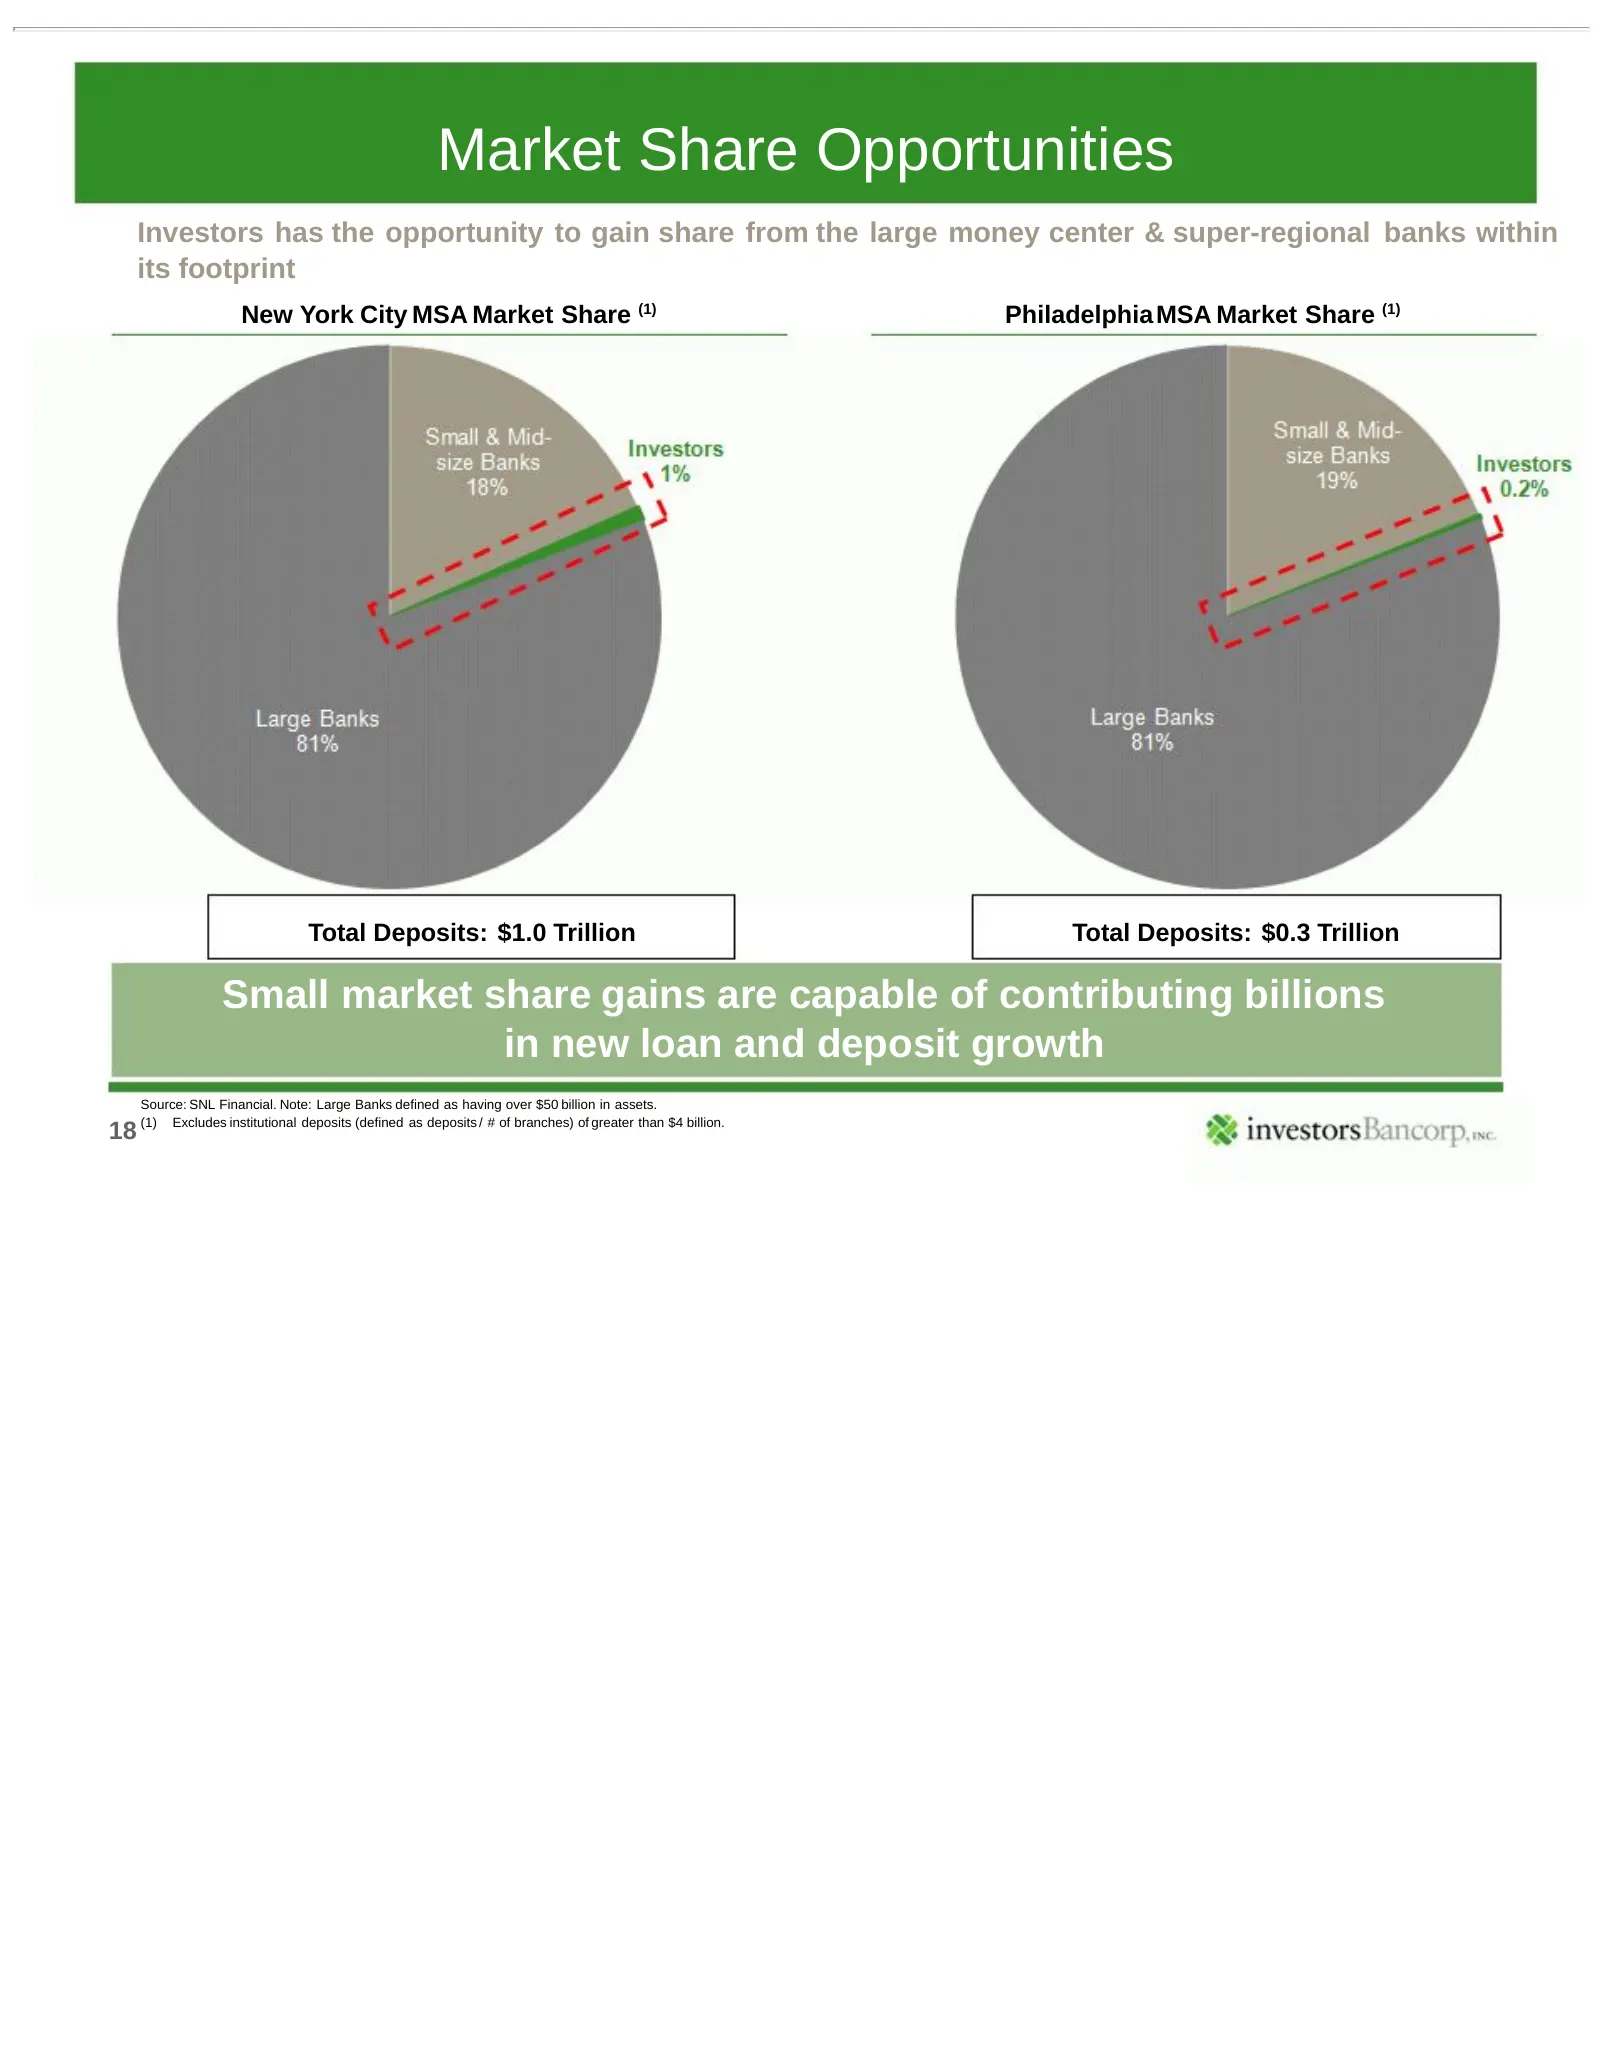
Market Share Opportunities Investors has the opportunity to gain share from the large money center & super-regional banks within its footprint New York City MSA Market Share (1) Philadelphia MSA Market Share (1) Total Deposits: $1.0 Trillion Total Deposits: $0.3 Trillion Small market share gains are
Slide 19: Numerous Acquisition Opportunities
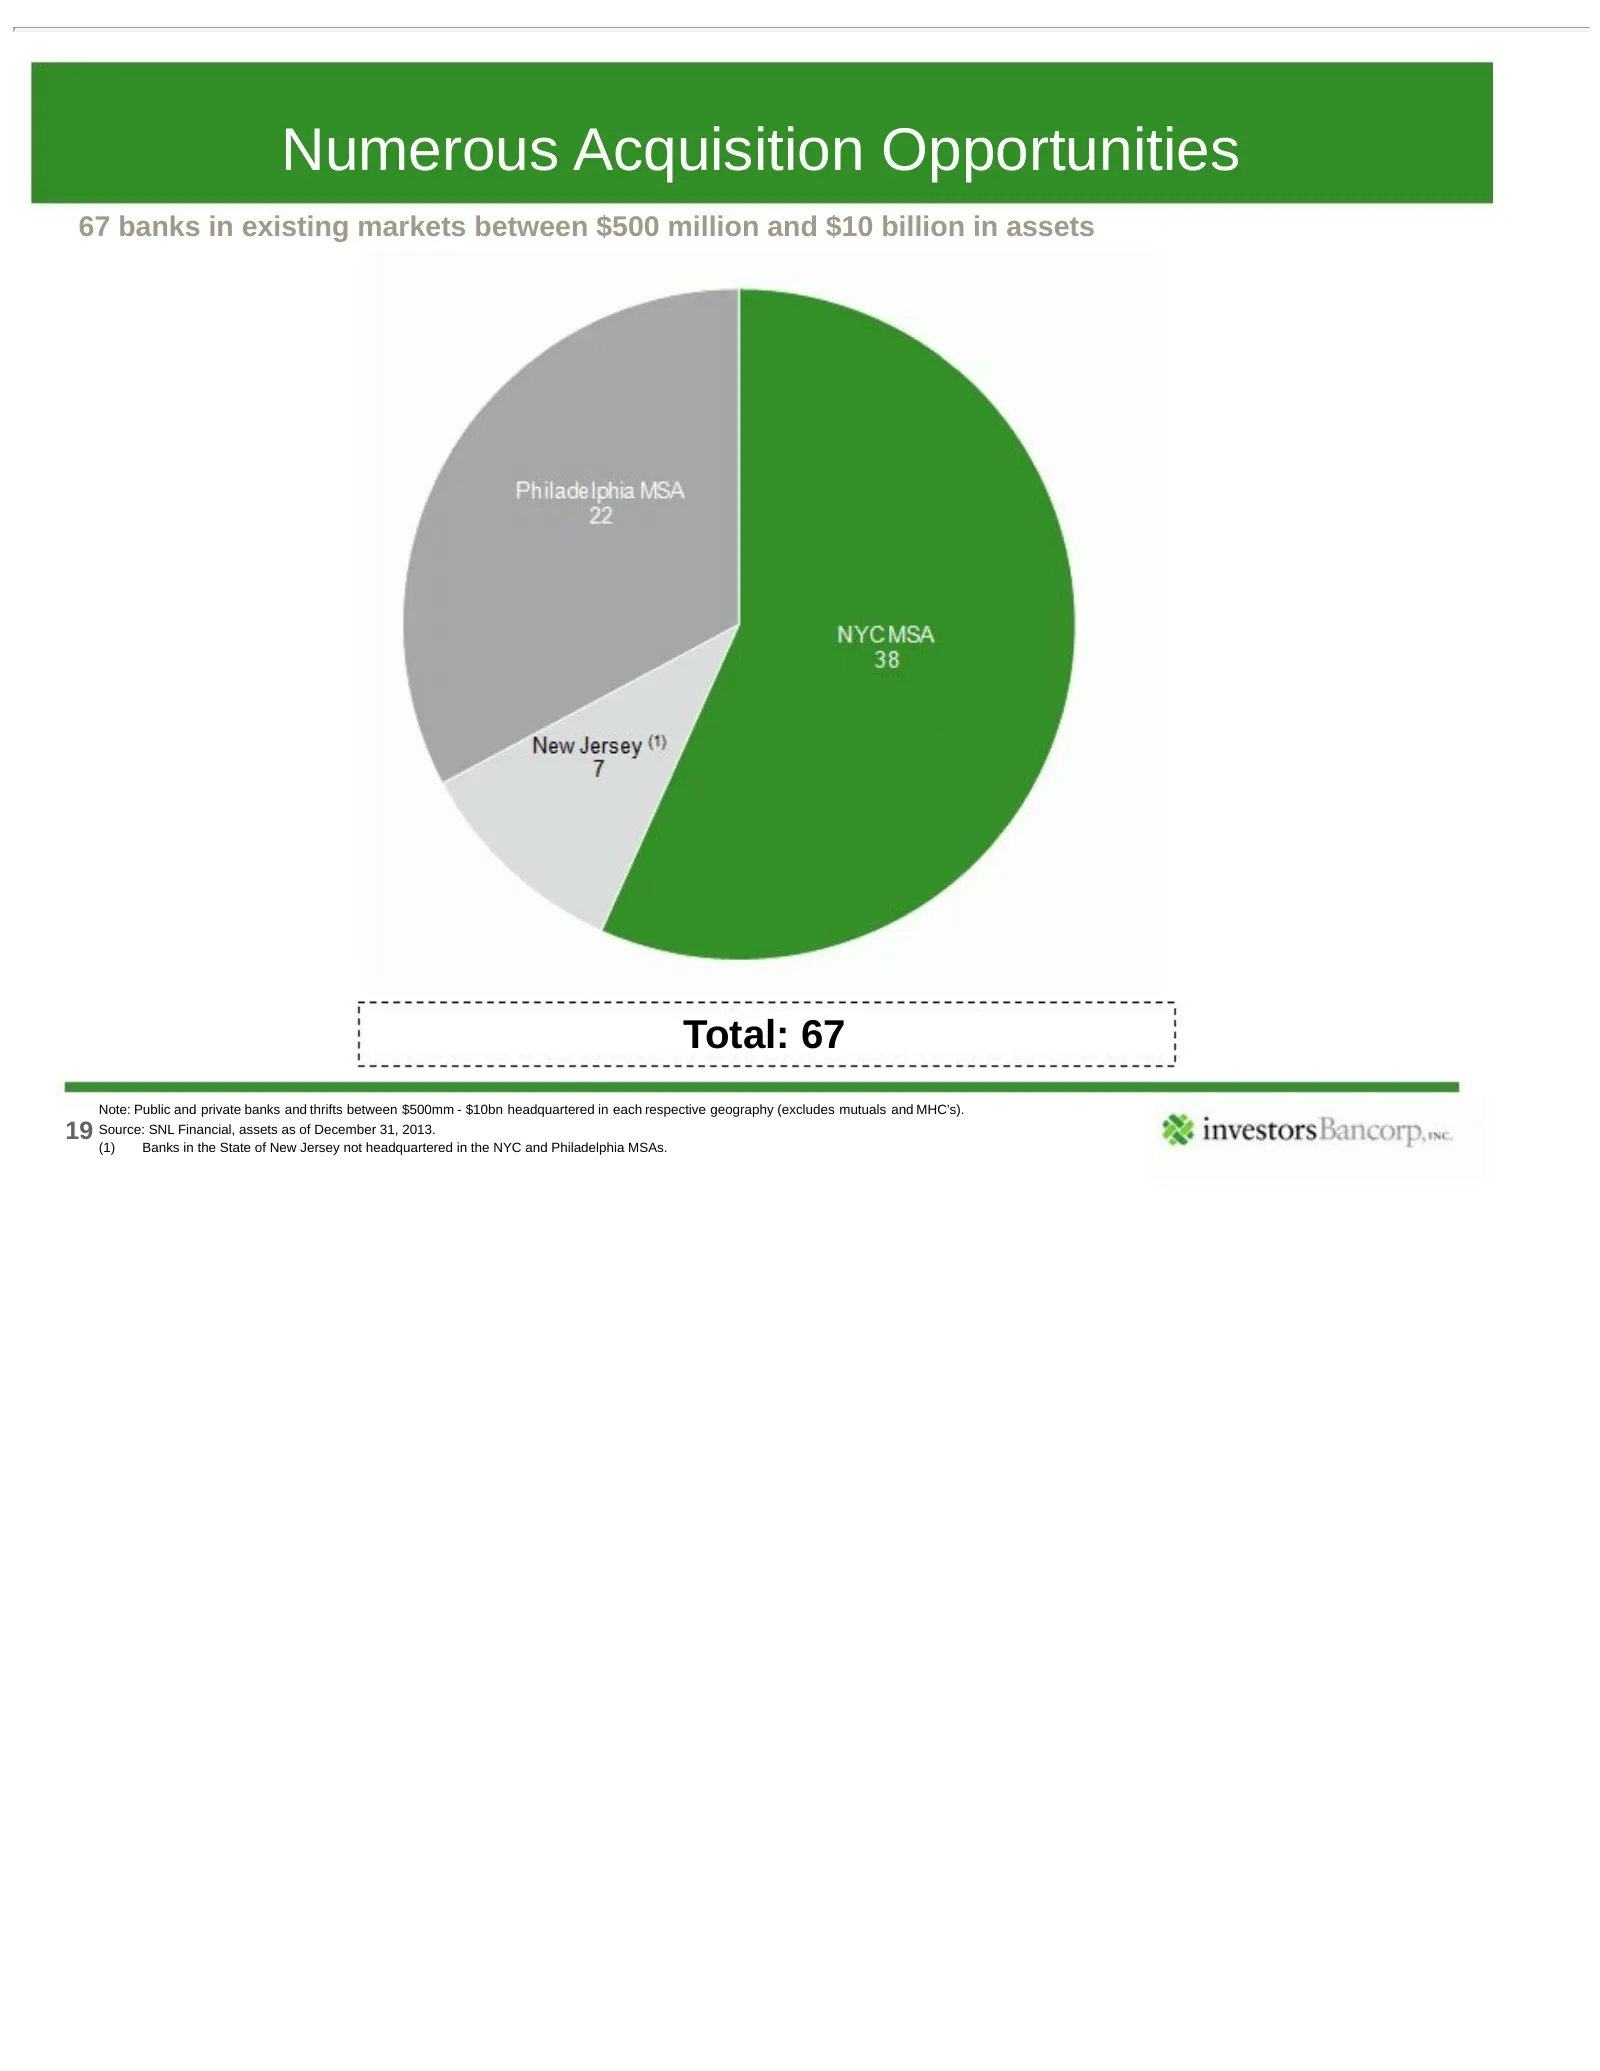
Numerous Acquisition Opportunities 67 banks in existing markets between $500 million and $10 billion in assets Total: 67 Note: Public and private banks and thrifts between $500mm - $10bn headquartered in each respective geography (excludes mutuals and MHC’s). 19 Source: SNL Financial, assets as of D
Slide 20: Use of Proceeds & Capital Management
Use of Proceeds & Capital Management Use of proceeds and capital management priorities: - Repayment of maturing short-term borrowings and investment in short-dated securities - Organic growth - Cash dividends - Share repurchases - Acquisitions Repurchased 30% of shares issued in first-step conversio
Slide 21: Positioning for Rising Rates
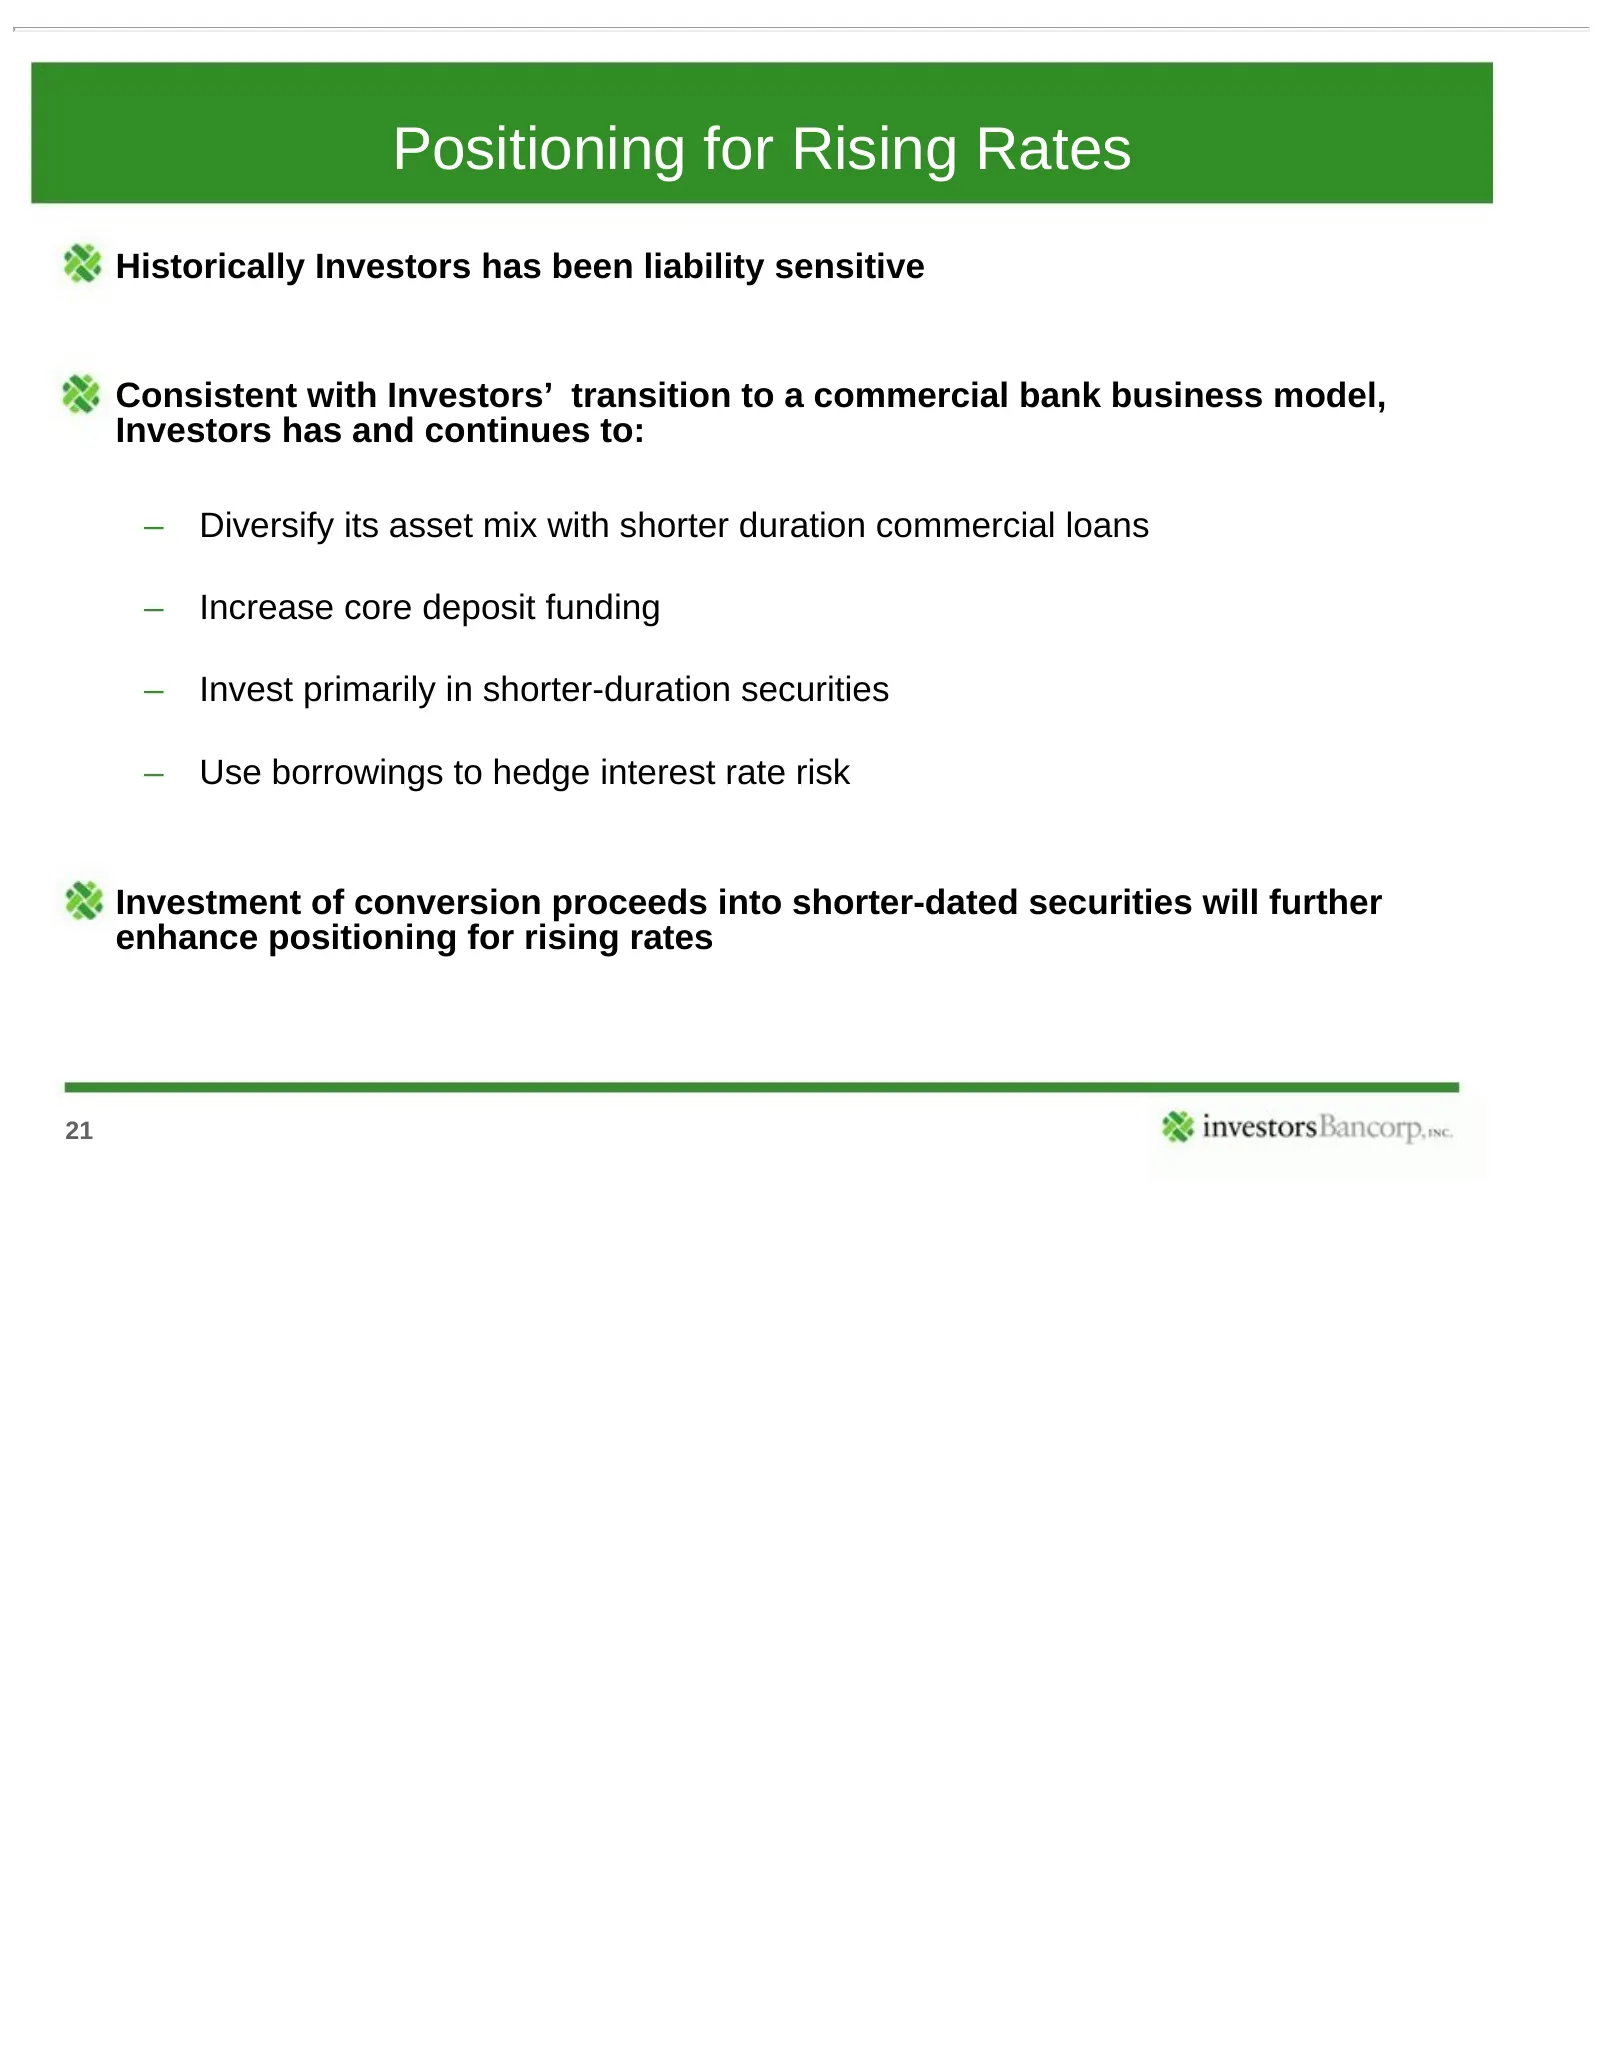
Positioning for Rising Rates Historically Investors has been liability sensitive Consistent with Investors’ transition to a commercial bank business model, Investors has and continues to: – Diversify its asset mix with shorter duration commercial loans – Increase core deposit funding – Invest primar
Slide 22: Summary of First Quarter Results
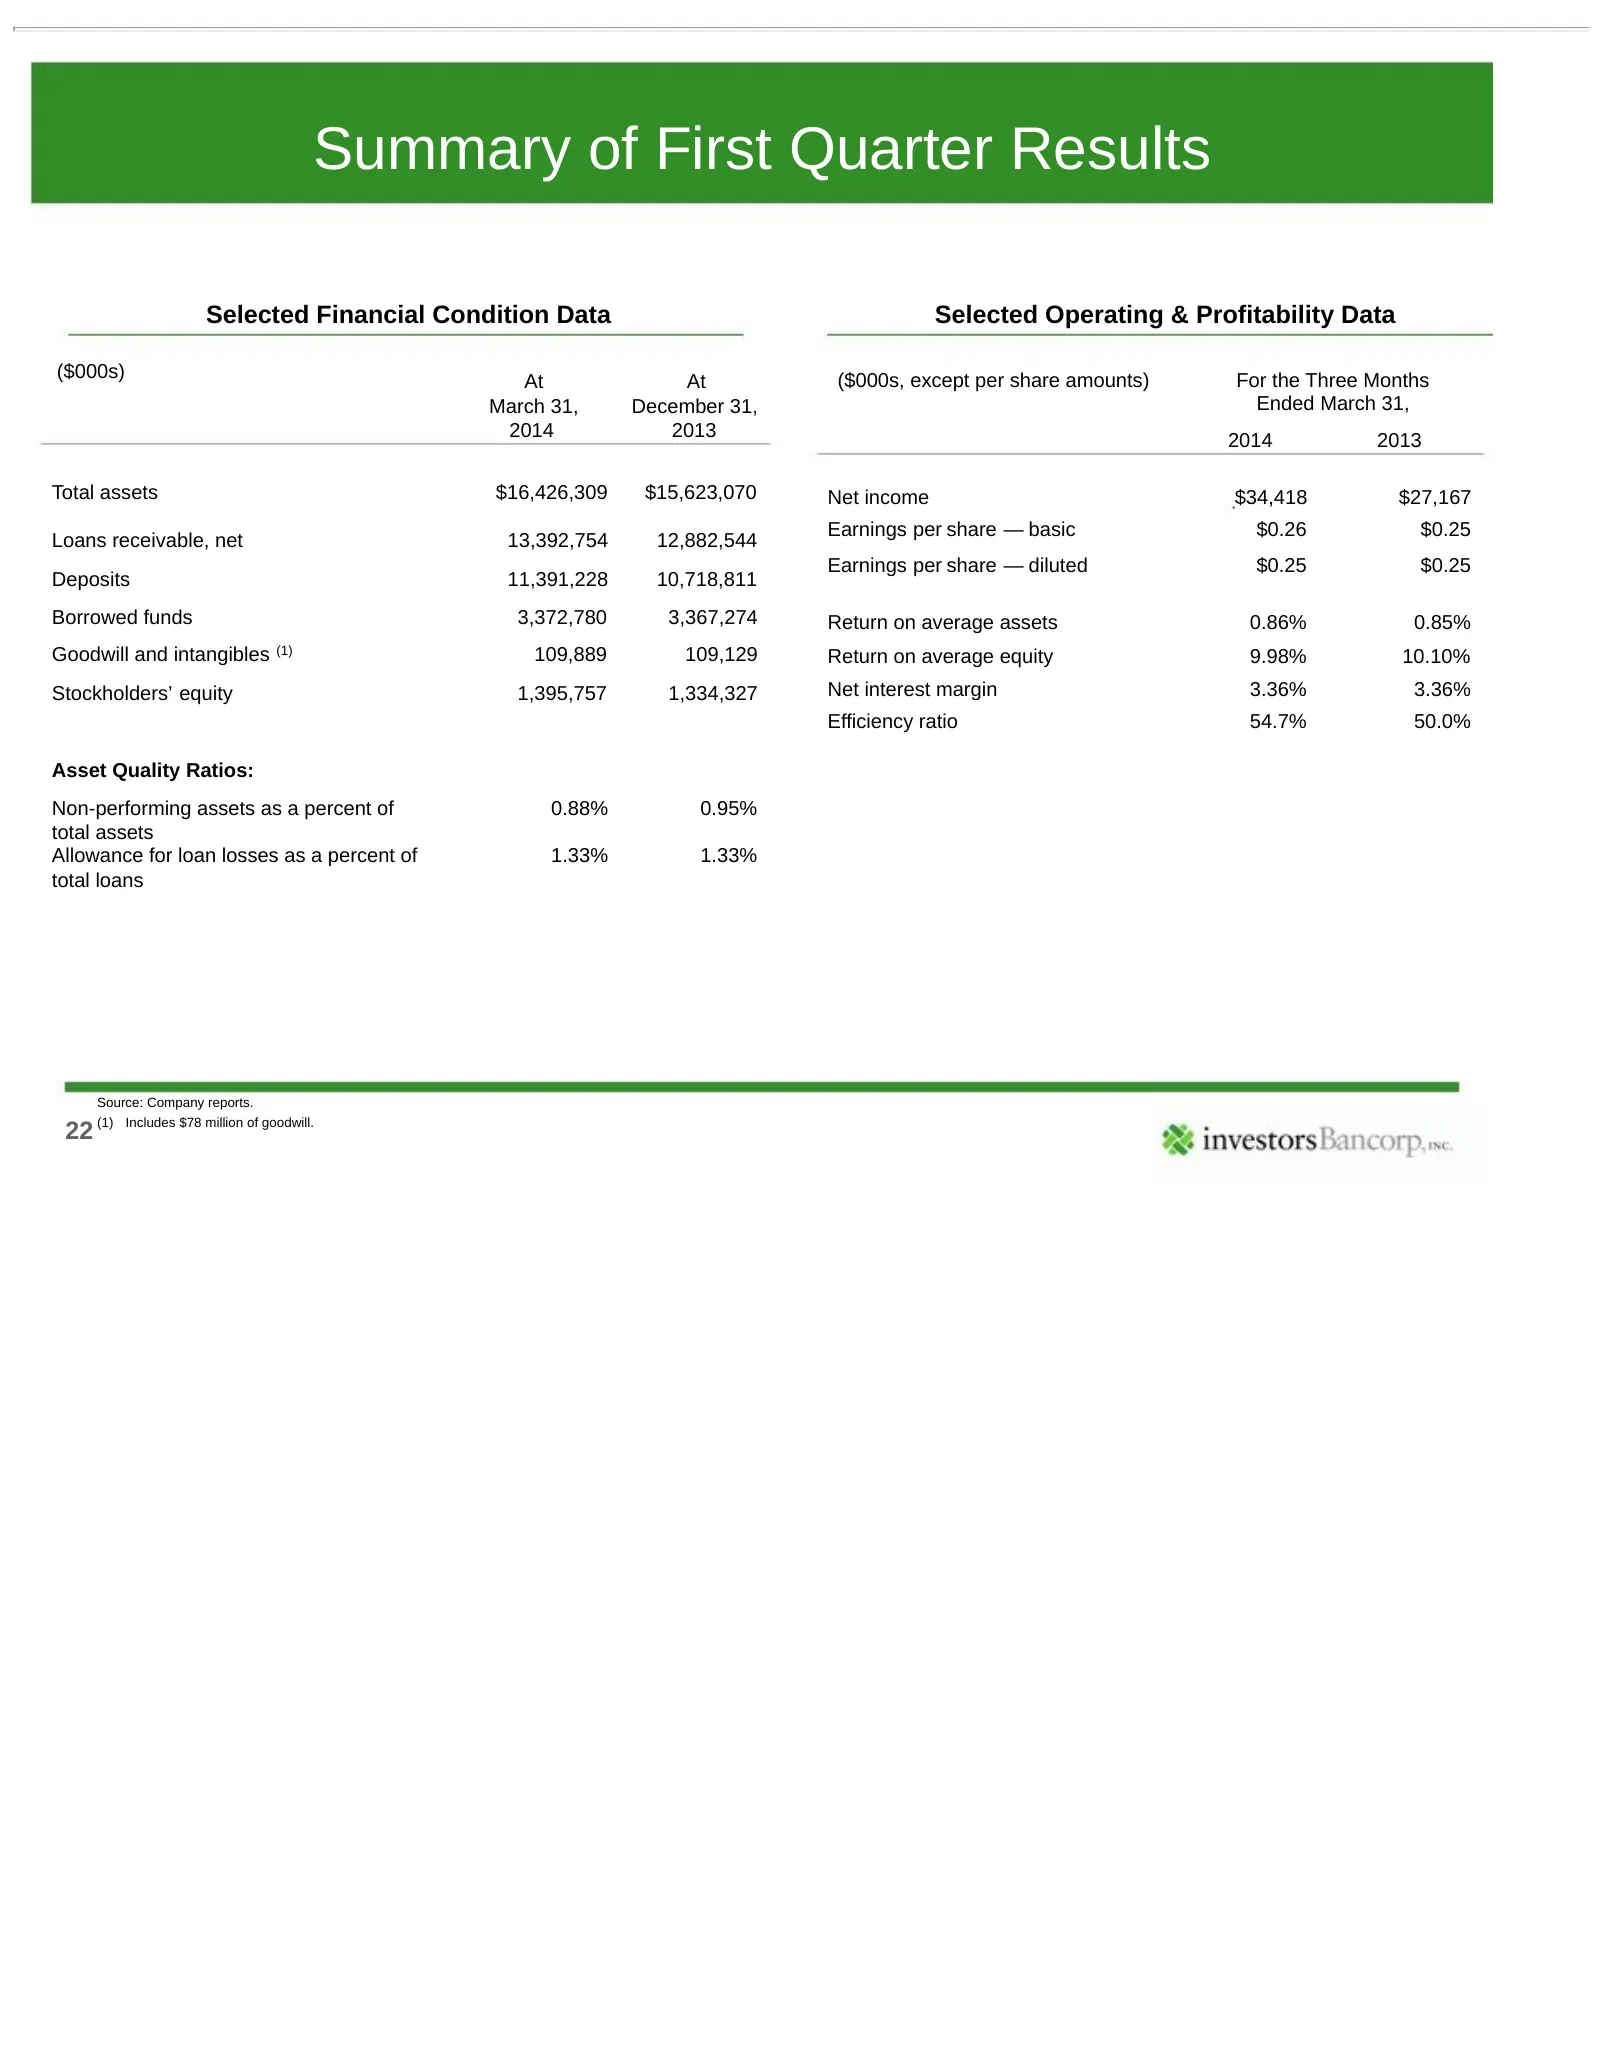
Summary of First Quarter Results Selected Financial Condition Data Selected Operating & Profitability Data ($000s) ($000s, except per share amounts) For the Three Months At At March 31, December 31, Ended March 31, 2014 2013 2014 2013 Total assets $16,426,309 $15,623,070 Net income $34,418 $27,167 E
Slide 23: Investment Rationale
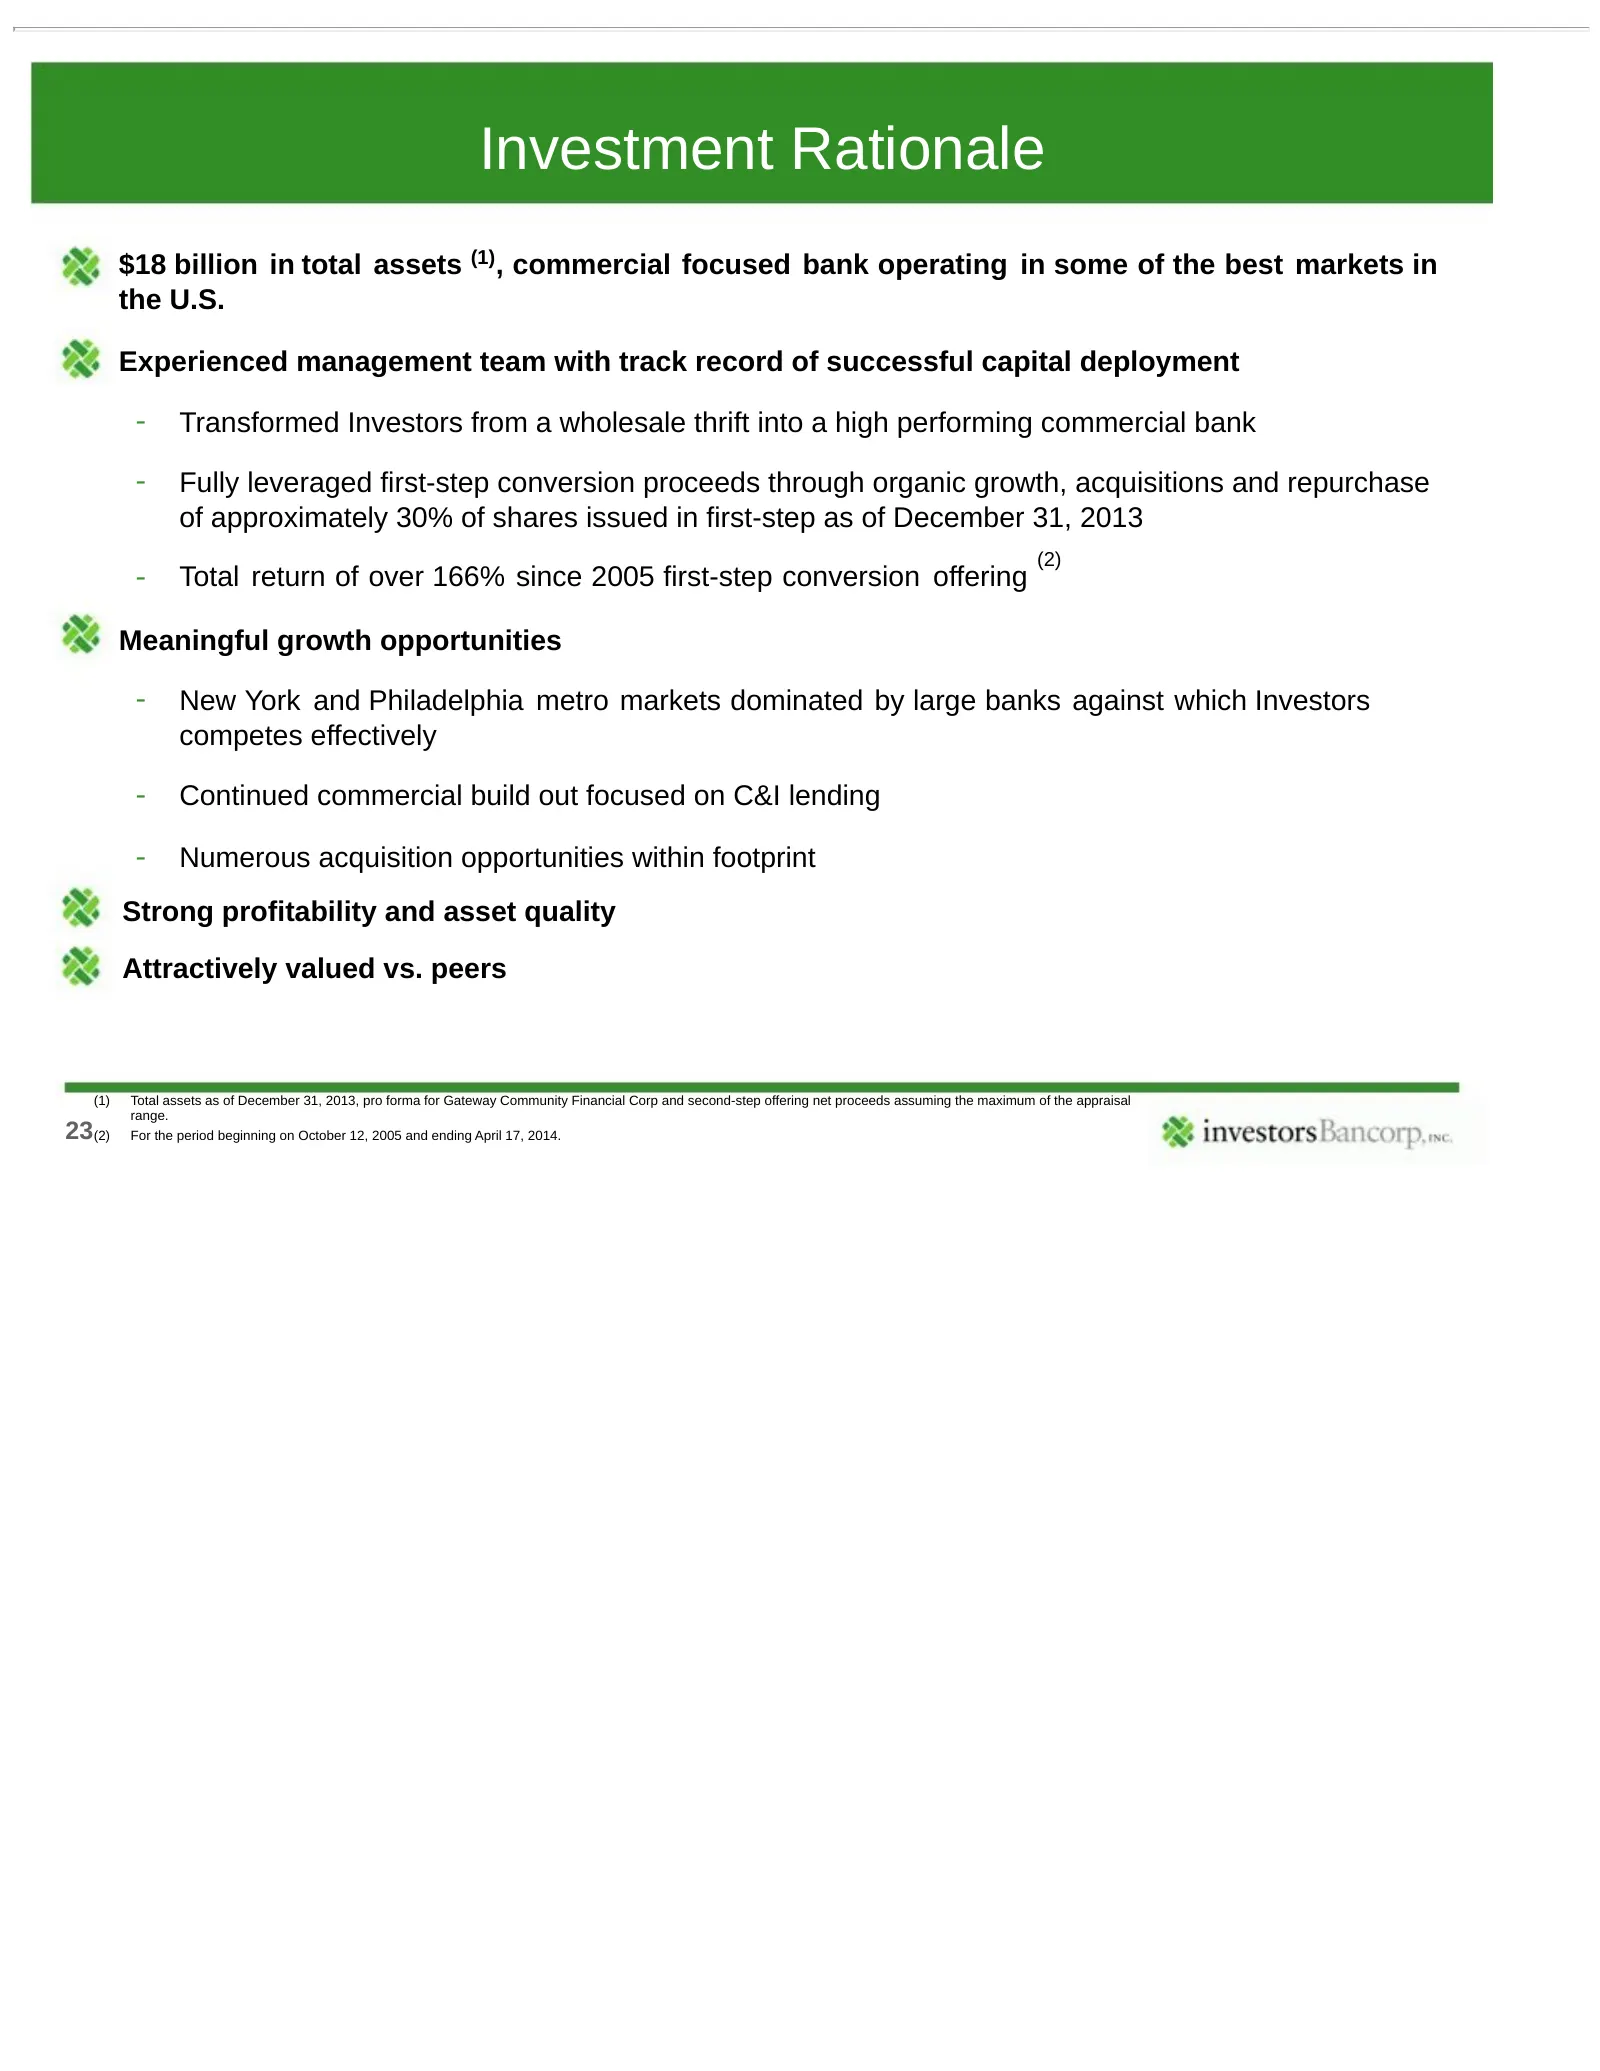
Investment Rationale $18 billion in total assets (1), commercial focused bank operating in some of the best markets in the U.S. Experienced management team with track record of successful capital deployment - Transformed Investors from a wholesale thrift into a high performing commercial bank - Full
Slide 24: Appendix
APPENDIX 24 & investors Bancorp.»«
Slide 25: Overview of Indicative Valuation Range
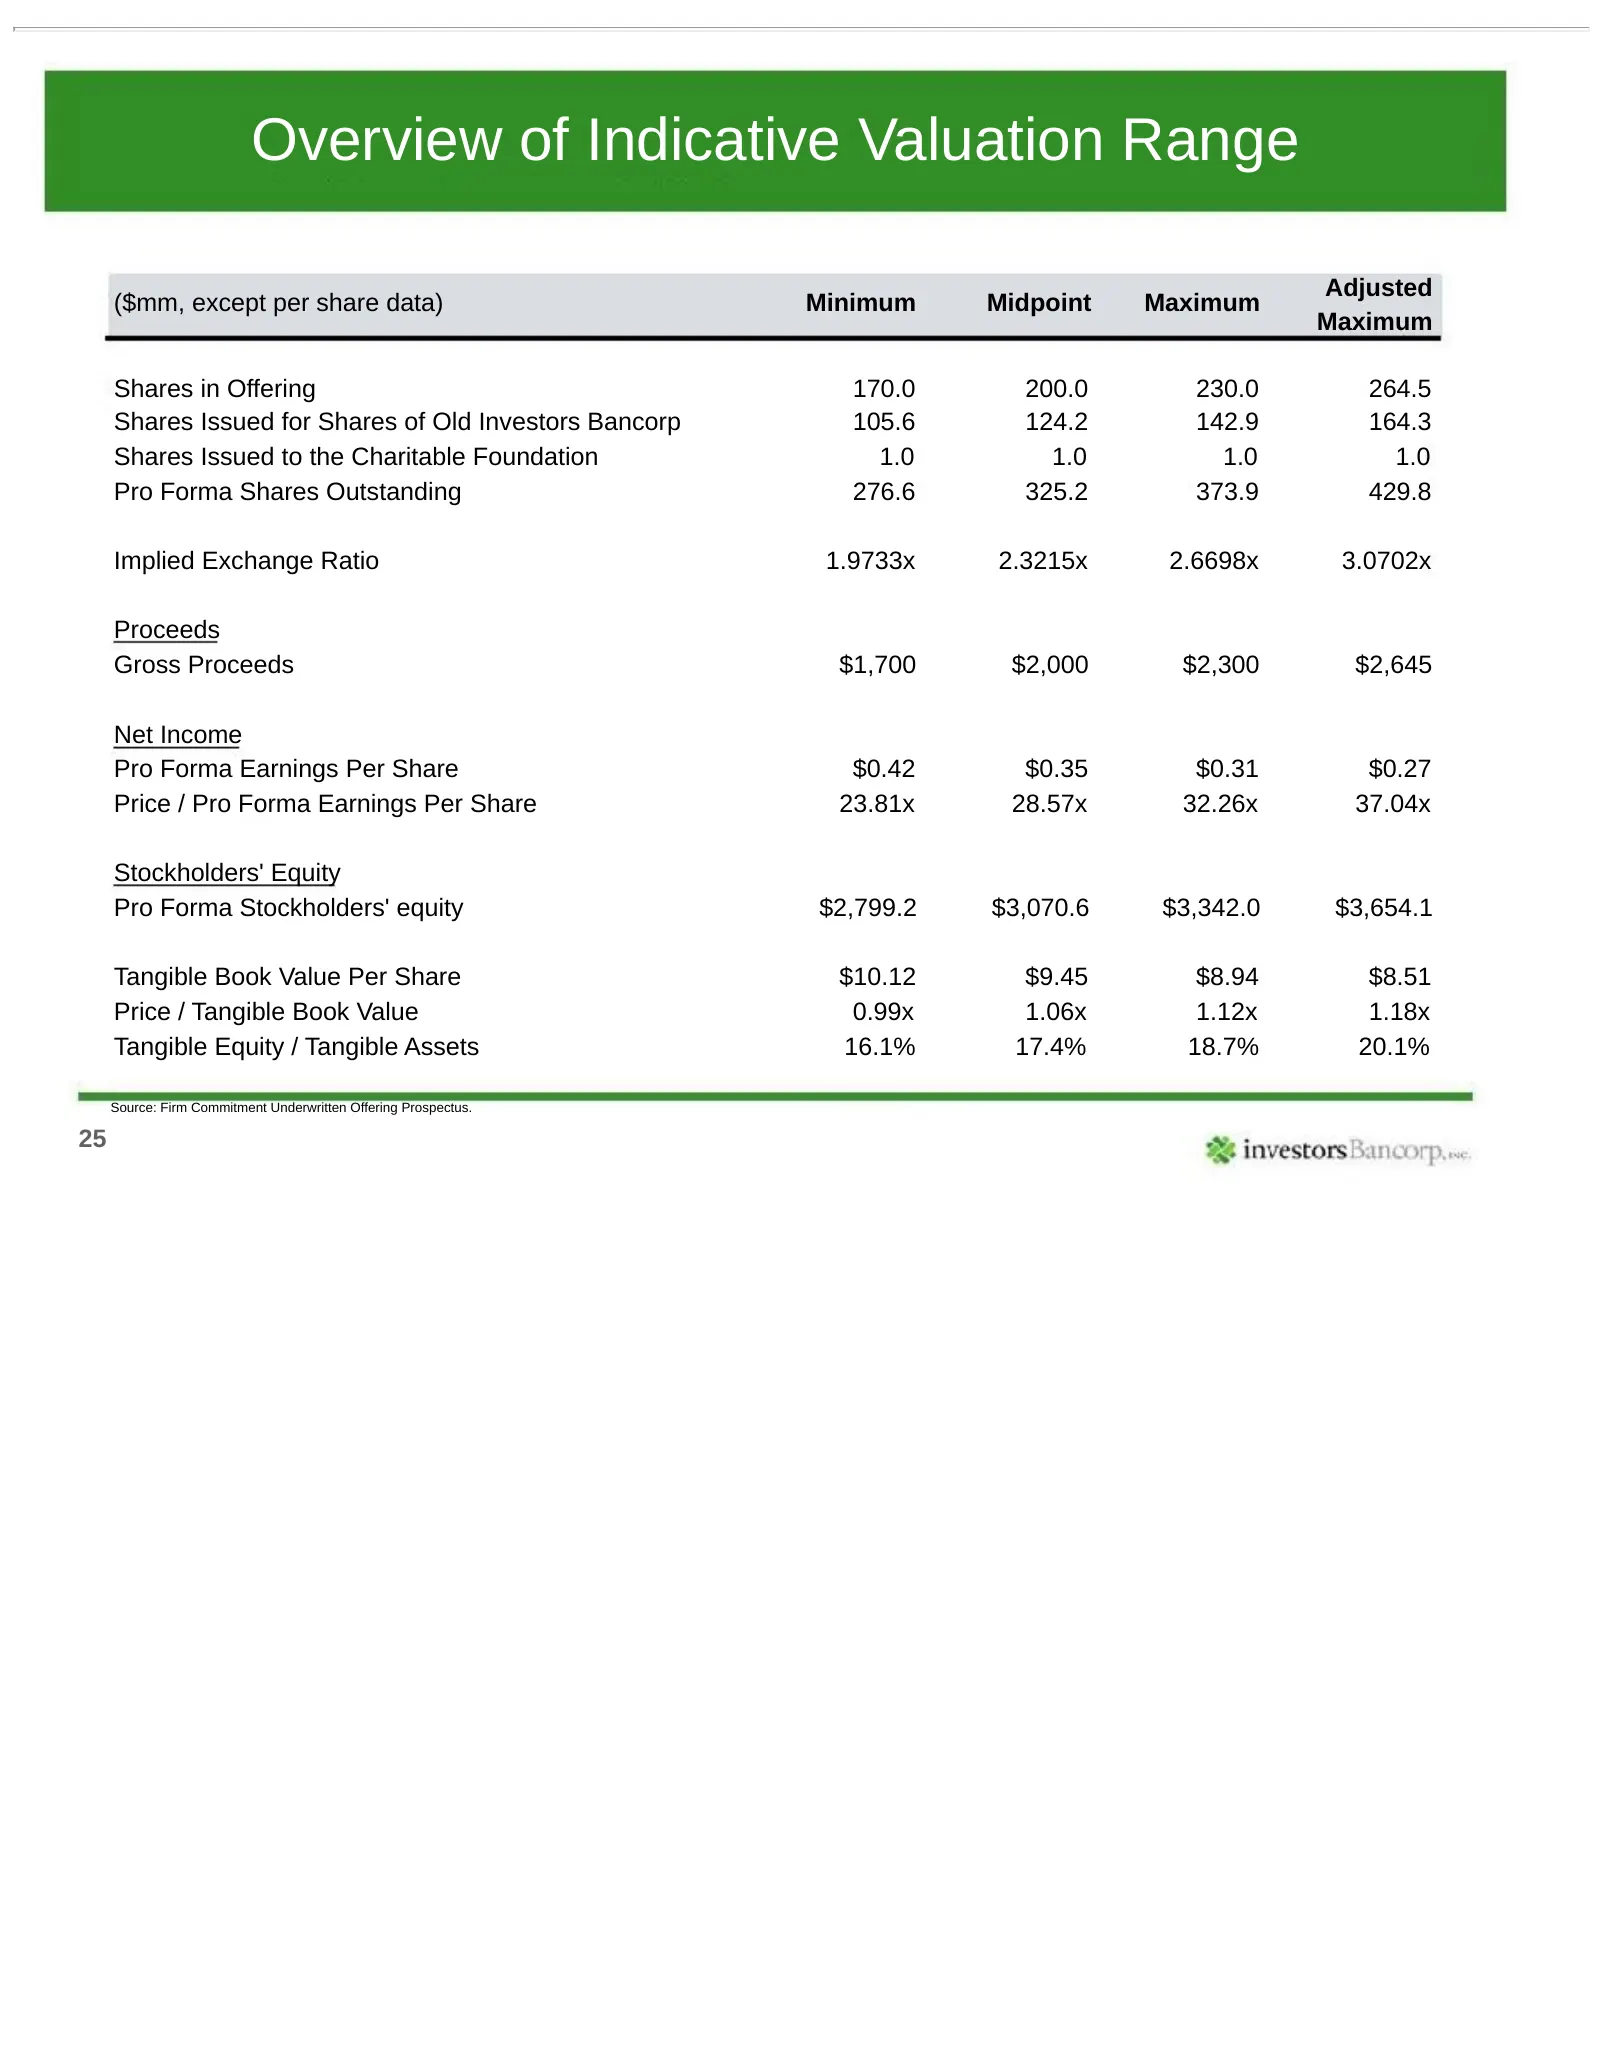
Overview of Indicative Valuation Range Adjusted ($mm, except per share data) Minimum Midpoint Maximum Maximum Shares in Offering 170.0 200.0 230.0 264.5 Shares Issued for Shares of Old Investors Bancorp 105.6 124.2 142.9 164.3 Shares Issued to the Charitable Foundation 1.0 1.0 1.0 1.0 Pro Forma Shar
Slide 26: Loan Portfolio
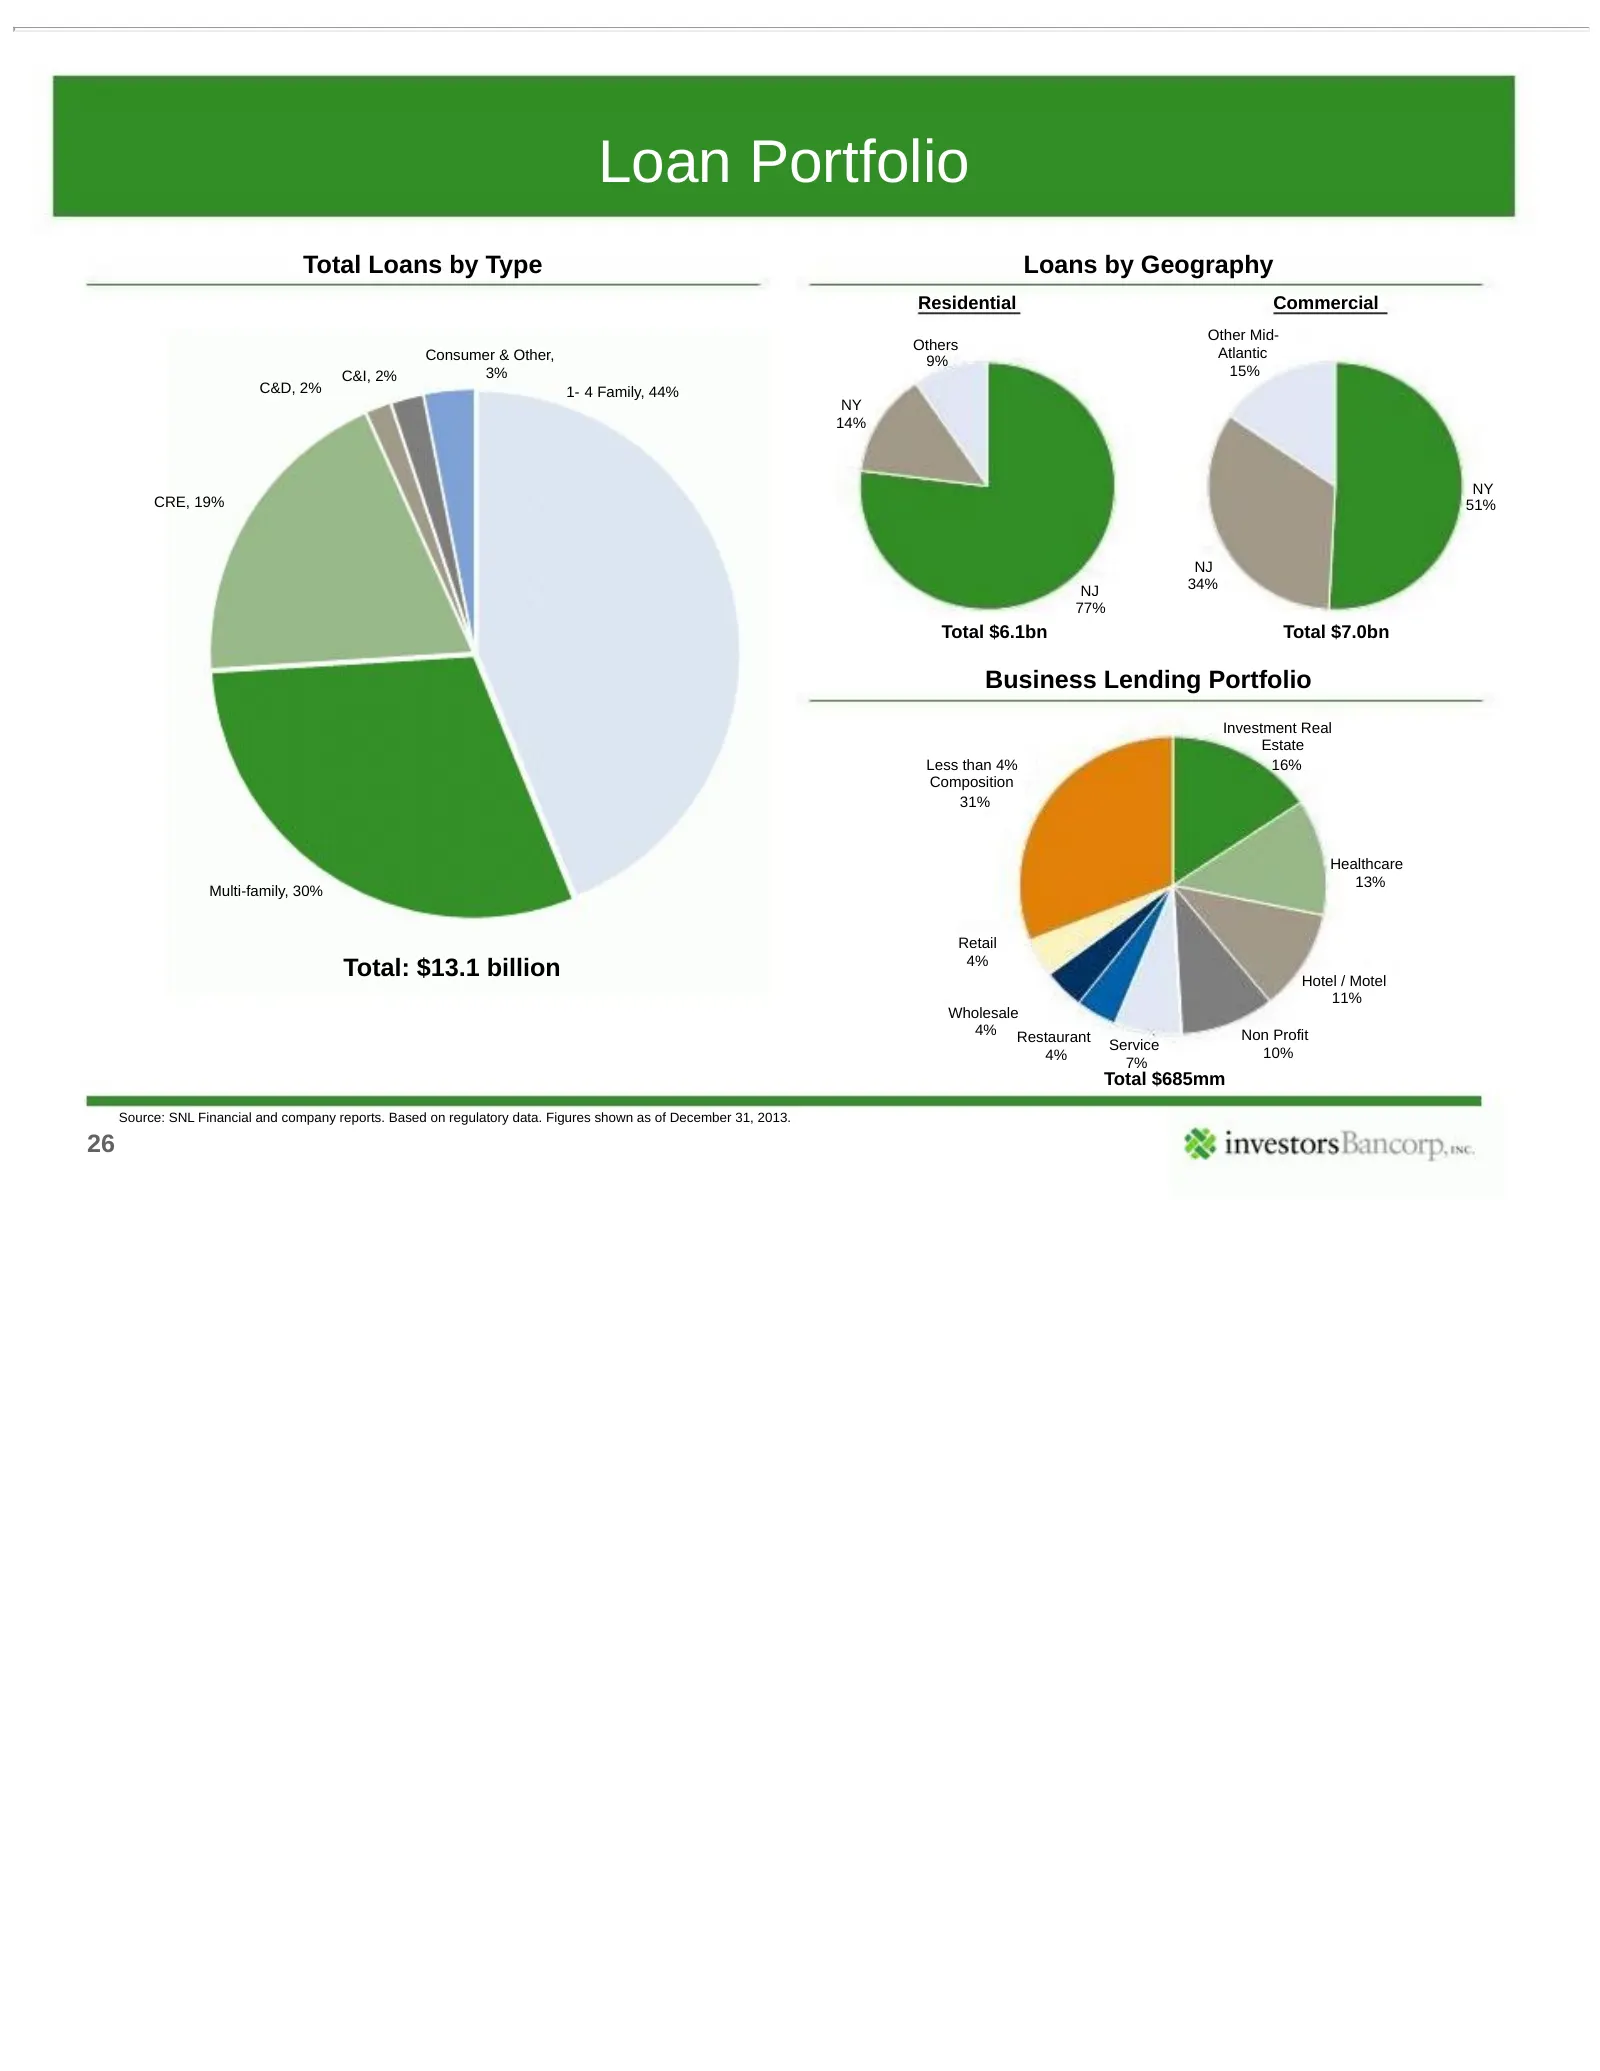
Loan Portfolio Total Loans by Type Loans by Geography Residential Commercial Other Mid- Others Consumer & Other, Atlantic 9% C&I, 2% 3% 15% C&D, 2% 1- 4 Family, 44% NY 14% NY CRE, 19% 51% NJ NJ 34% 77% Total $6.1bn Total $7.0bn Business Lending Portfolio Investment Real Estate Less than 4% 16% Compo
Slide 27: Securities Portfolio
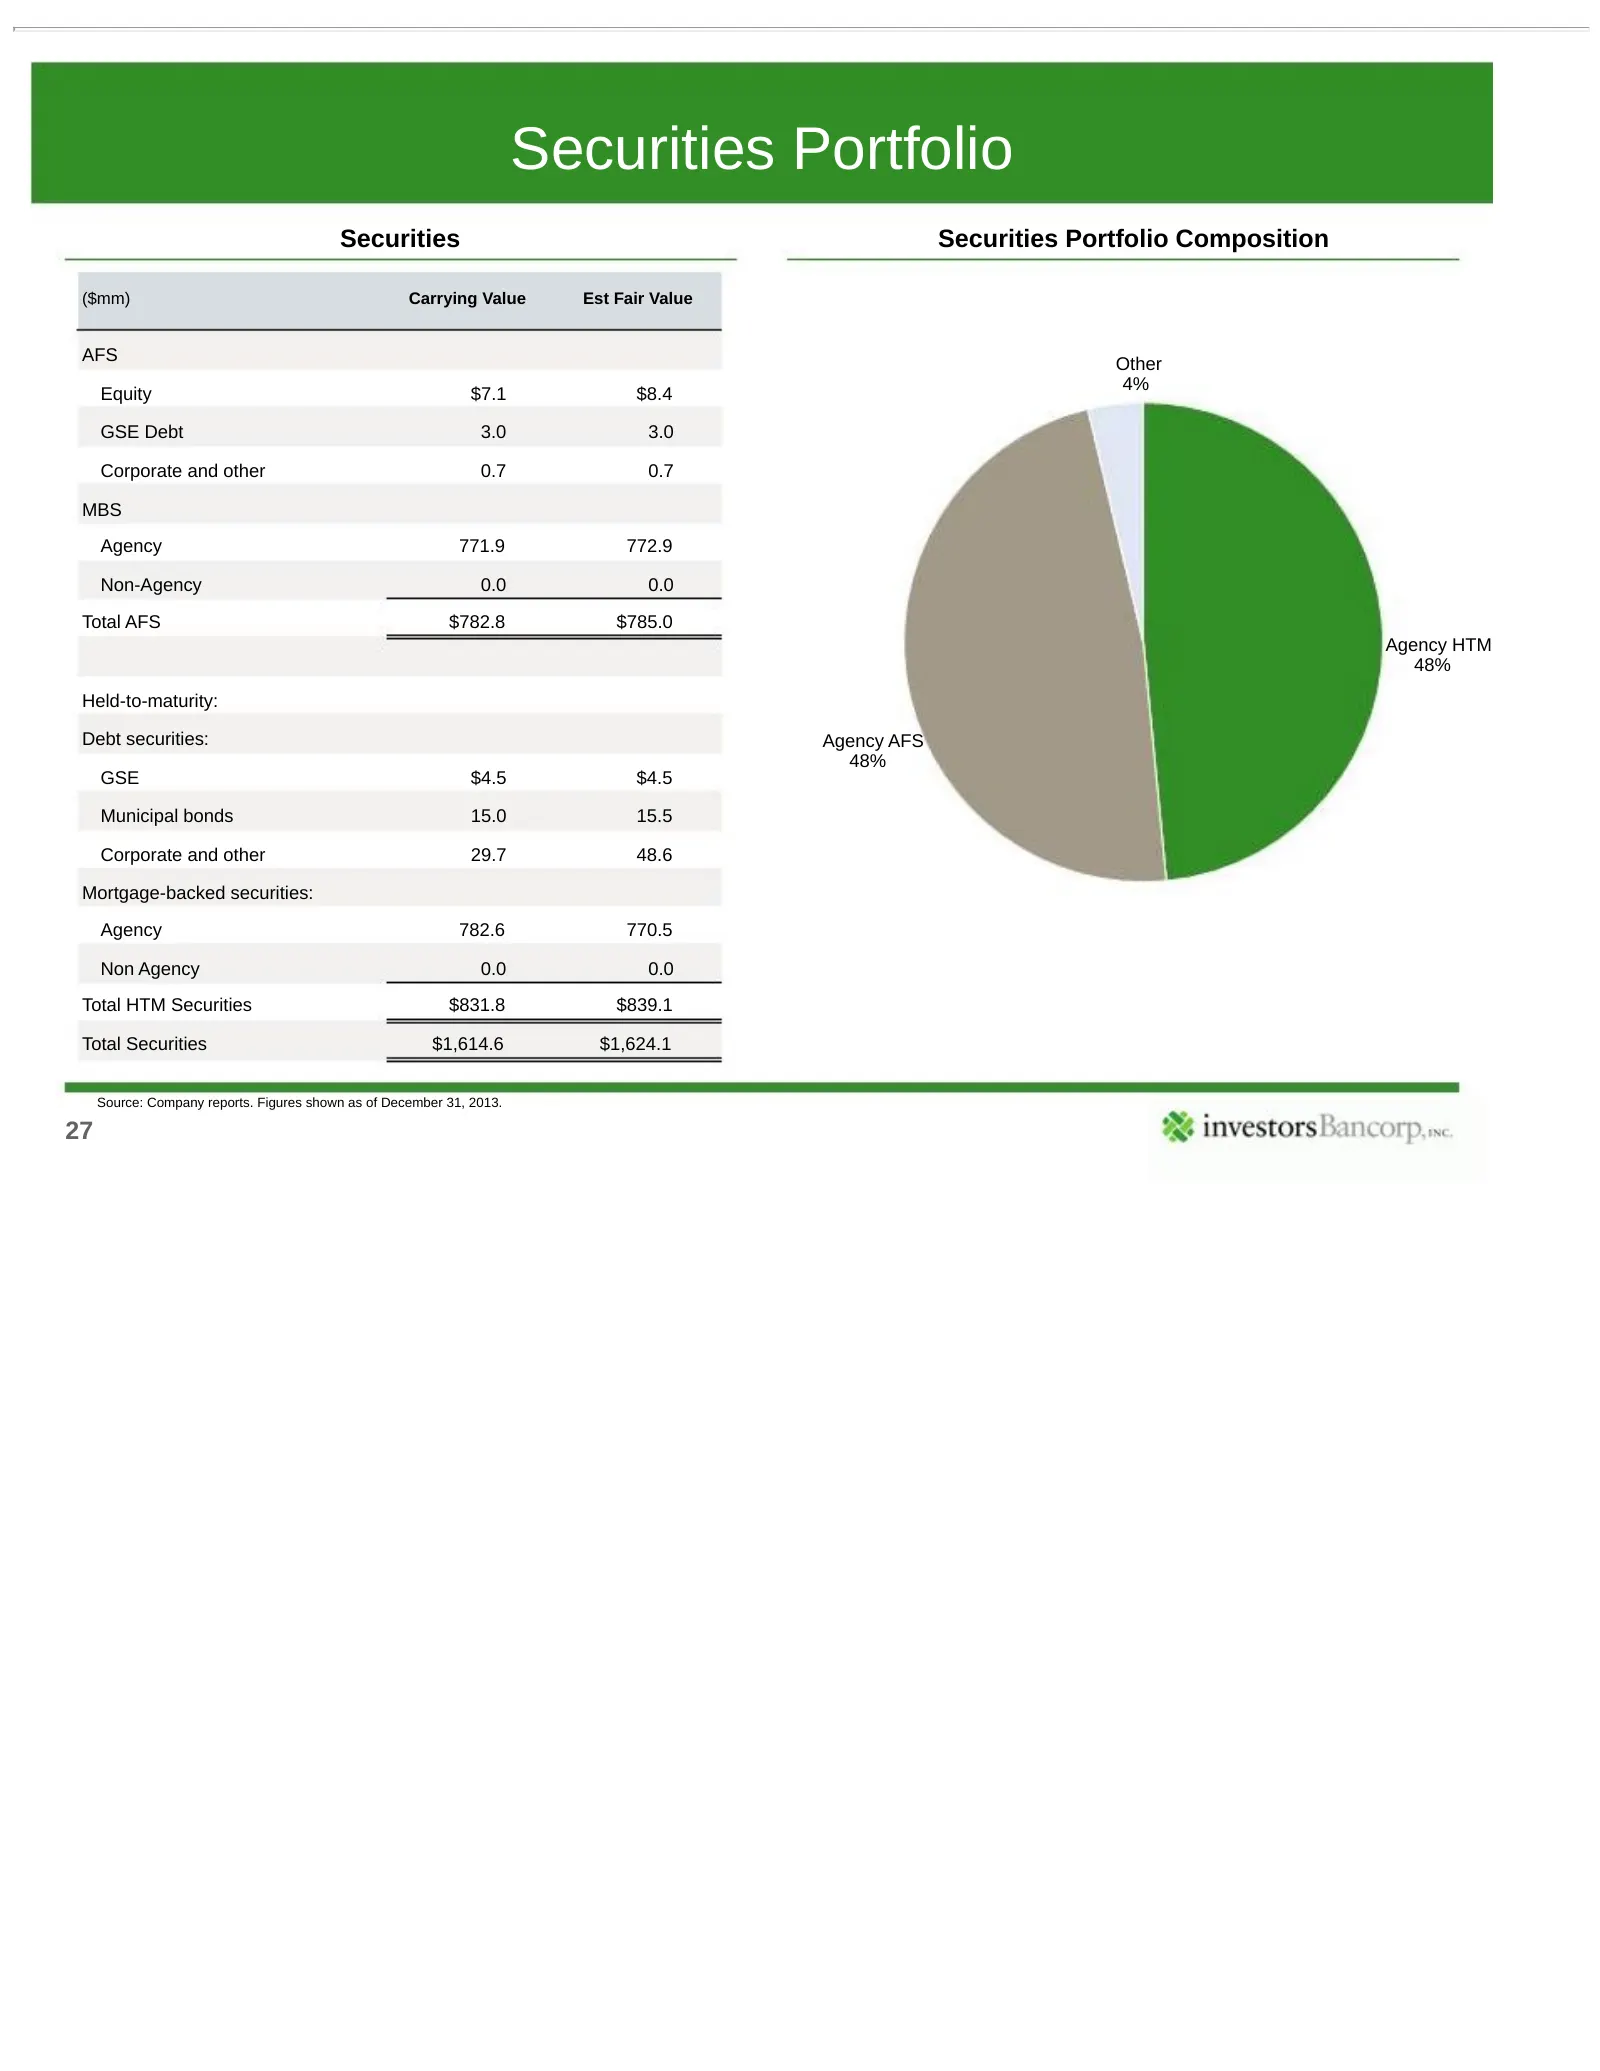
Securities Portfolio Securities Securities Portfolio Composition ($mm) Carrying Value Est Fair Value AFS Other 4% Equity $7.1 $8.4 GSE Debt 3.0 3.0 Corporate and other 0.7 0.7 MBS Agency 771.9 772.9 Non-Agency 0.0 0.0 Total AFS $782.8 $785.0 Agency HTM 48% Held-to-maturity: Debt securities: Agency A
Slide 28: Highly Attractive Banking Markets
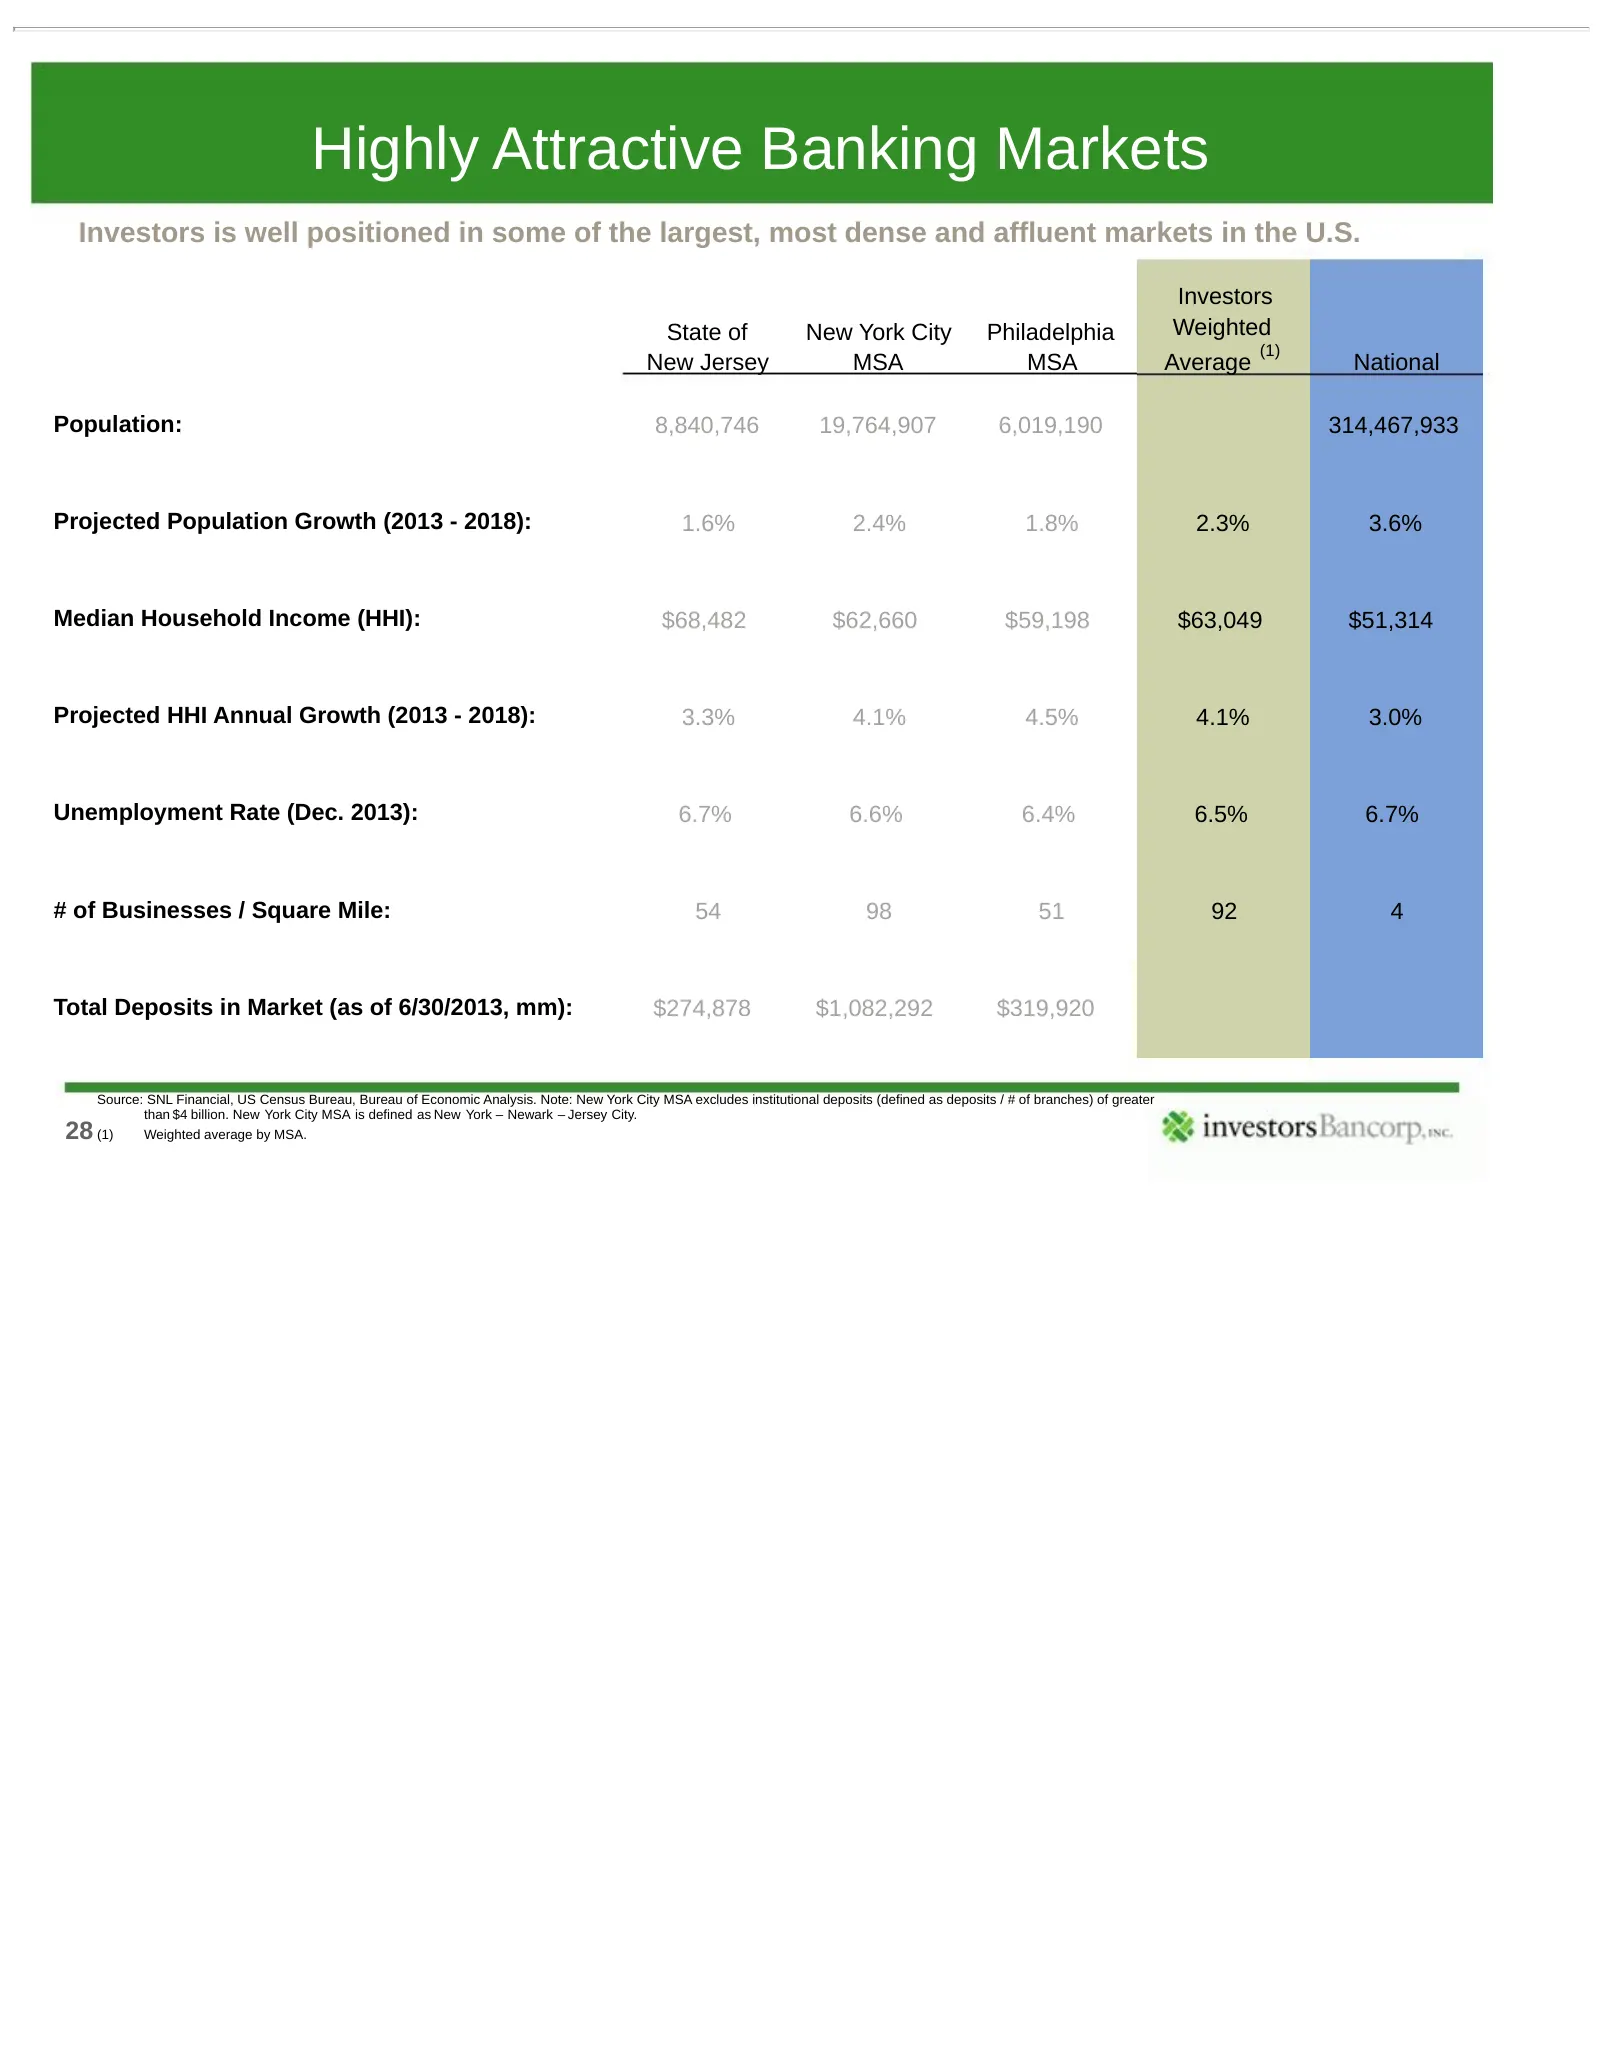
Highly Attractive Banking Markets Investors is well positioned in some of the largest, most dense and affluent markets in the U.S. Investors State of New York City Philadelphia Weighted (1) New Jersey MSA MSA Average National Population: 8,840,746 19,764,907 6,019,190 314,467,933 Projected Populatio
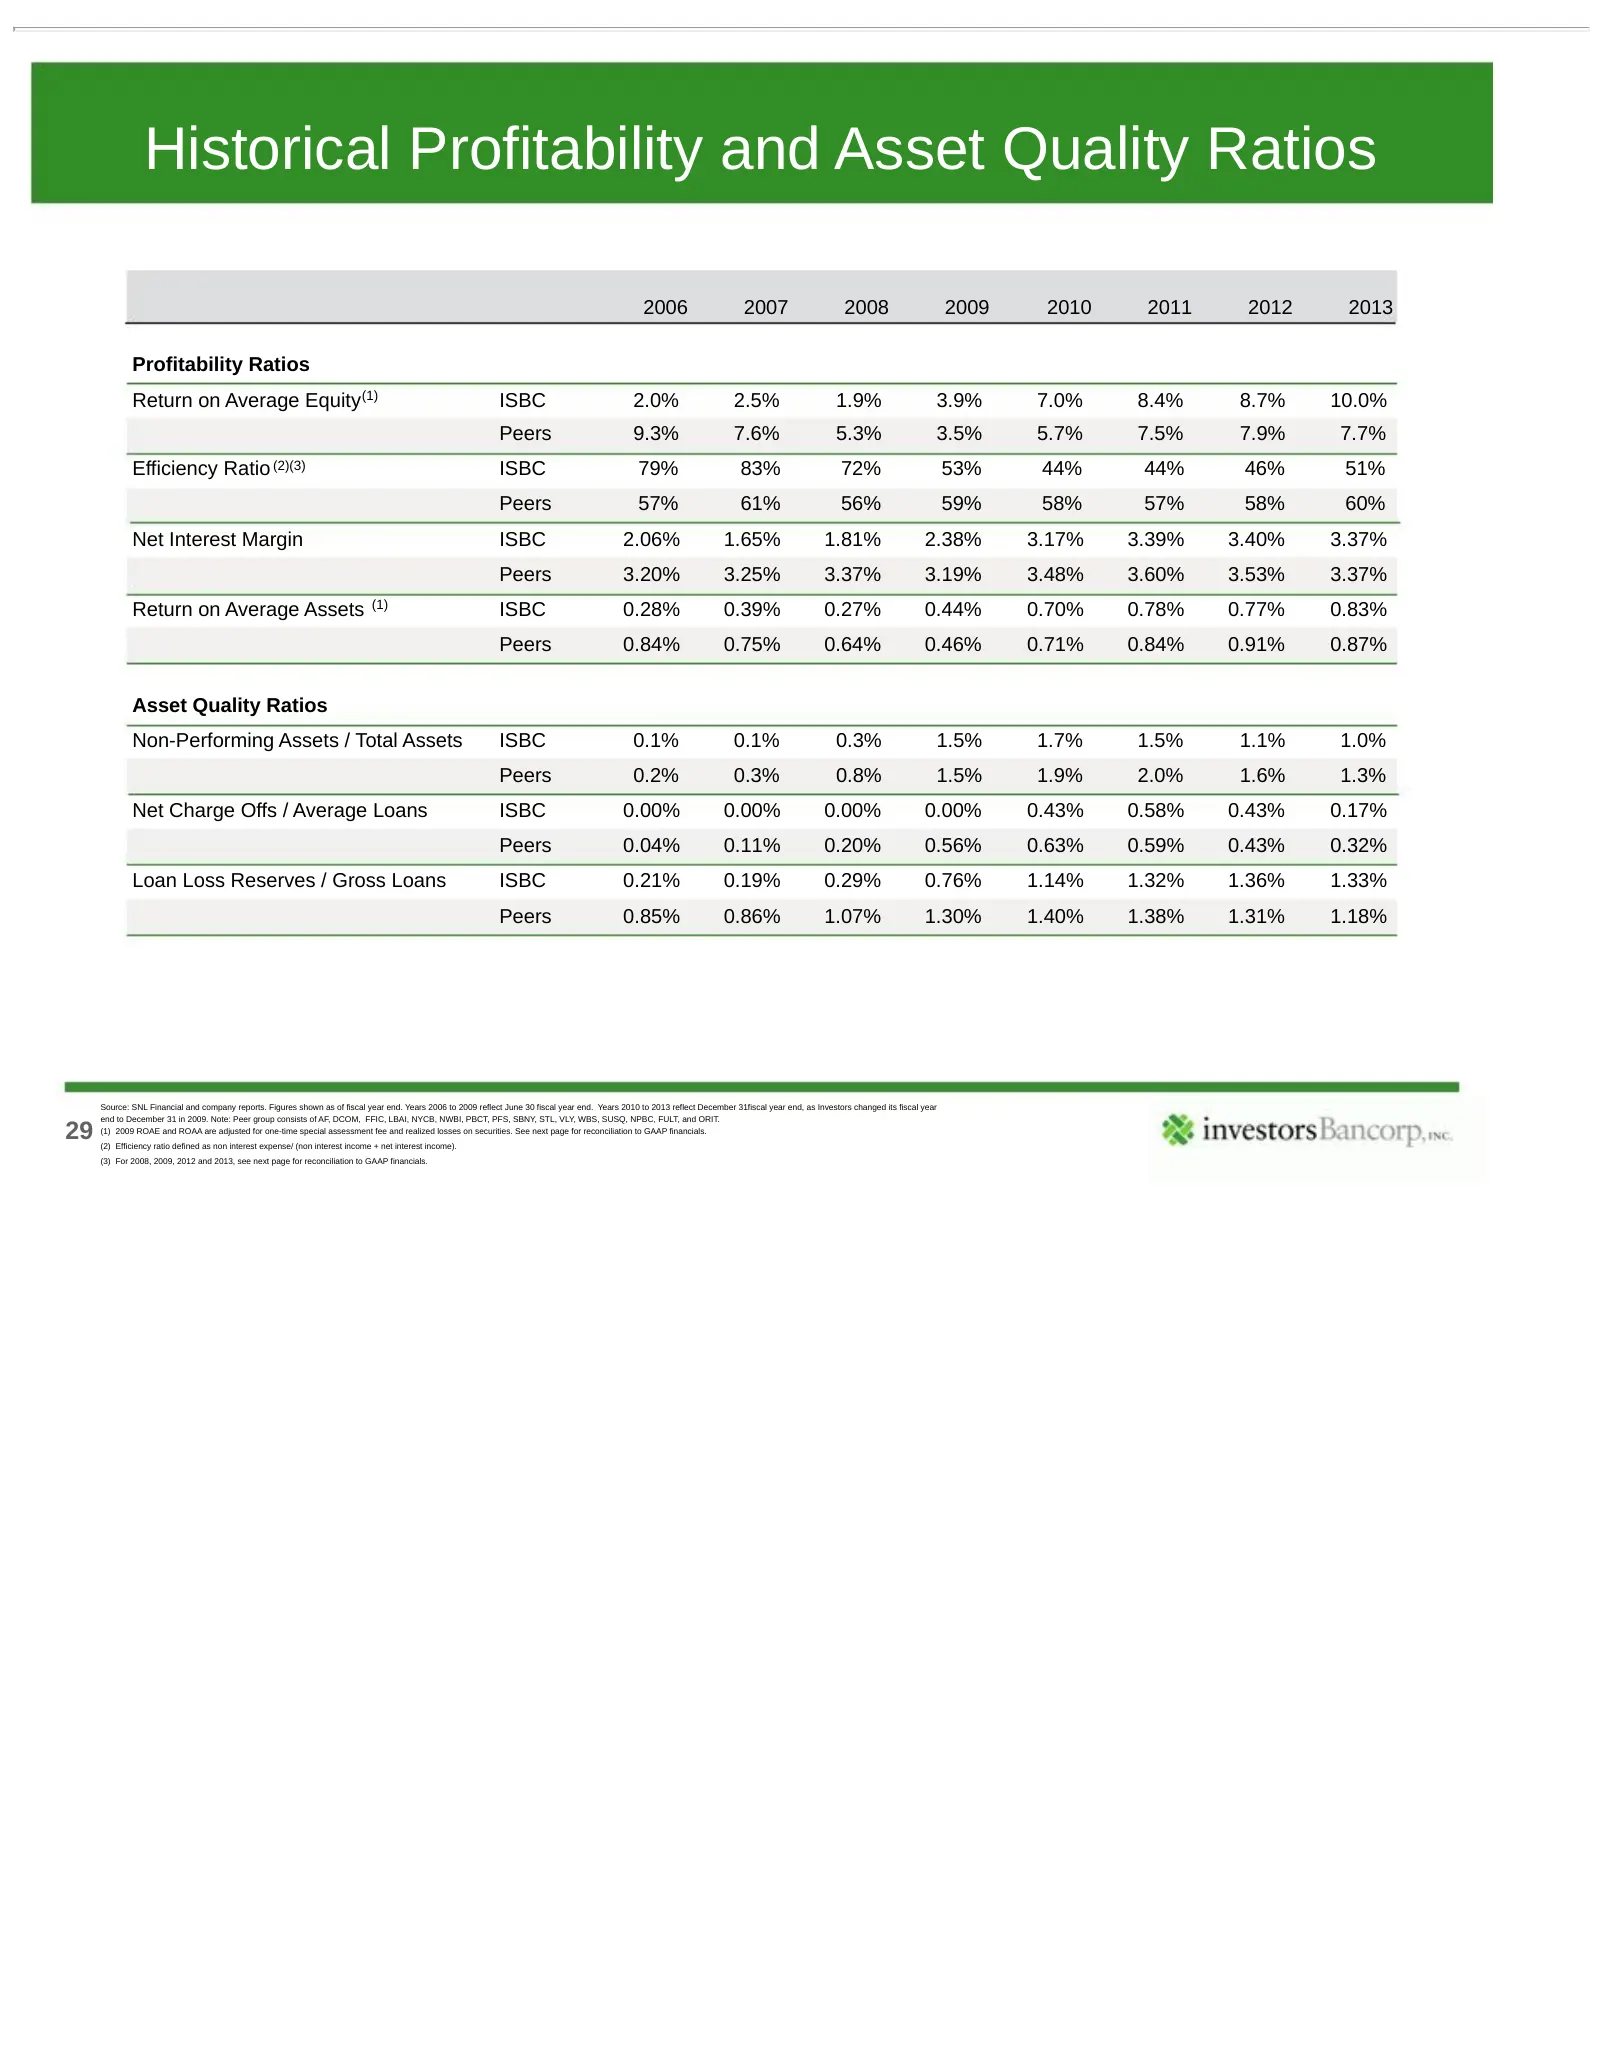
Slide 29: Historical Profitability and Asset Quality Ratios
Historical Profitability and Asset Quality Ratios 2006 2007 2008 2009 2010 2011 2012 2013 Profitability Ratios Return on Average Equity (1) ISBC 2.0% 2.5% 1.9% 3.9% 7.0% 8.4% 8.7% 10.0% Peers 9.3% 7.6% 5.3% 3.5% 5.7% 7.5% 7.9% 7.7% Efficiency Ratio (2)(3) ISBC 79% 83% 72% 53% 44% 44% 46% 51% Peers 5
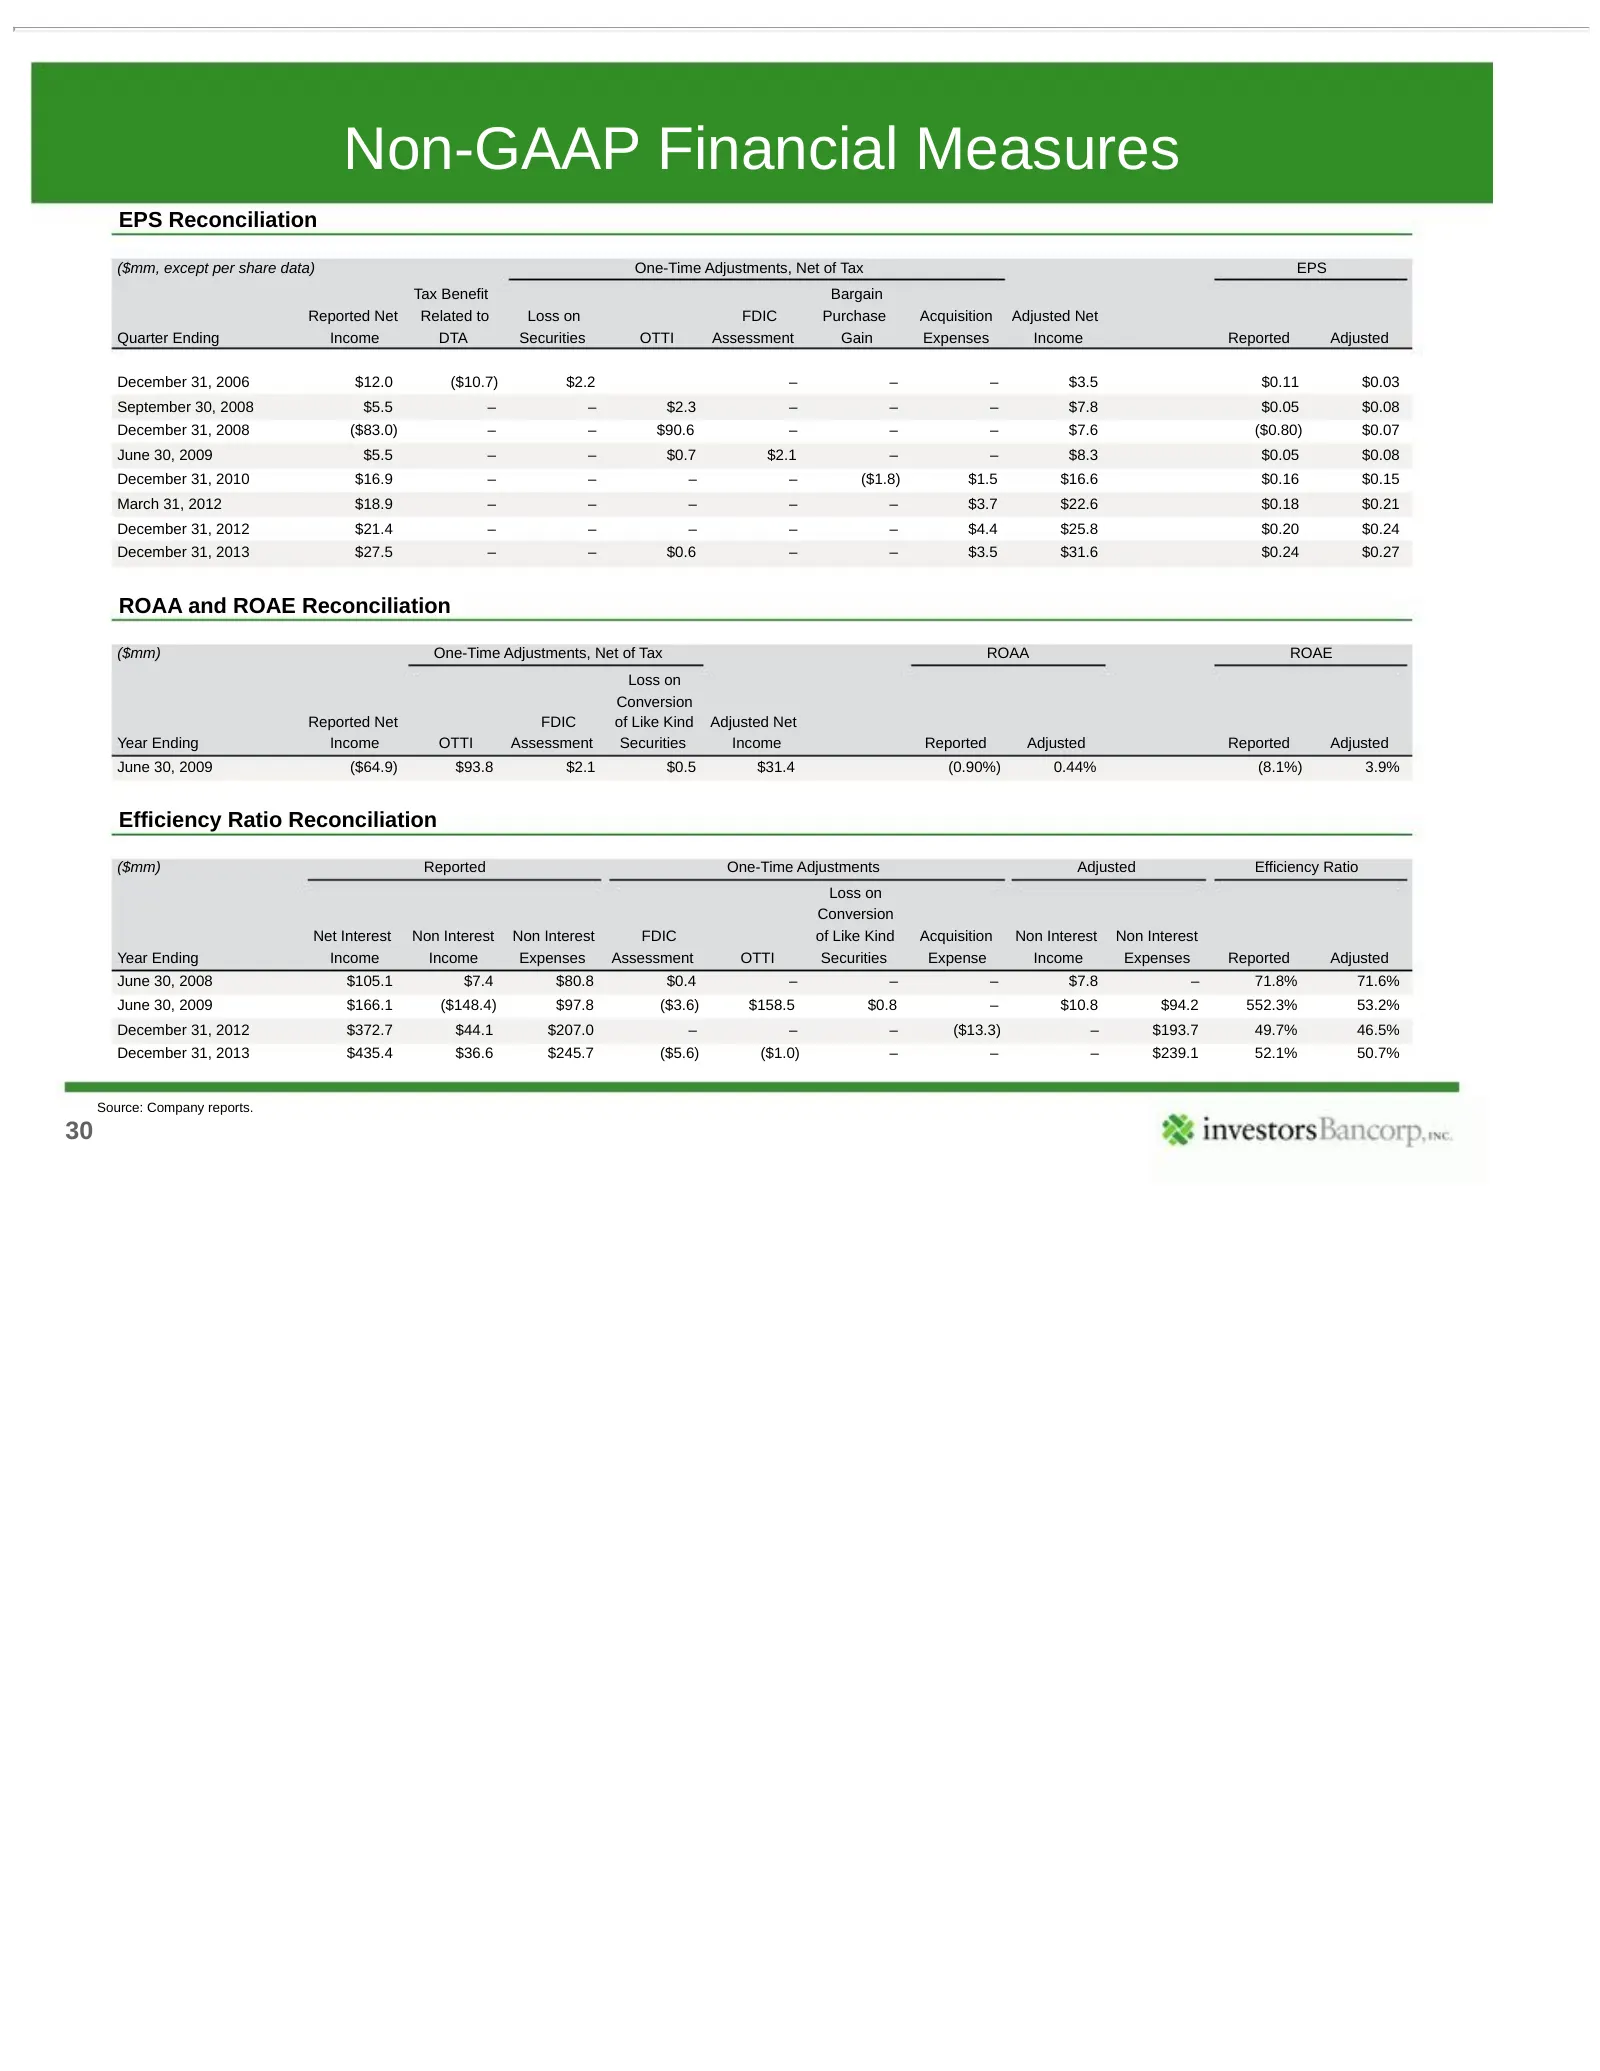
Slide 30: Non-GAAP Financial Measures
Non-GAAP Financial Measures EPS Reconciliation ($mm, except per share data) One-Time Adjustments, Net of Tax EPS Tax Benefit Bargain Reported Net Related to Loss on FDIC Purchase Acquisition Adjusted Net Quarter Ending Income DTA Securities OTTI Assessment Gain Expenses Income Reported Adjusted Dece
Slide 31: Investor Presentation
Investor Presentation # investors Bancorp, wc.
Source: SEC EDGAR · FWP filed Apr 21, 2014
More decks from Investors Bancorp Inc
 Q4 2021 Earnings Presentation4 slides · Jan 26, 2022
 Q3 2021 Earnings Presentation4 slides · Oct 27, 2021
 Q2 2021 Earnings Presentation4 slides · Jul 28, 2021
 Merger or Acquisition (July 2021)17 slides · Jul 28, 2021
 Q1 2021 Earnings Presentation4 slides · Apr 28, 2021
 Q4 2020 Earnings Presentation4 slides · Jan 28, 2021