PT Sarana Menara Nusantara Tbk · IDX:TOWR
PT Sarana Menara Nusantara Tbk — FY2016 Earnings Presentation
12 slides from PT Sarana Menara Nusantara Tbk's earnings presentation, 2017
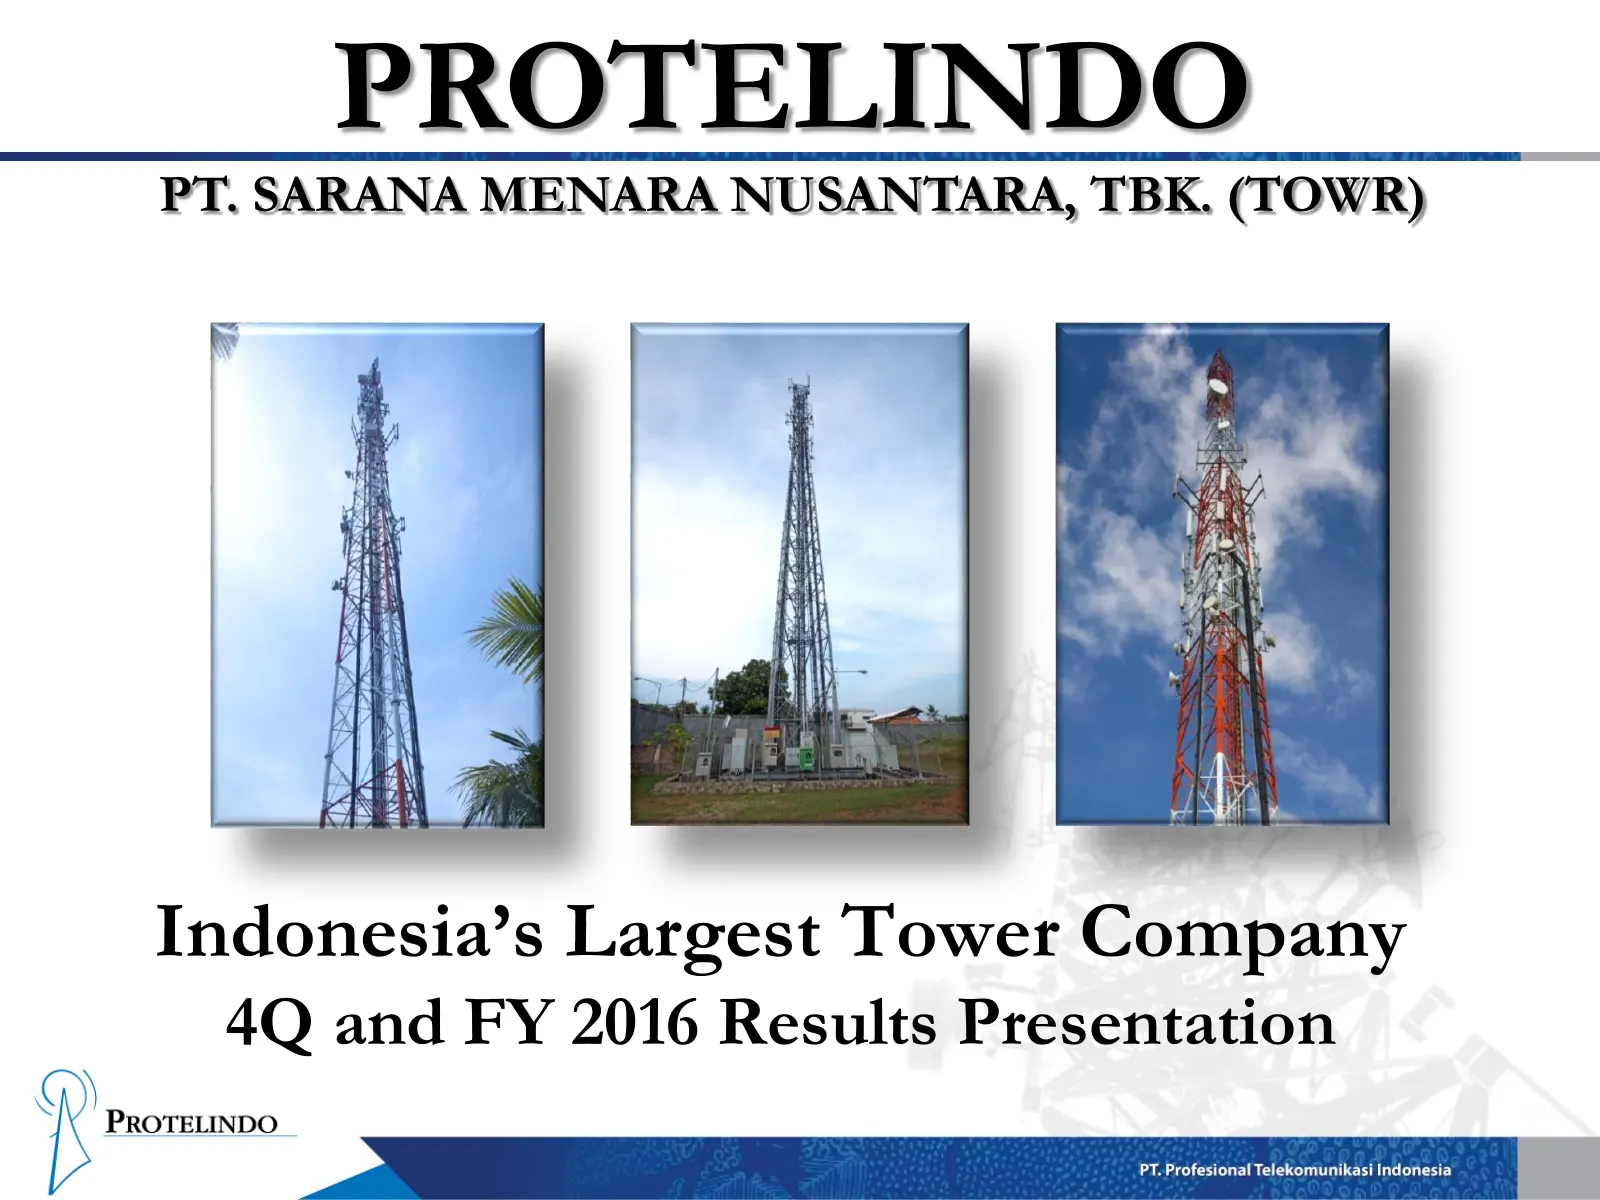
Slide 1: 4Q and FY 2016 Results Presentation
PROTELINDO PT. SARANA MENARA NUSANTARA, TBK. (TOWR) Indonesia’s Largest Tower Company 4Q and FY 2016 Results Presentation
Slide 2: Disclaimer
Disclaimer These materials have been prepared by PT Sarana Menara Nusantara, Tbk. (the “Company”) and have not been independently verified. No representation or warranty, expressed or implied, is made and no reliance should be placed on the accuracy, fairness or completeness of the information prese
Slide 3: Agenda
Agenda Achievements in 2016 Financial Results Operational Performance 2
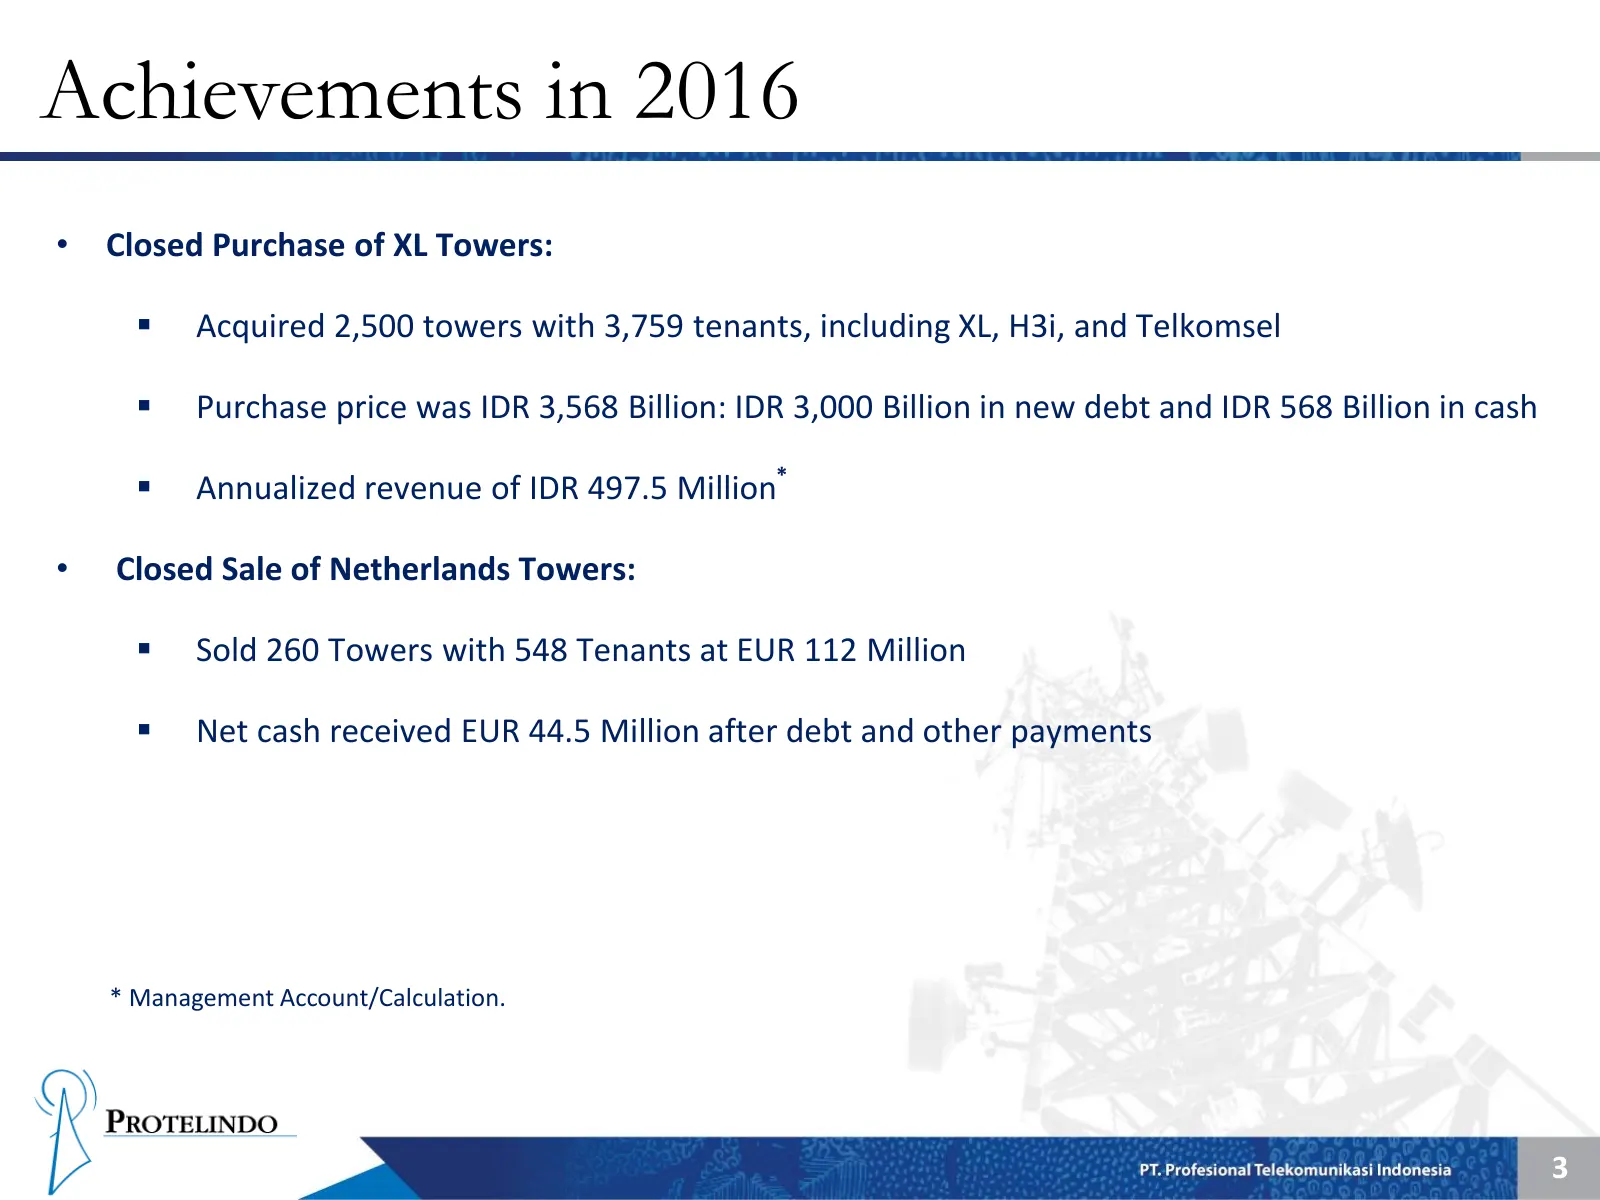
Slide 4: Achievements in 2016
Achievements in 2016 • Closed Purchase of XL Towers: Acquired 2,500 towers with 3,759 tenants, including XL, H3i, and Telkomsel Purchase price was IDR 3,568 Billion: IDR 3,000 Billion in new debt and IDR 568 Billion in cash Annualized revenue of IDR 497.5 Million* • Closed Sale of Netherlands
Slide 5: Achievements in 2016
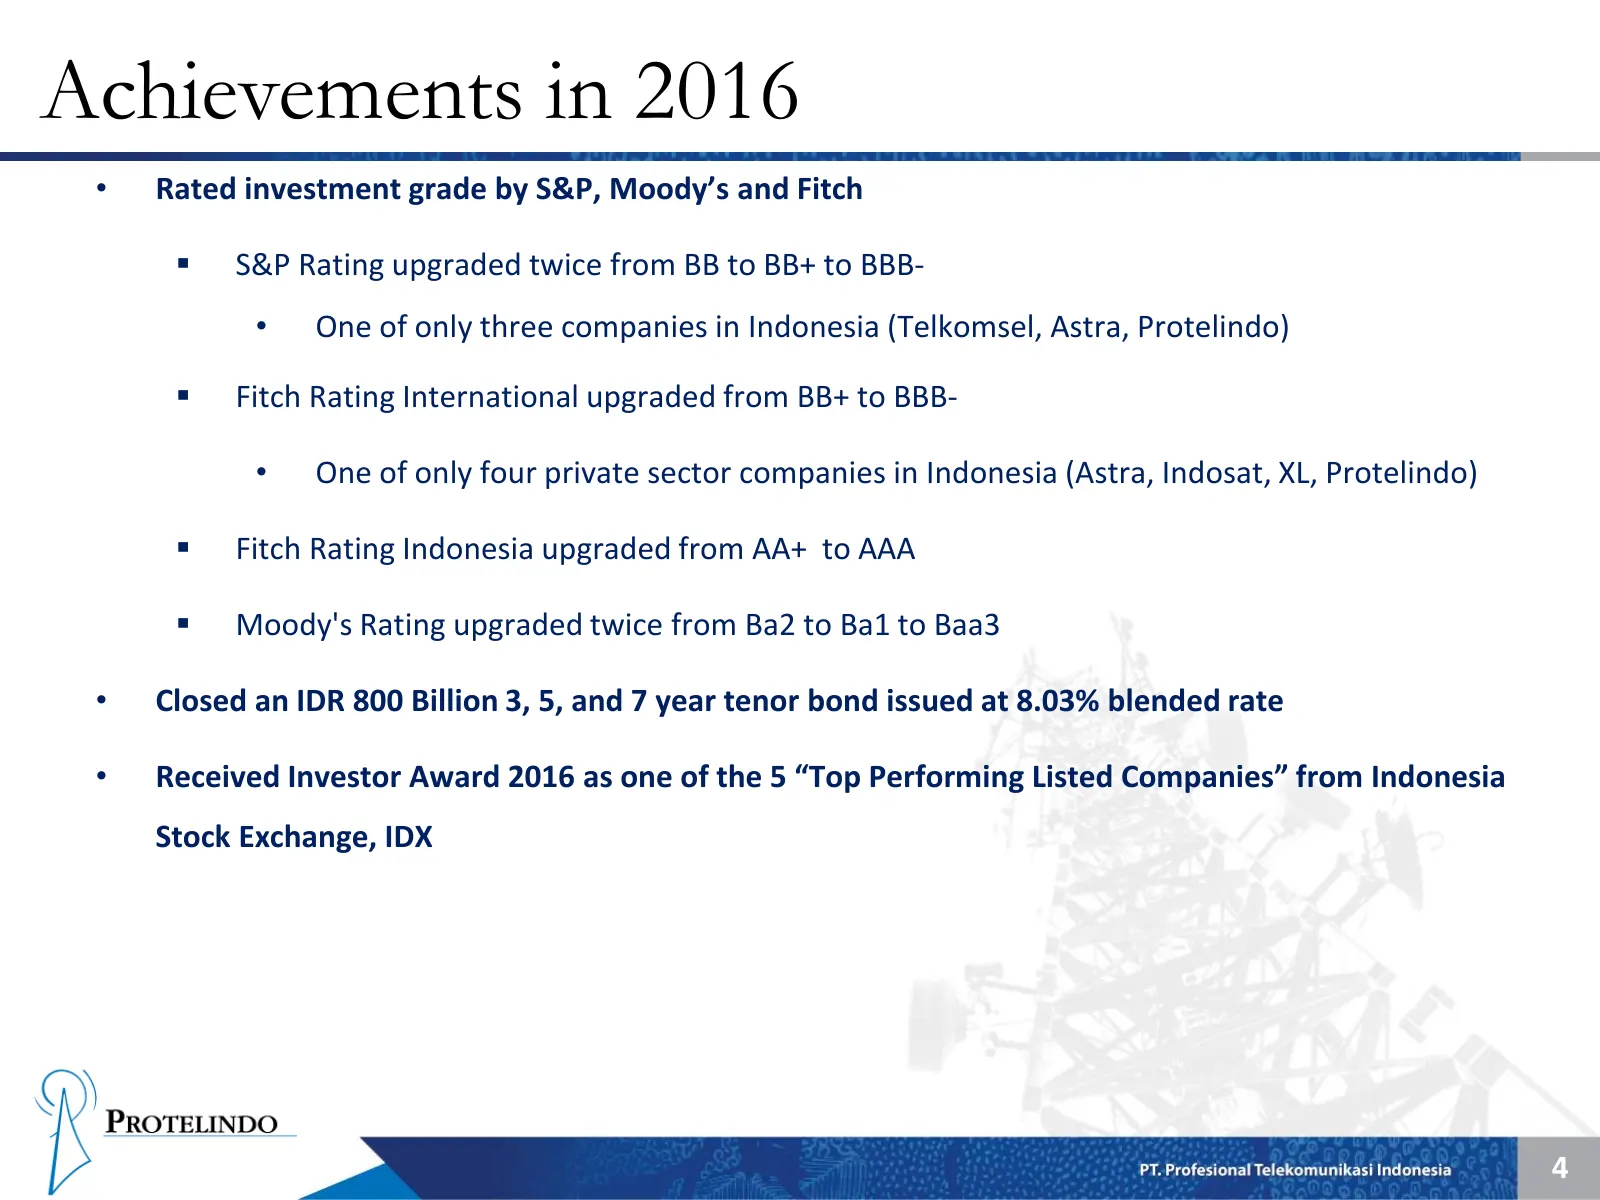
Achievements in 2016 • Rated investment grade by S&P, Moody’s and Fitch S&P Rating upgraded twice from BB to BB+ to BBB- • One of only three companies in Indonesia (Telkomsel, Astra, Protelindo) Fitch Rating International upgraded from BB+ to BBB- • One of only four private sector companies in I
Slide 6: Full Year Financial Results: Revenue
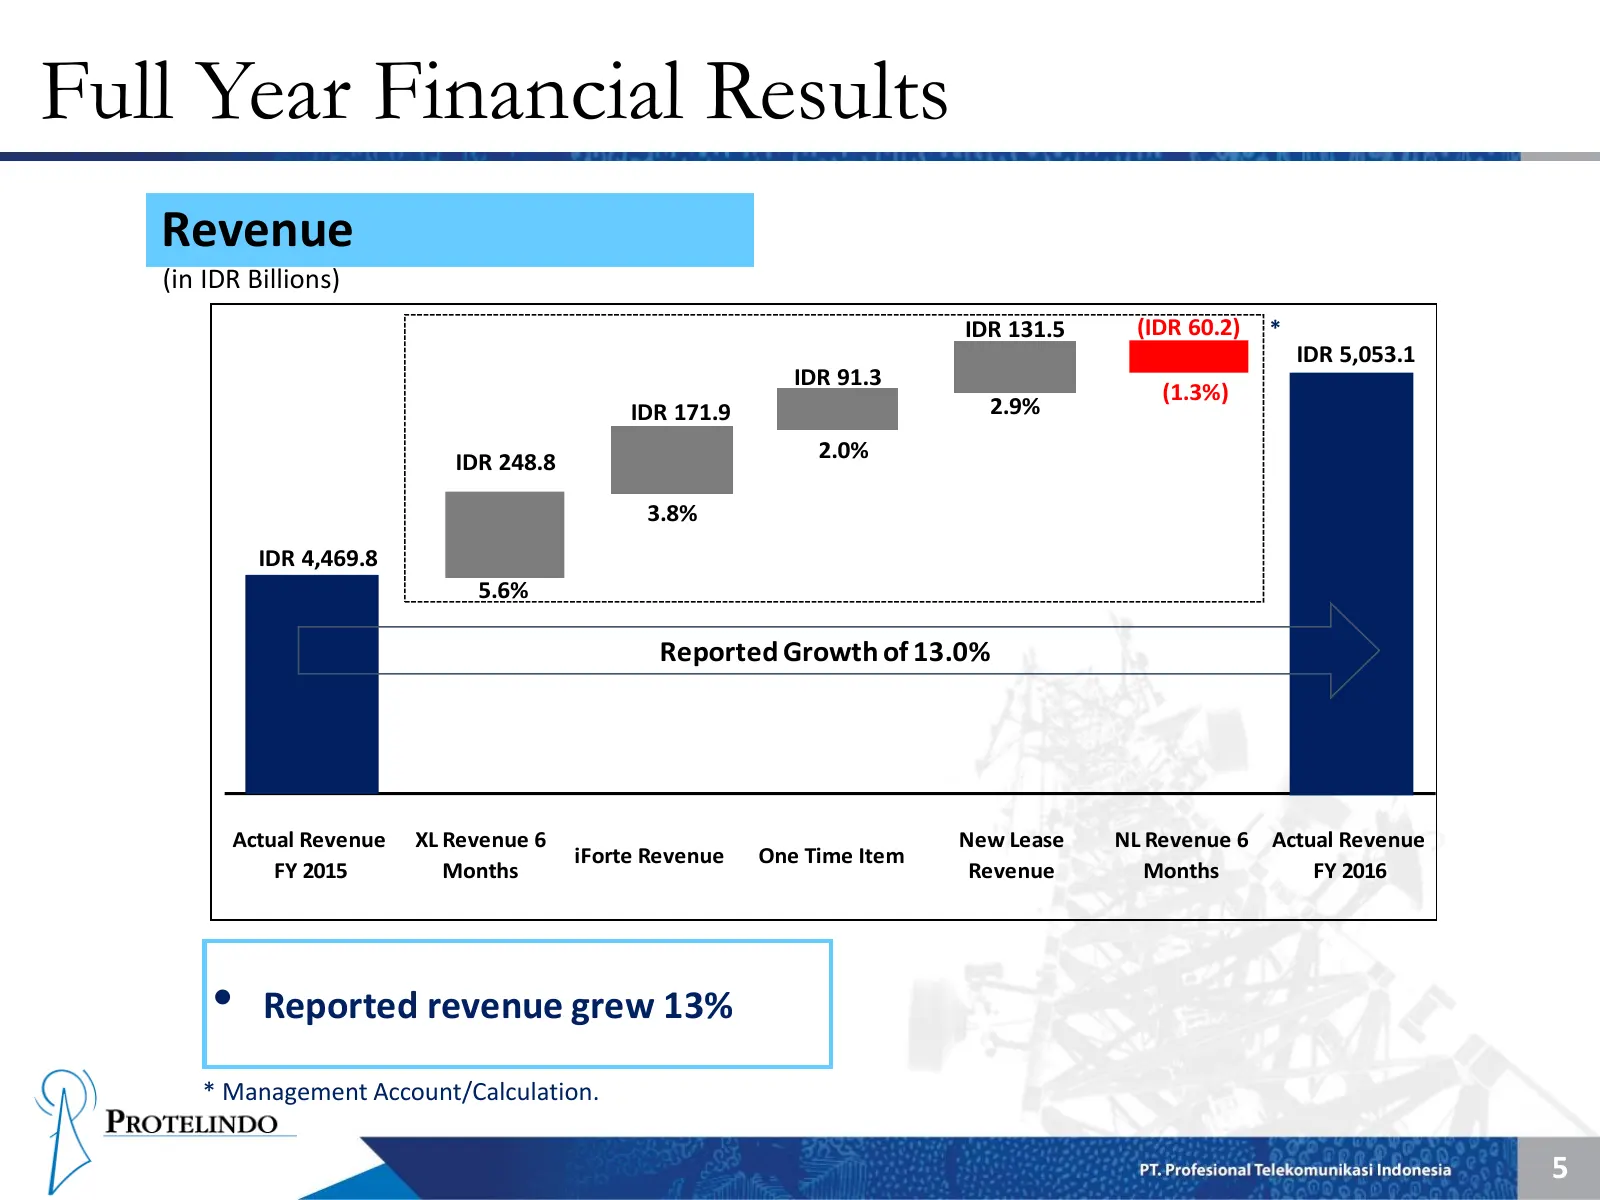
Full Year Financial Results Revenue (in IDR Billions) IDR 131.5 (IDR 60.2) * IDR 5,053.1 IDR 91.3 (1.3%) IDR 171.9 2.9% IDR 248.8 2.0% 3.8% IDR 4,469.8 5.6% Reported Growth of 13.0% Actual Revenue XL Revenue 6 New Lease NL Revenue 6 Actual Revenue iForte Revenue One Time Item FY 2015 Months Revenue
Slide 7: Full Year Financial Results: EBITDA
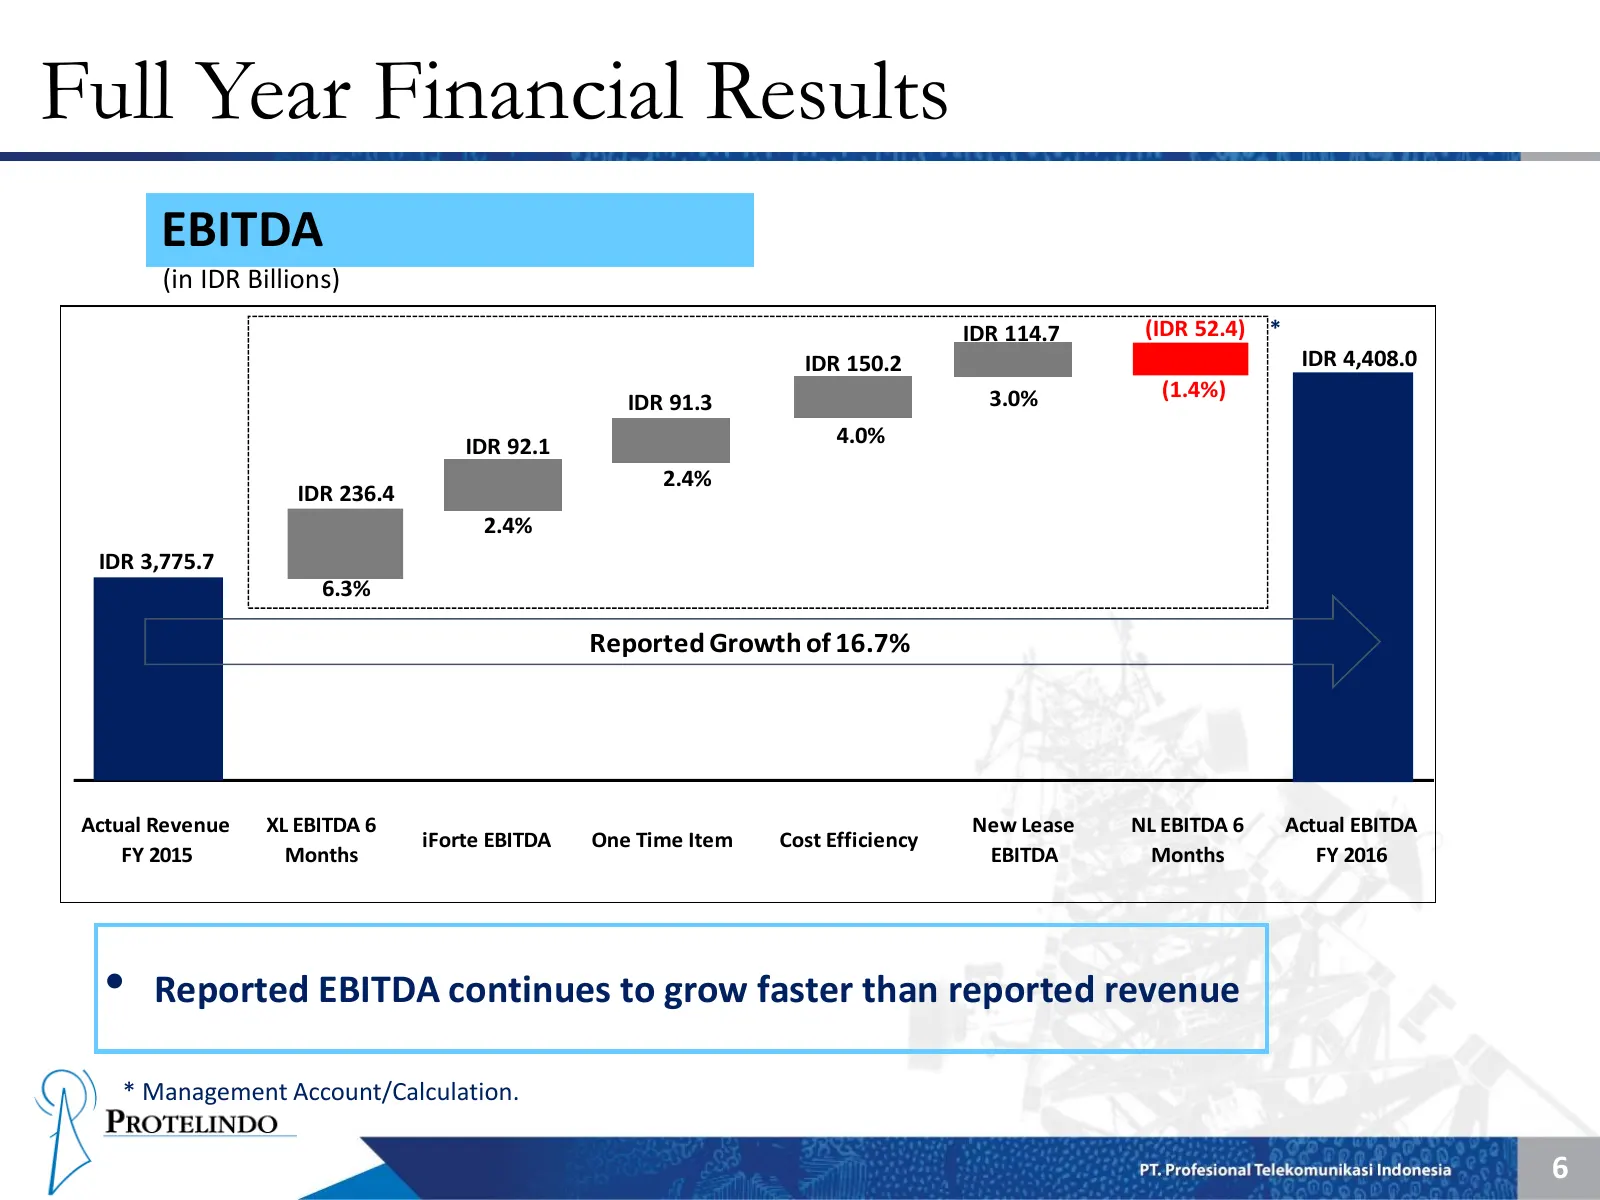
Full Year Financial Results EBITDA (in IDR Billions) IDR 114.7 (IDR 52.4) * IDR 150.2 IDR 4,408.0 3.0% (1.4%) IDR 91.3 IDR 92.1 4.0% 2.4% IDR 236.4 2.4% IDR 3,775.7 6.3% Reported Growth of 16.7% Actual Revenue XL EBITDA 6 New Lease NL EBITDA 6 Actual EBITDA iForte EBITDA One Time Item Cost Efficienc
Slide 8: 4Q 2016 Financial Results: Revenue
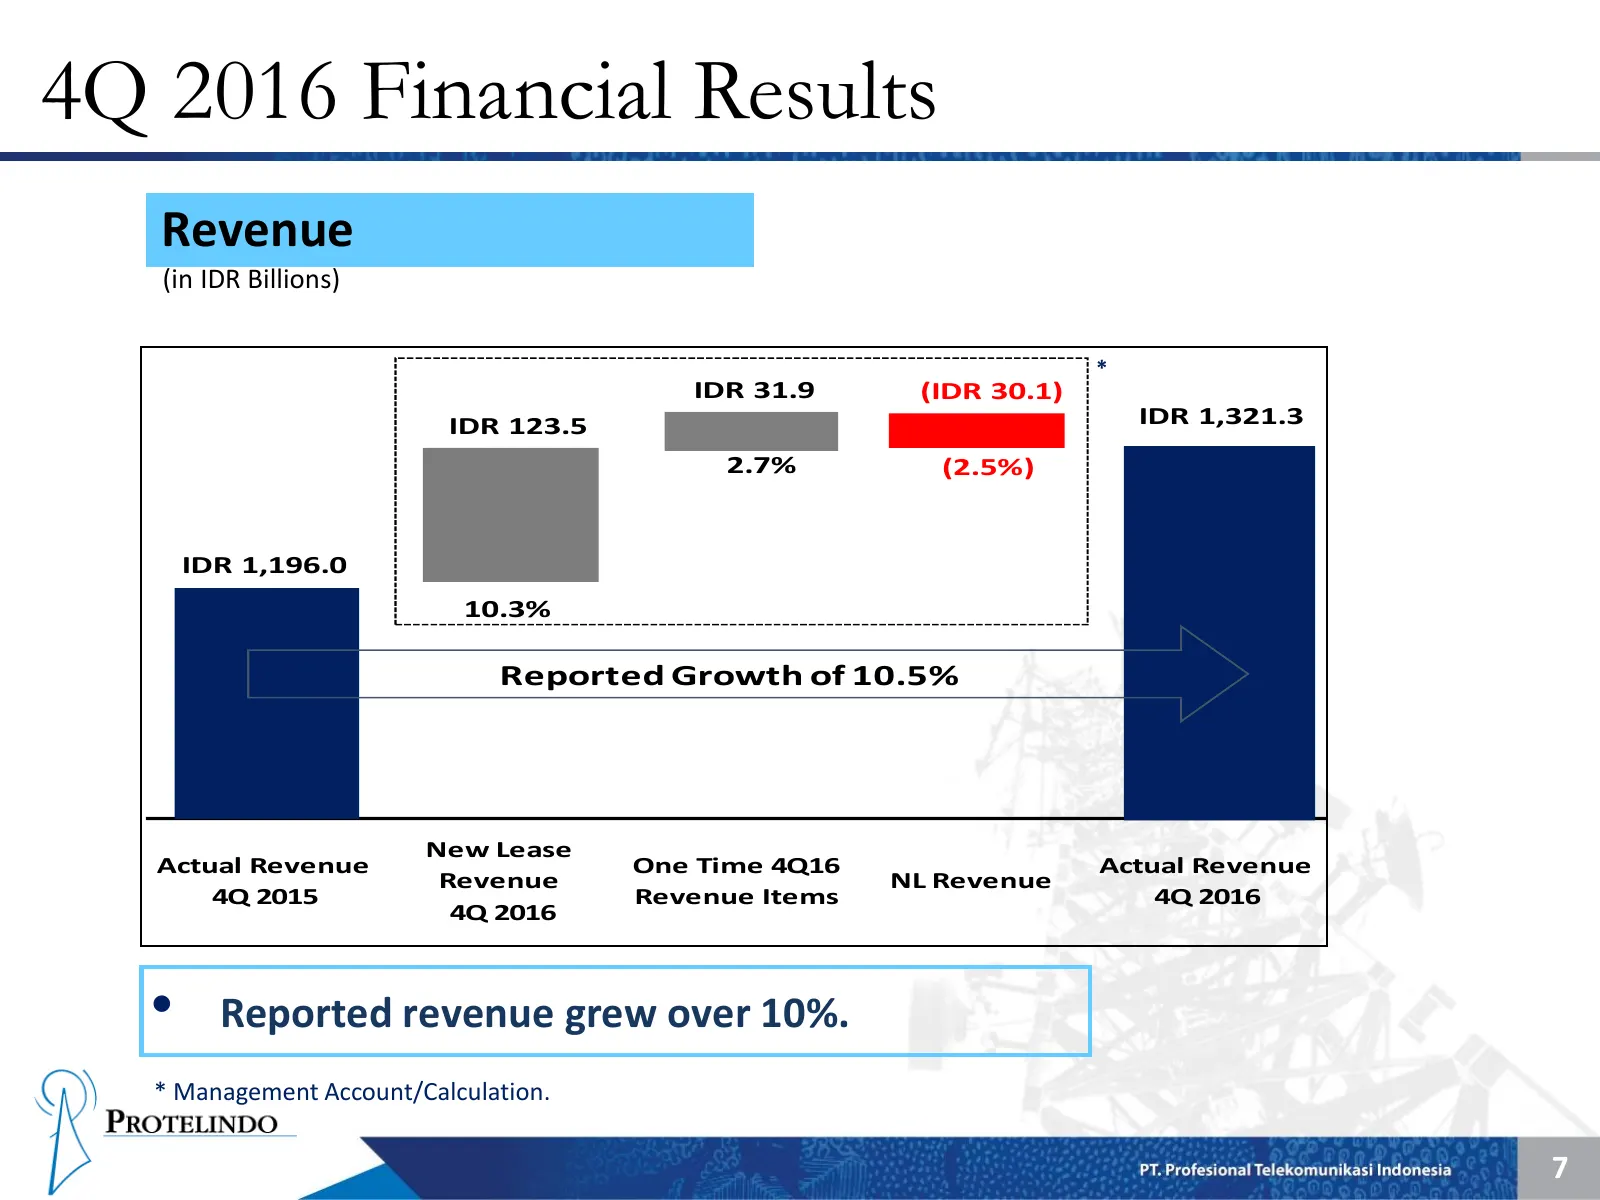
4Q 2016 Financial Results Revenue (in IDR Billions) * IDR 31.9 (IDR 30.1) IDR 123.5 IDR 1,321.3 2.7% (2.5%) IDR 1,196.0 10.3% Reported Growth of 10.5% New Lease Actual Revenue One Time 4Q16 Actual Revenue Revenue NL Revenue 4Q 2015 Revenue Items 4Q 2016 4Q 2016 • Reported revenue grew over 10%. * Ma
Slide 9: 4Q 2016 Financial Results: EBITDA
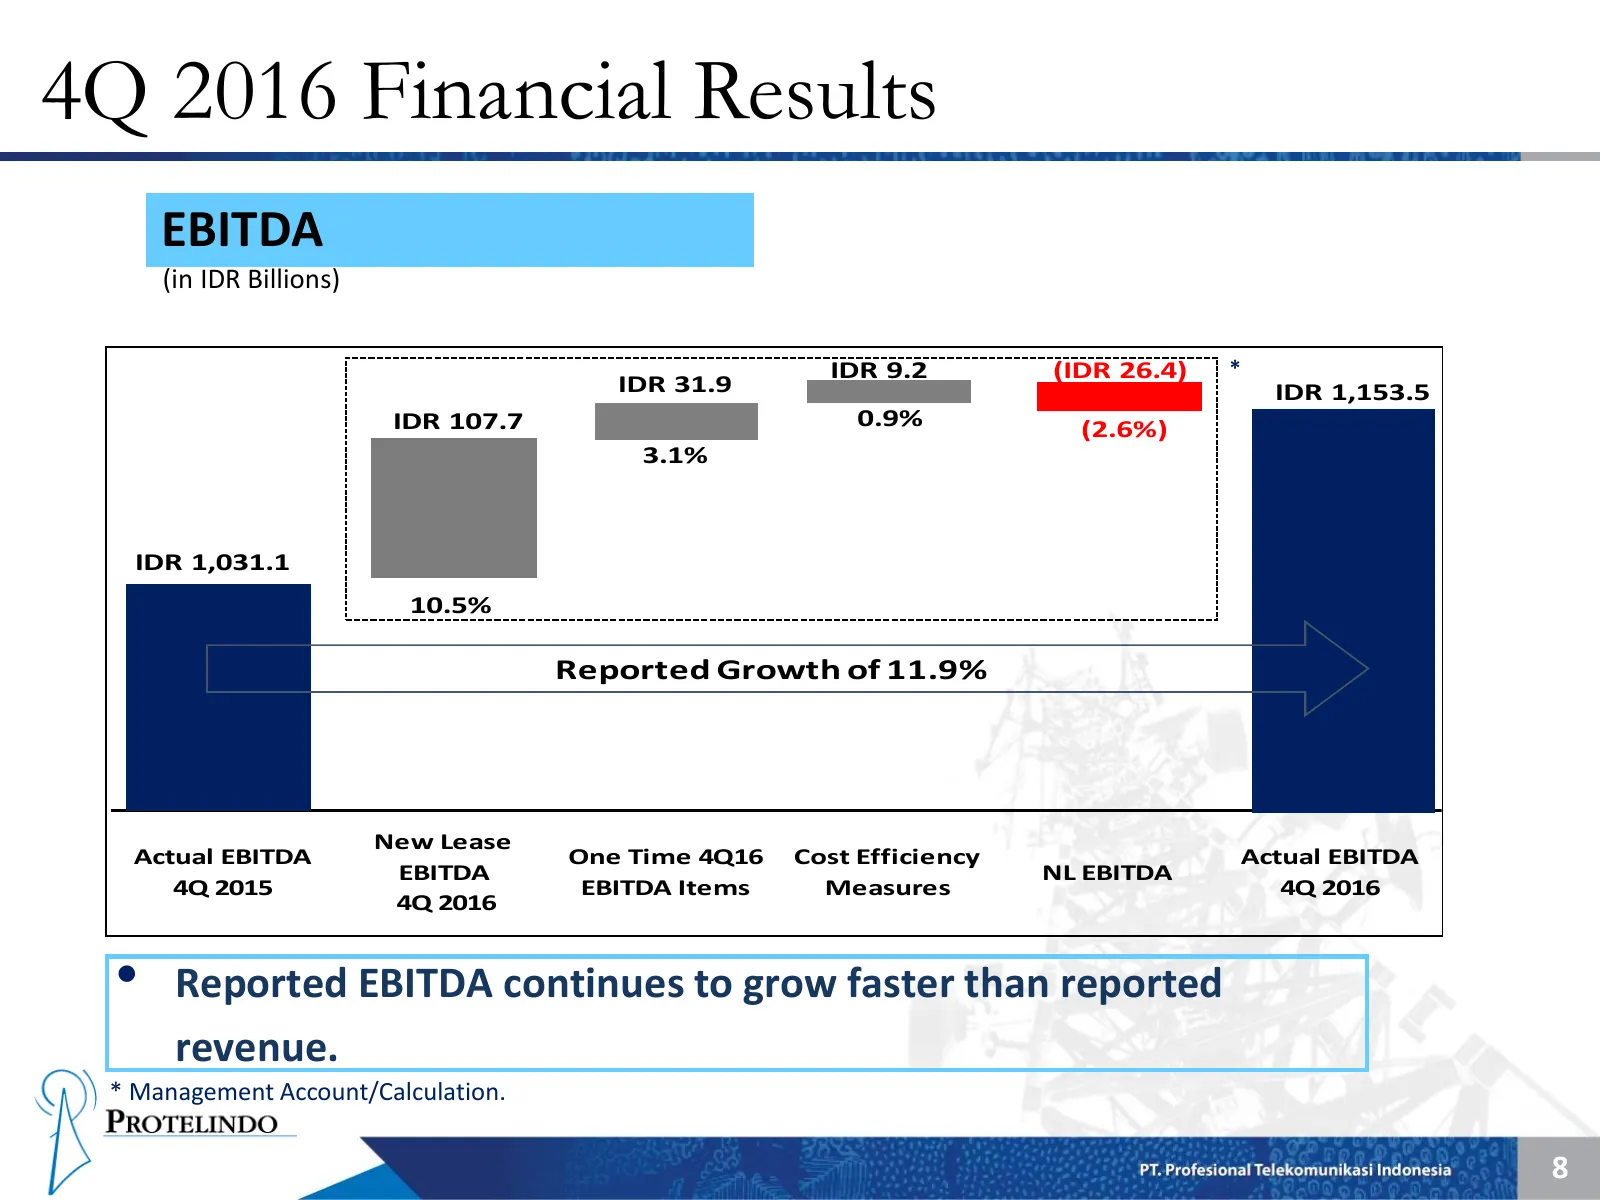
4Q 2016 Financial Results EBITDA (in IDR Billions) IDR 9.2 (IDR 26.4) * IDR 31.9 IDR 1,153.5 IDR 107.7 0.9% (2.6%) 3.1% IDR 1,031.1 10.5% Reported Growth of 11.9% New Lease Actual EBITDA One Time 4Q16 Cost Efficiency Actual EBITDA EBITDA NL EBITDA 4Q 2015 EBITDA Items Measures 4Q 2016 4Q 2016 • Repo
Slide 10: Tower and Tenant Growth: Towers
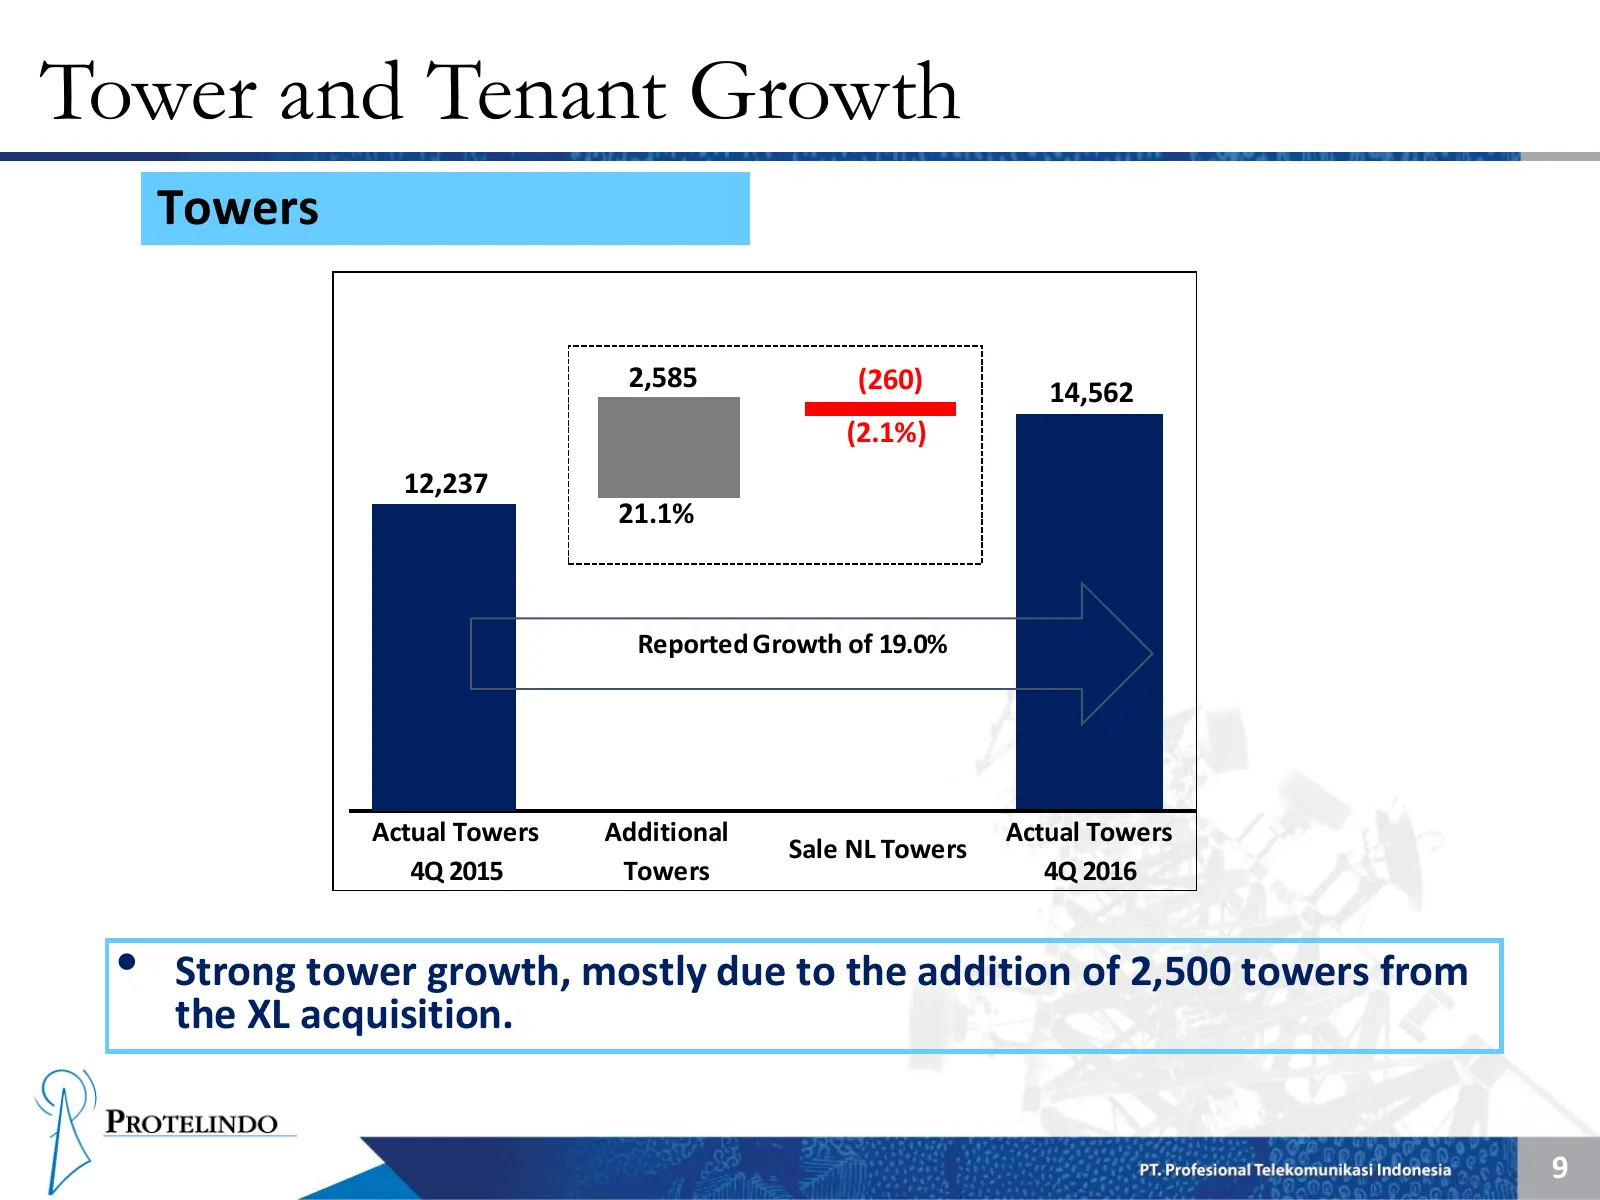
Tower and Tenant Growth Towers 2,585 (260) 14,562 (2.1%) 12,237 21.1% Reported Growth of 19.0% Actual Towers Additional Actual Towers Sale NL Towers 4Q 2015 Towers 4Q 2016 • Strong tower growth, mostly due to the addition of 2,500 towers from the XL acquisition. 9
Slide 11: Tower and Tenant Growth: Tenants
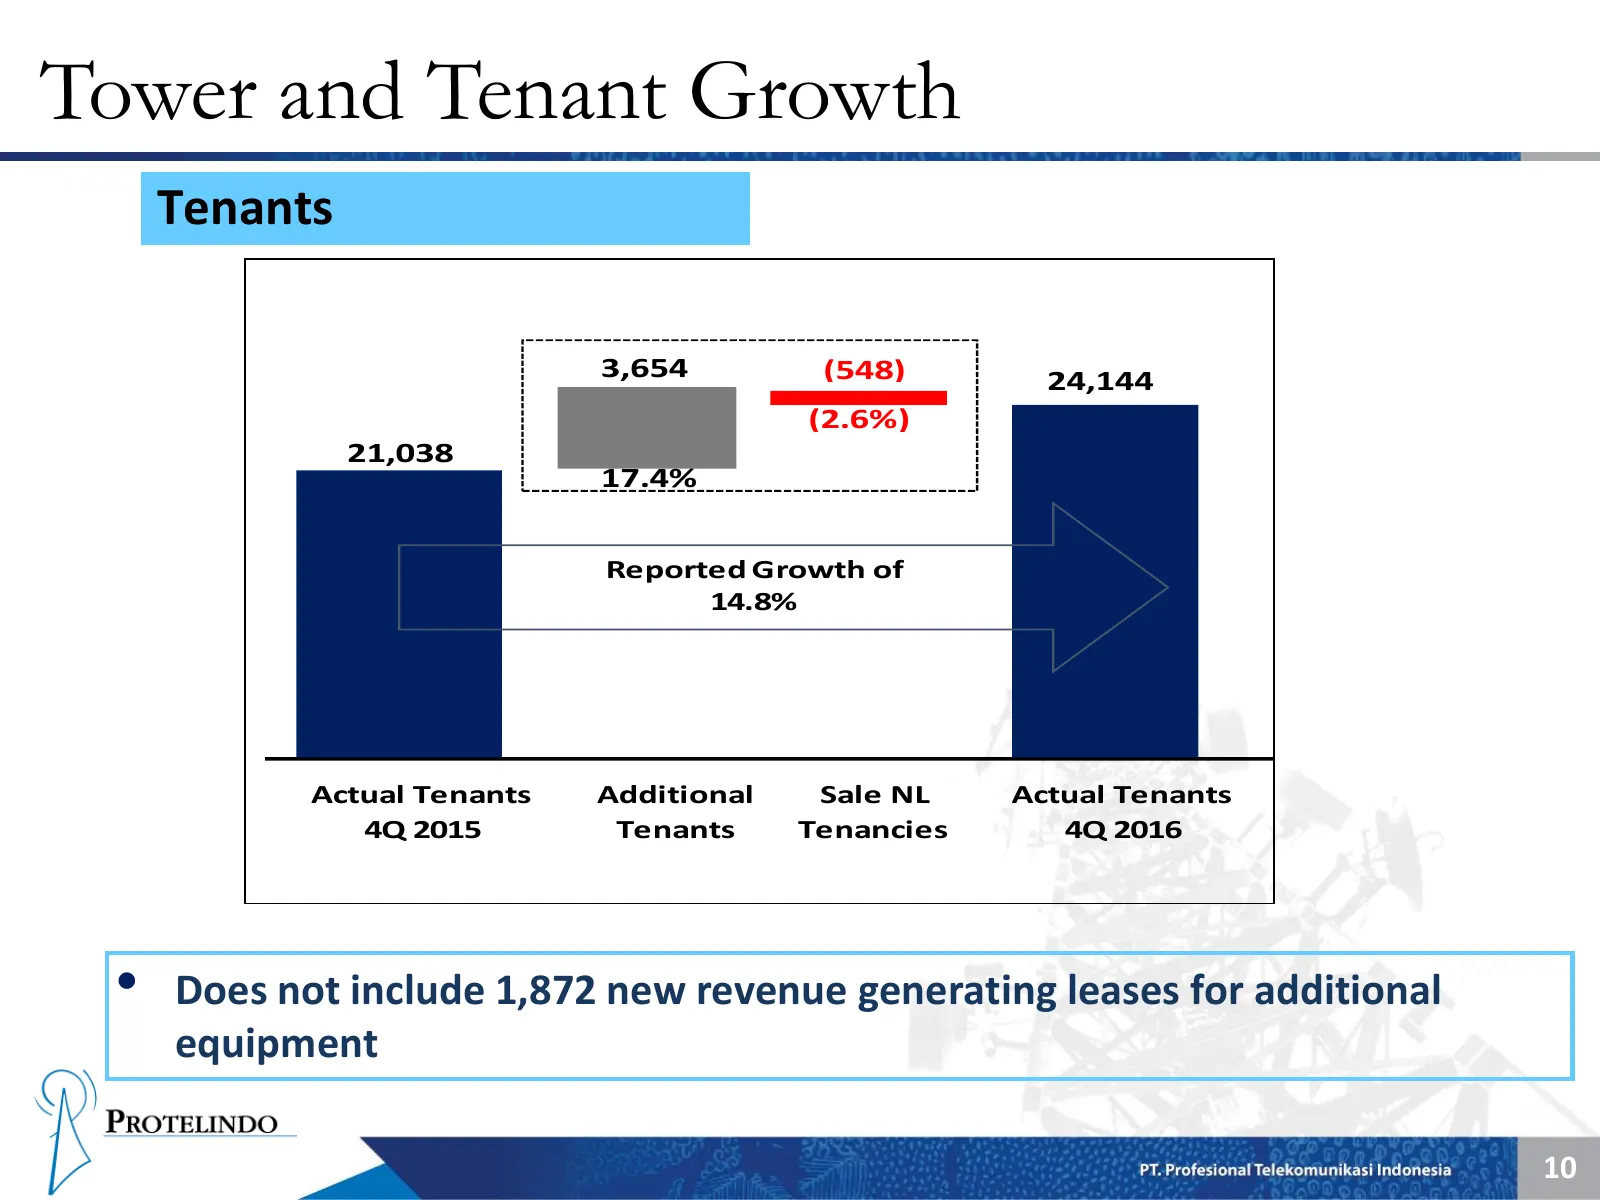
Tower and Tenant Growth Tenants 3,654 (548) 24,144 (2.6%) 21,038 17.4% Reported Growth of 14.8% Actual Tenants Additional Sale NL Actual Tenants 4Q 2015 Tenants Tenancies 4Q 2016 • Does not include 1,872 new revenue generating leases for additional equipment 10
Slide 12: Debt Profile
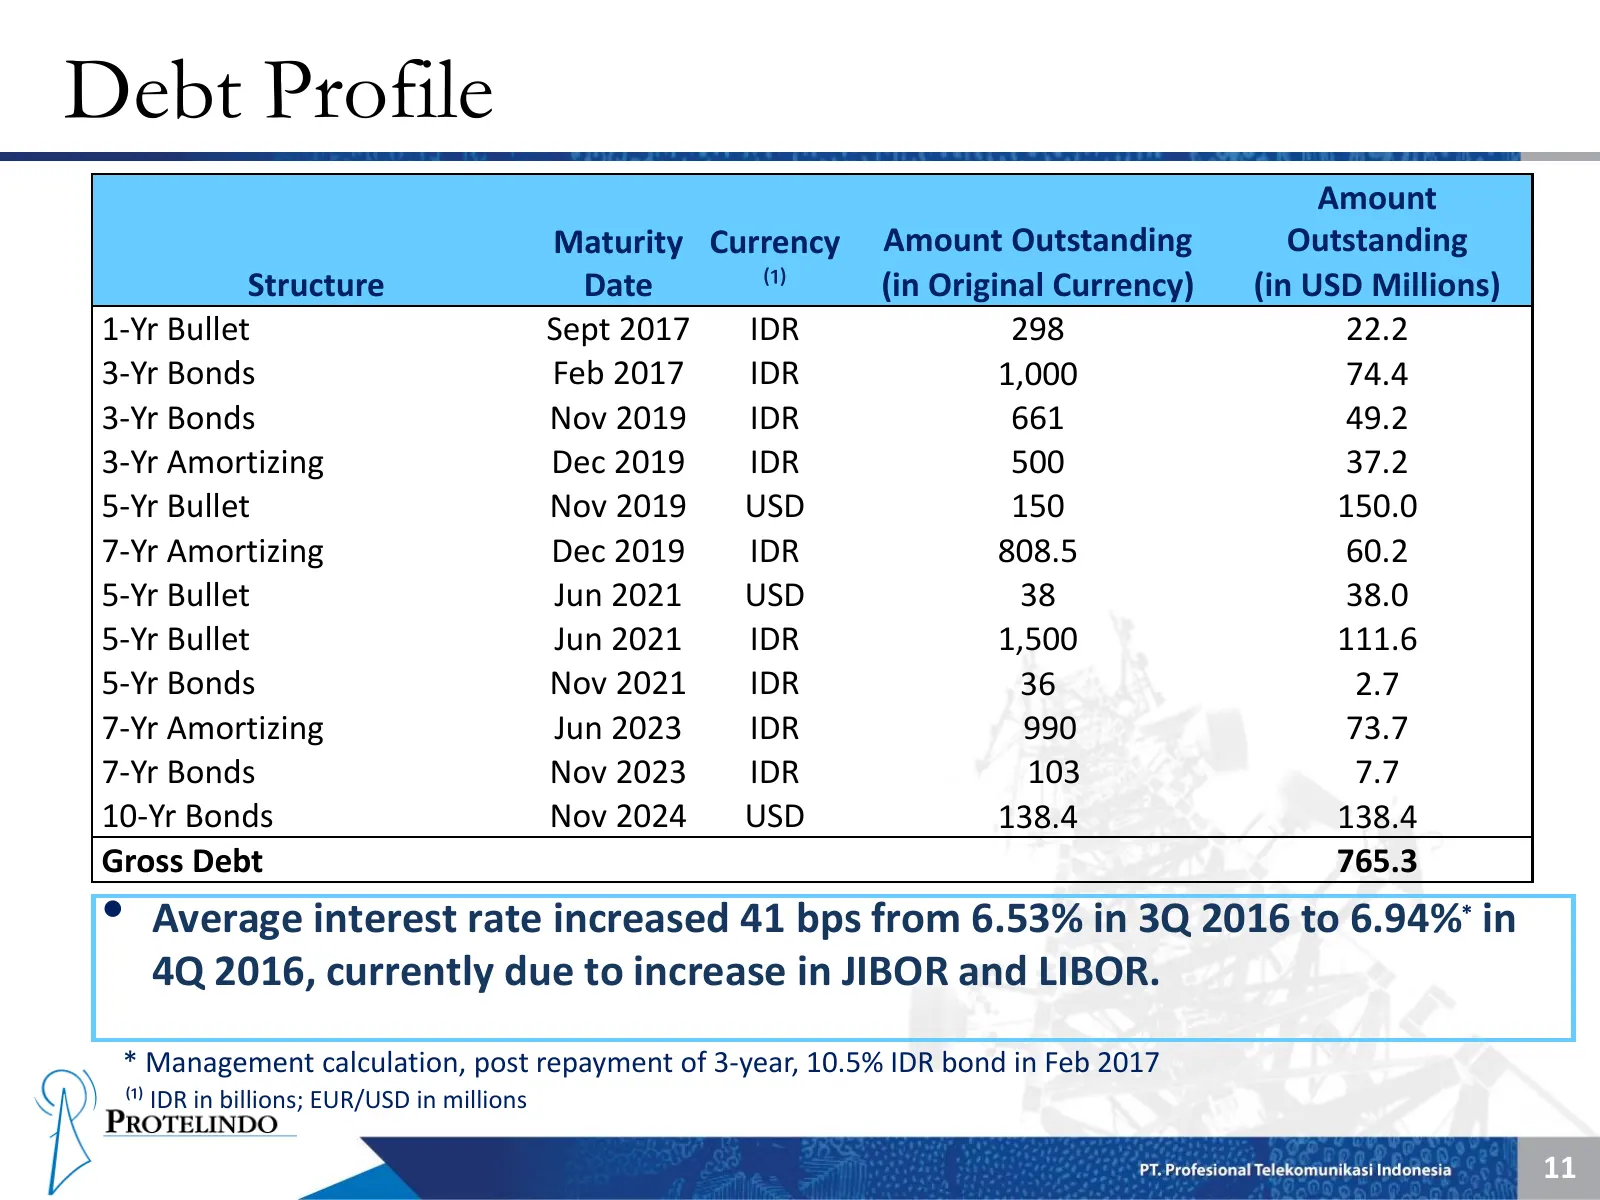
Debt Profile Amount Maturity Currency Amount Outstanding Outstanding Structure Date ⁽¹⁾ (in Original Currency) (in USD Millions) 1-Yr Bullet Sept 2017 IDR 298 22.2 3-Yr Bonds Feb 2017 IDR 1,000 74.4 3-Yr Bonds Nov 2019 IDR 661 49.2 3-Yr Amortizing Dec 2019 IDR 500 37.2 5-Yr Bullet Nov 2019 USD 150 1
Source: Internet Archive copy of ptsmn.co.id
More decks from PT Sarana Menara Nusantara Tbk
 Q2 2026 Earnings Presentation25 slides · Aug 14, 2026
 Q1 2026 Earnings Presentation25 slides · Jun 3, 2026
 Q4 2025 Earnings Presentation24 slides · Apr 6, 2026
 Q2 2023 Earnings Presentation26 slides · Sep 28, 2023
 Q1 2023 Earnings Presentation26 slides · May 2023
 FY2022 Earnings Presentation26 slides · Apr 6, 2023