SGL Carbon SE · XETR:SGL
SGL Carbon — SGL Group — FY2012 Earnings Presentation
29 slides from SGL Carbon's earnings presentation, Mar 14, 2013
Slide 1: Year End Analyst Meeting
Year End Analyst Meeting Frankfurt March 14, 2013 Presentation Analyst Meeting 2012
Slide 2: Consistent development and strategic direction
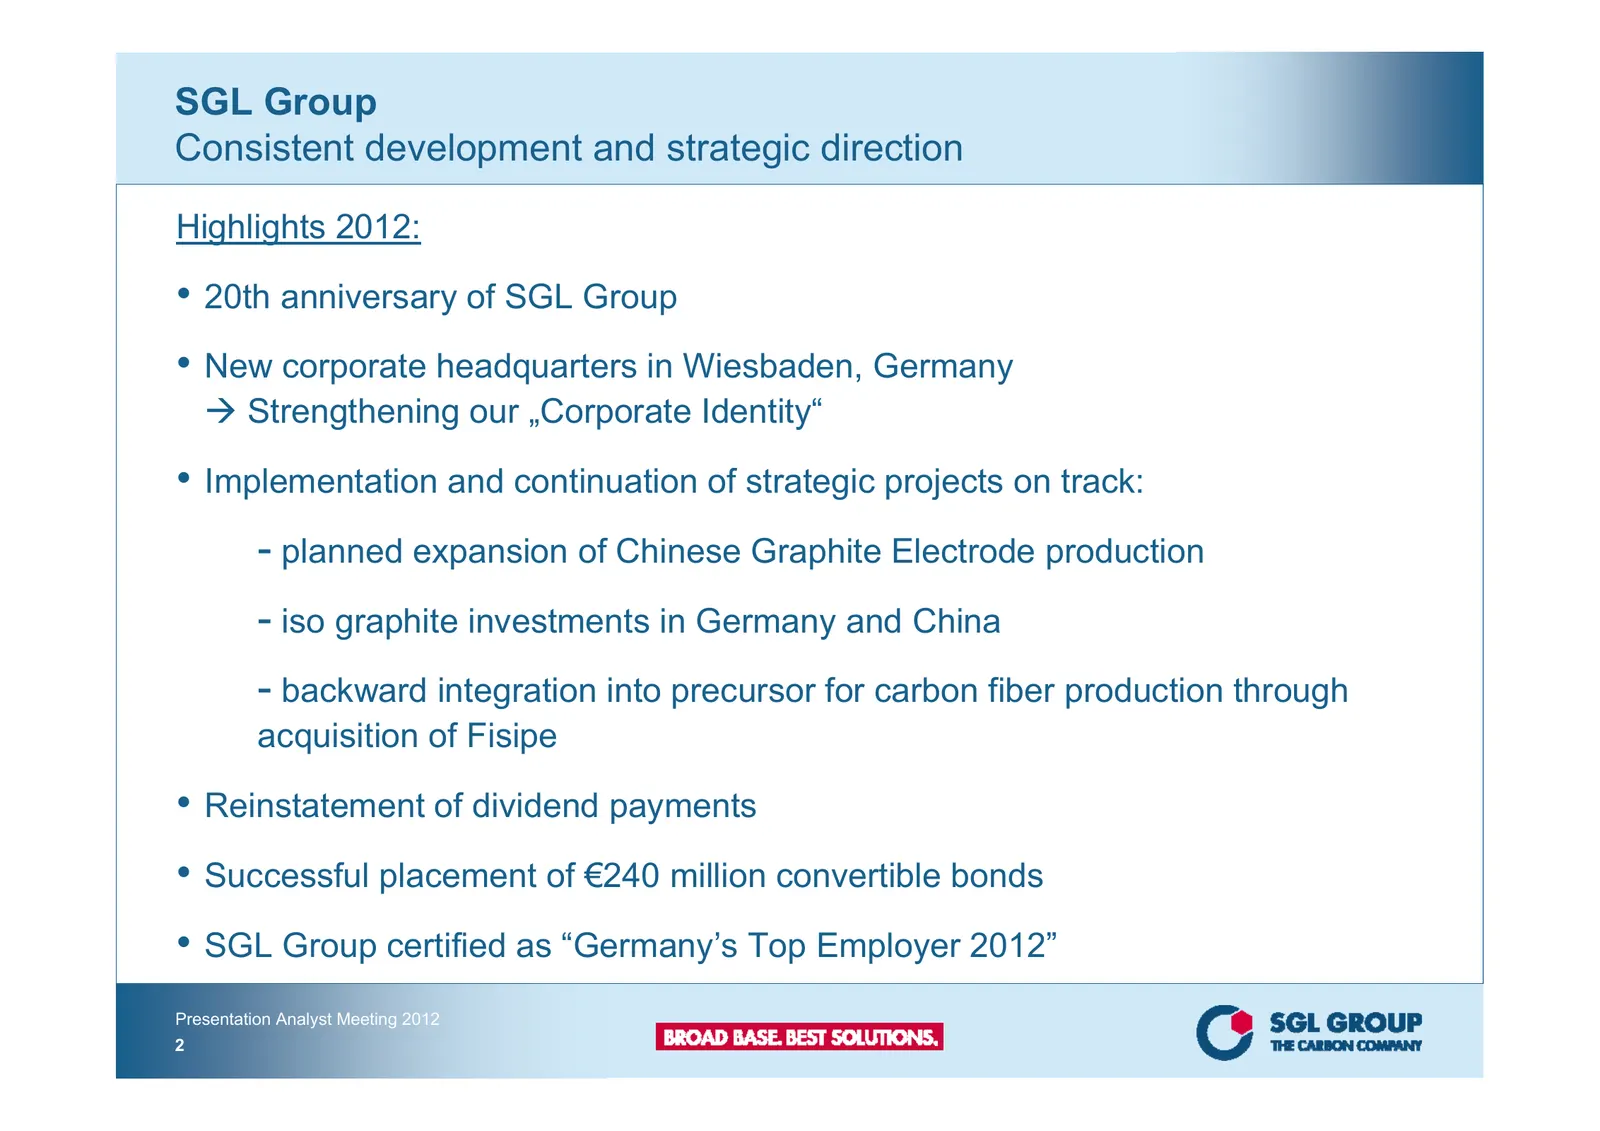
SGL Group Consistent development and strategic direction Highlights 2012: • 20th anniversary of SGL Group • New corporate headquarters in Wiesbaden, Germany Strengthening our „Corporate Identity“ • Implementation and continuation of strategic projects on track: - planned expansion of Chinese Graph
Slide 3: Stable dividend proposal to the AGM in April 2013
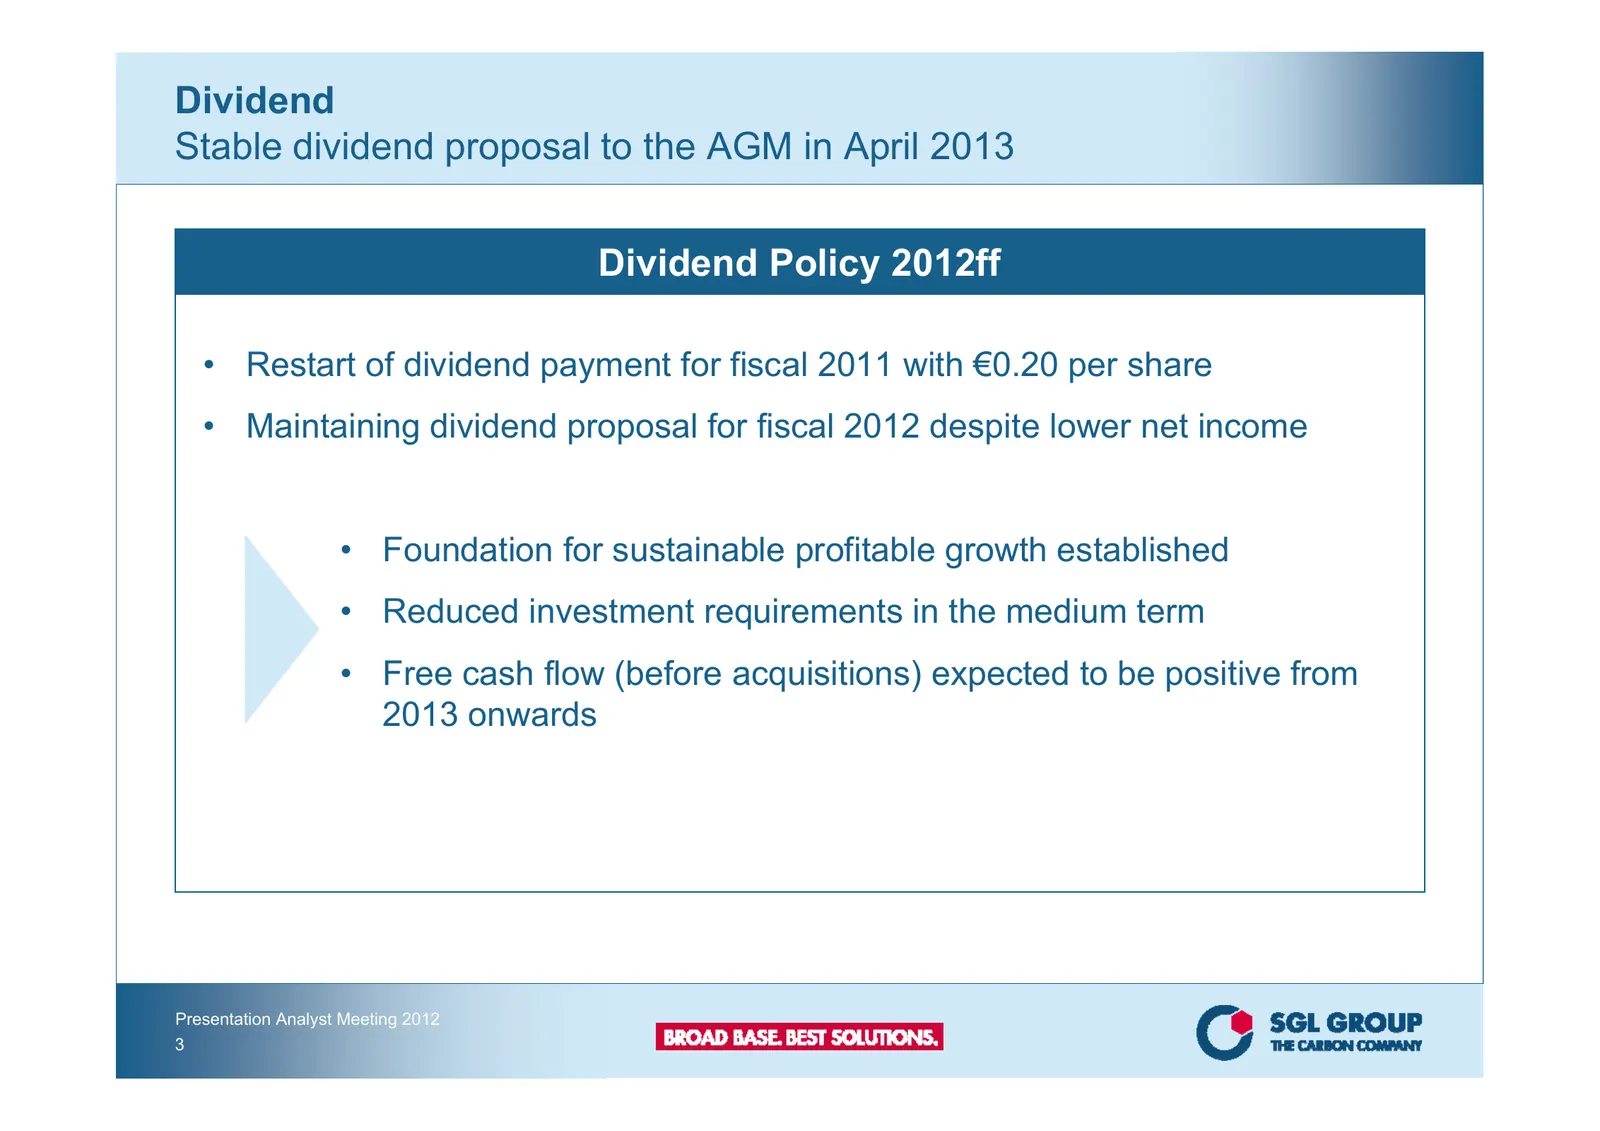
Dividend Stable dividend proposal to the AGM in April 2013 Dividend Policy 2012ff • Restart of dividend payment for fiscal 2011 with €0.20 per share • Maintaining dividend proposal for fiscal 2012 despite lower net income • Foundation for sustainable profitable growth established • Reduced investmen
Slide 4: 2012 Financials
2012 Financials Presentation Analyst Meeting 2012
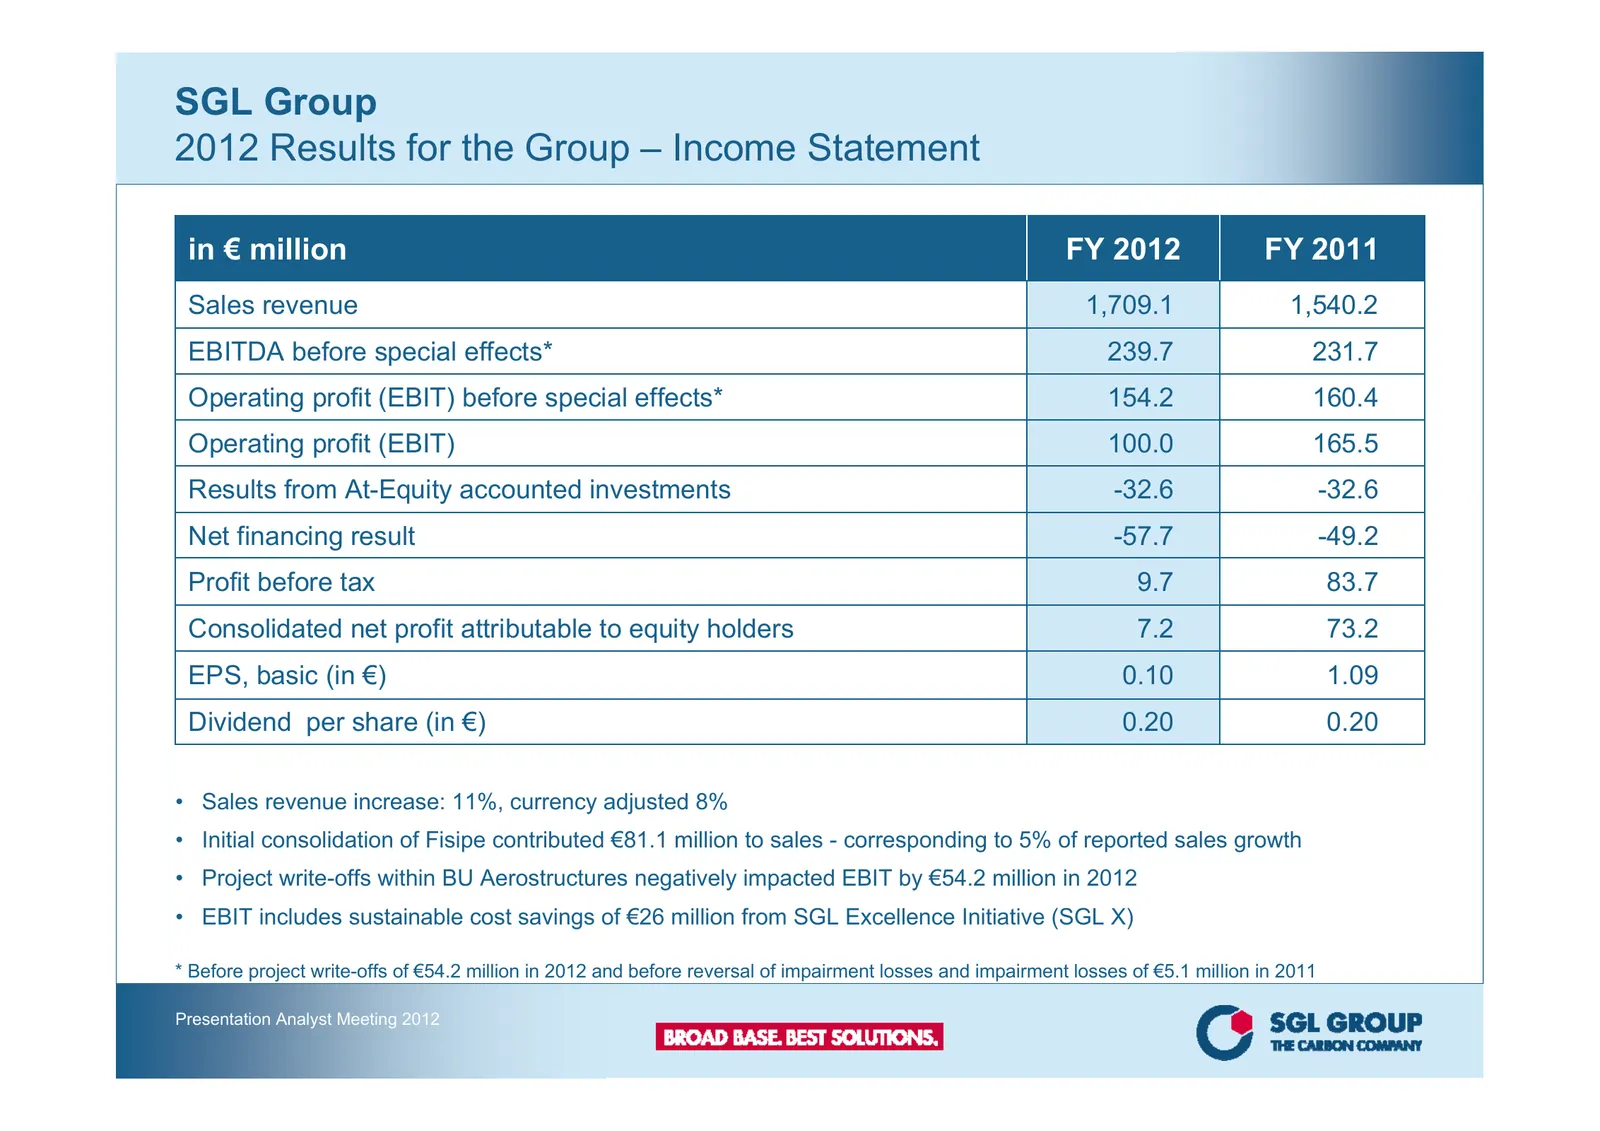
Slide 5: 2012 Results for the Group – Income Statement
SGL Group 2012 Results for the Group – Income Statement in € million FY 2012 FY 2011 Sales revenue 1,709.1 1,540.2 EBITDA before special effects* 239.7 231.7 Operating profit (EBIT) before special effects* 154.2 160.4 Operating profit (EBIT) 100.0 165.5 Results from At-Equity accounted investments -
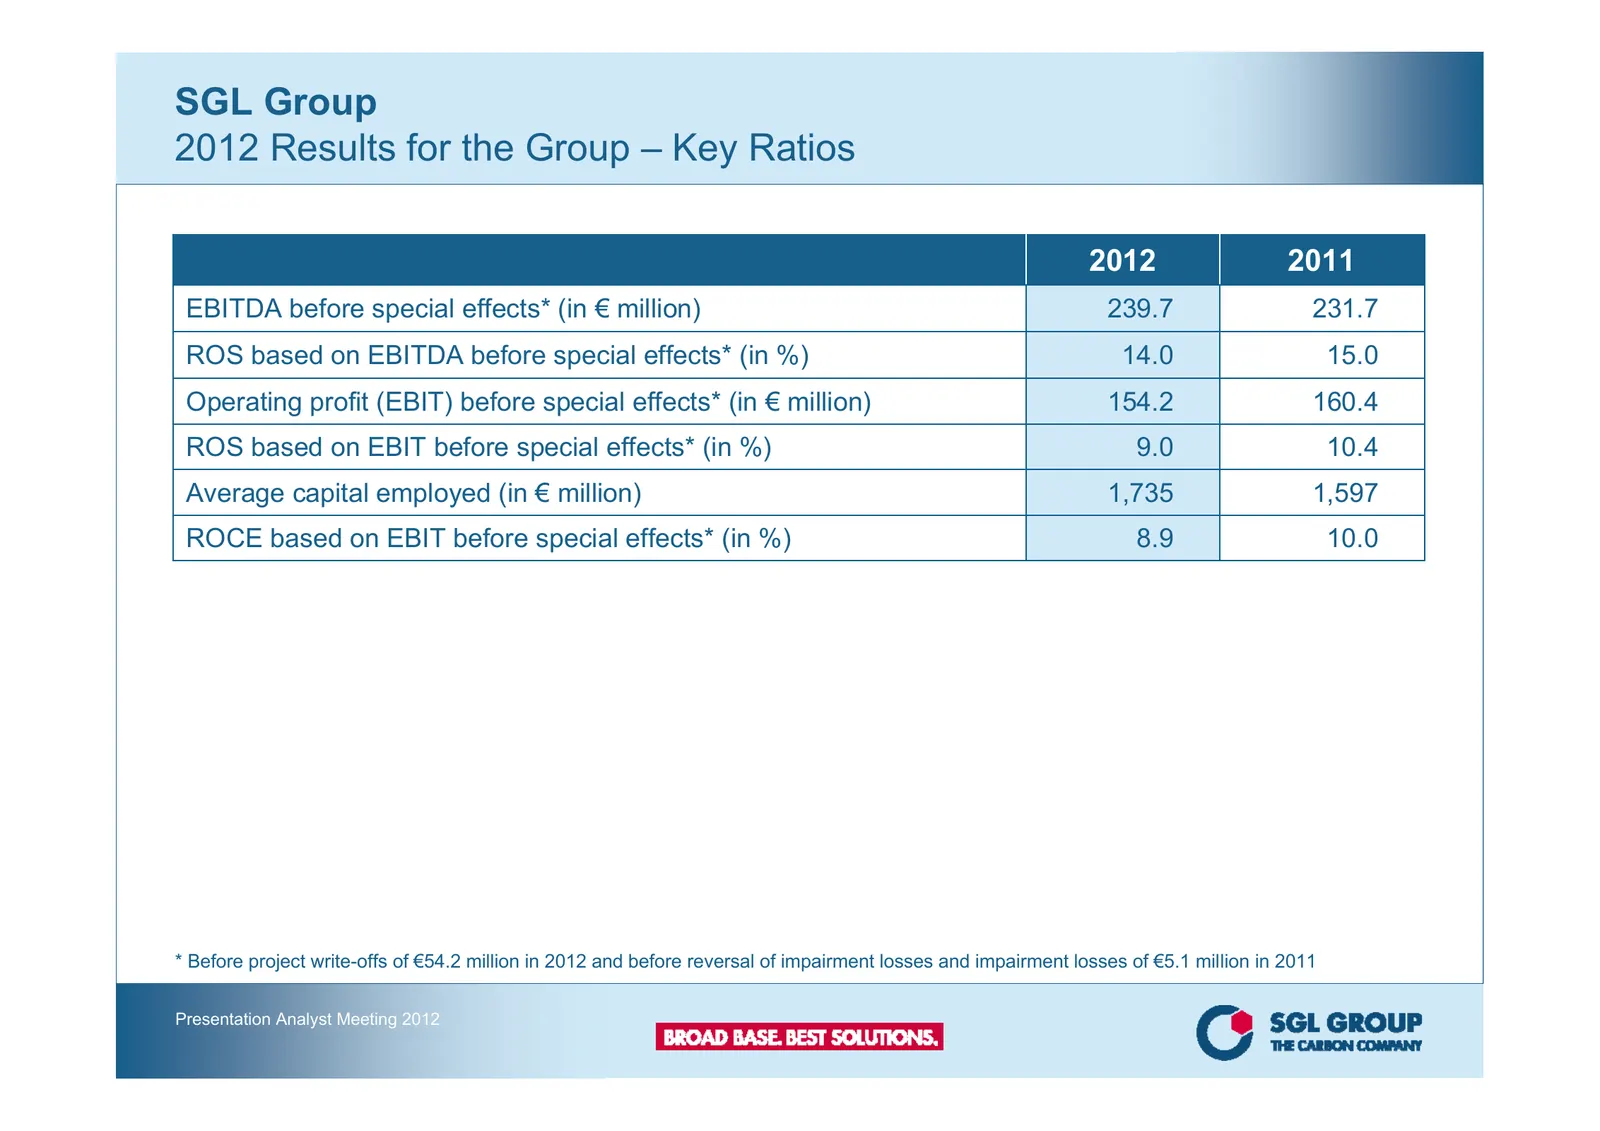
Slide 6: 2012 Results for the Group – Key Ratios
SGL Group 2012 Results for the Group – Key Ratios 2012 2011 EBITDA before special effects* (in € million) 239.7 231.7 ROS based on EBITDA before special effects* (in %) 14.0 15.0 Operating profit (EBIT) before special effects* (in € million) 154.2 160.4 ROS based on EBIT before special effects* (in
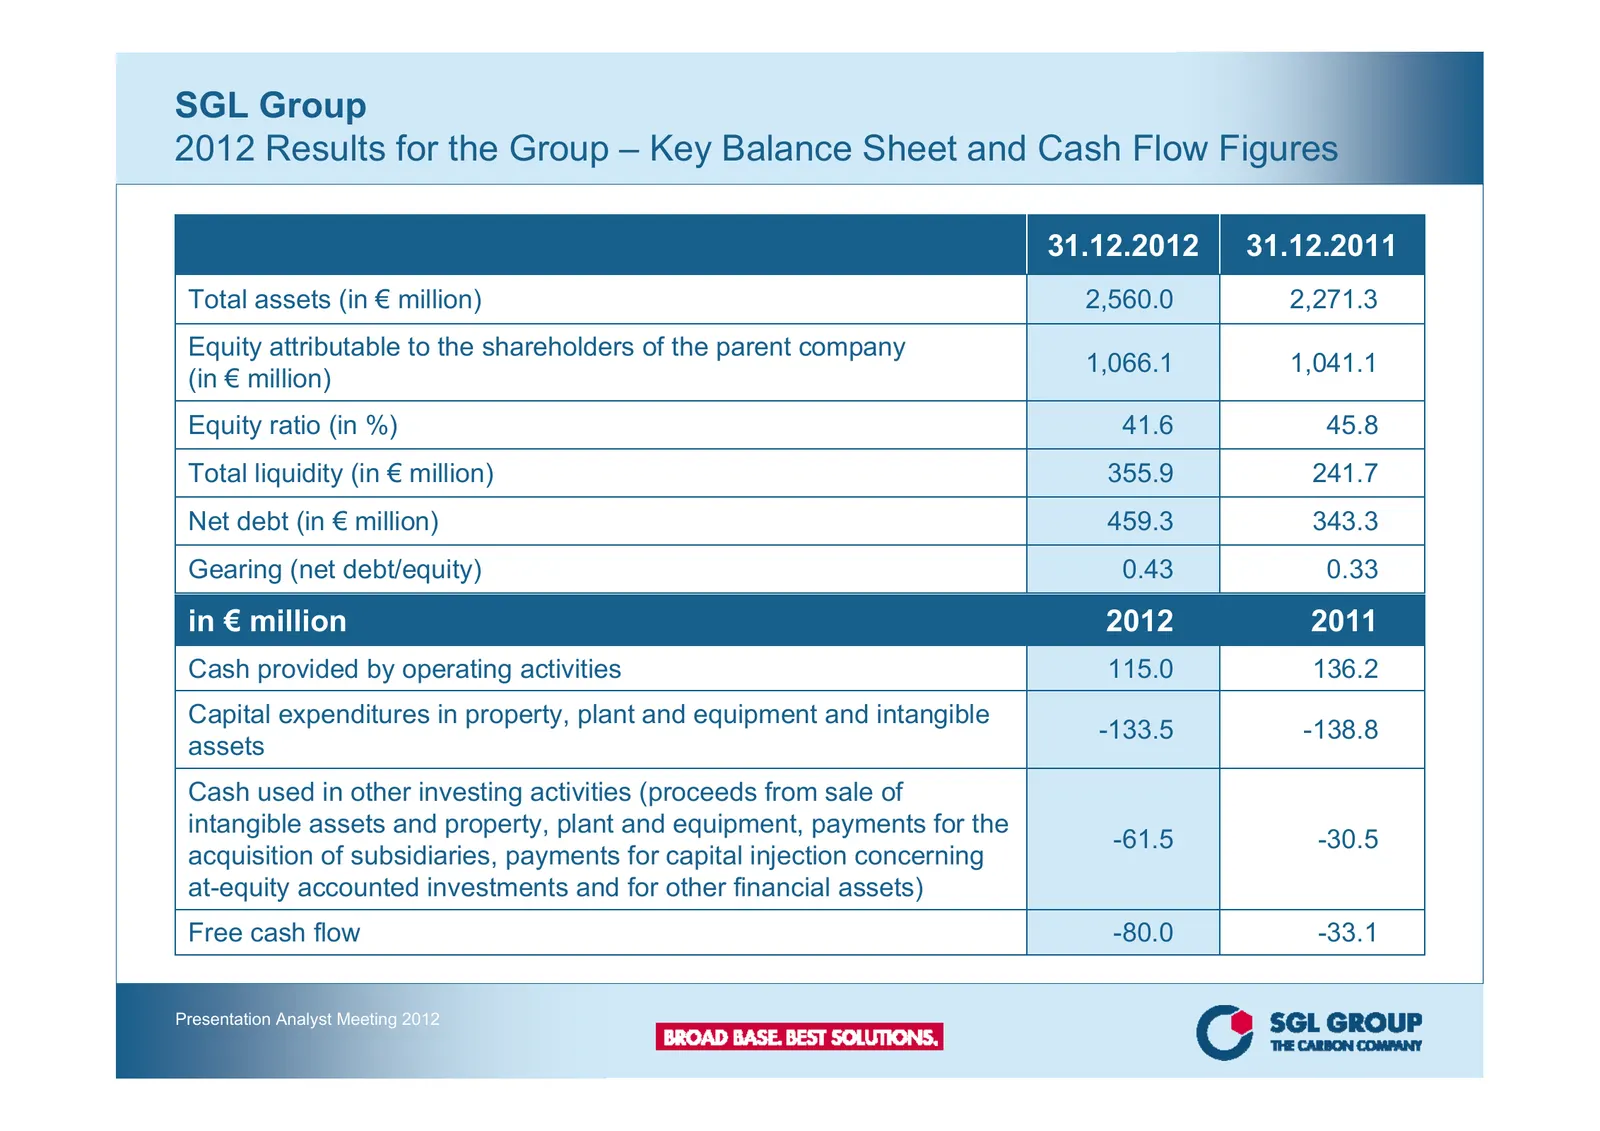
Slide 7: 2012 Results for the Group – Key Balance Sheet and Cash Flow Figures
SGL Group 2012 Results for the Group – Key Balance Sheet and Cash Flow Figures 31.12.2012 31.12.2011 Total assets (in € million) 2,560.0 2,271.3 Equity attributable to the shareholders of the parent company 1,066.1 1,041.1 (in € million) Equity ratio (in %) 41.6 45.8 Total liquidity (in € million) 3
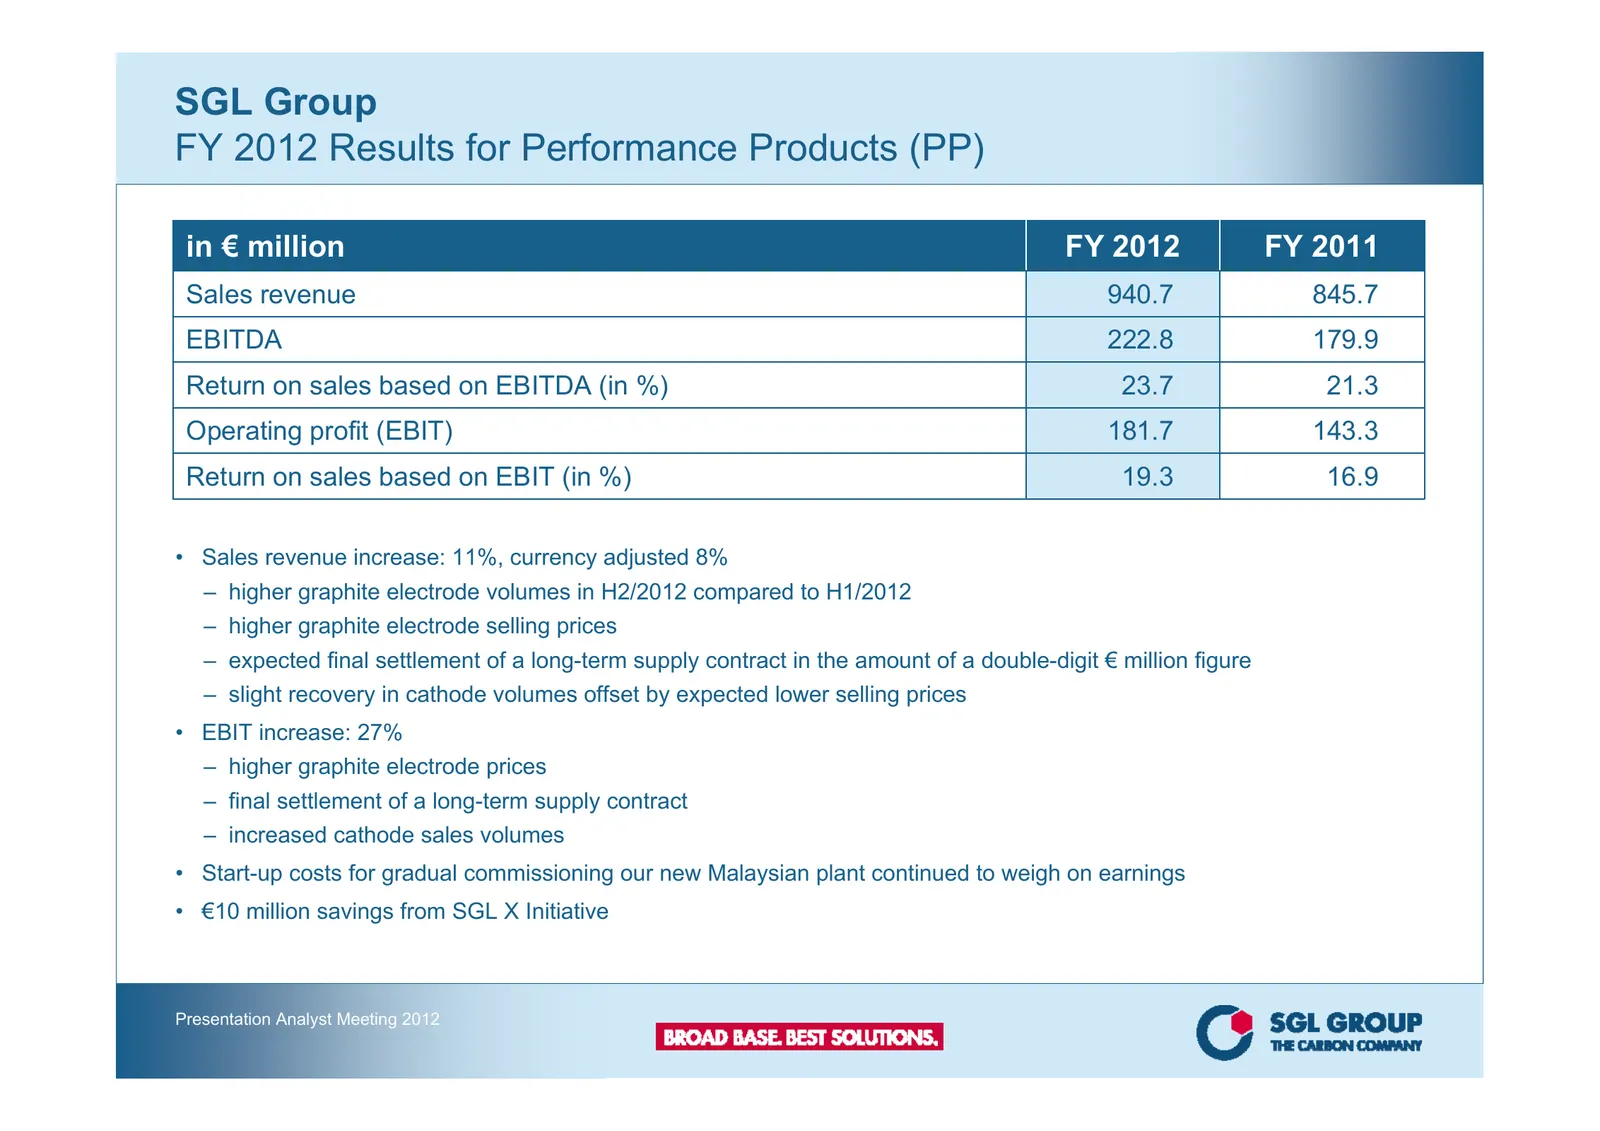
Slide 8: FY 2012 Results for Performance Products (PP)
SGL Group FY 2012 Results for Performance Products (PP) in € million FY 2012 FY 2011 Sales revenue 940.7 845.7 EBITDA 222.8 179.9 Return on sales based on EBITDA (in %) 23.7 21.3 Operating profit (EBIT) 181.7 143.3 Return on sales based on EBIT (in %) 19.3 16.9 • Sales revenue increase: 11%, currenc
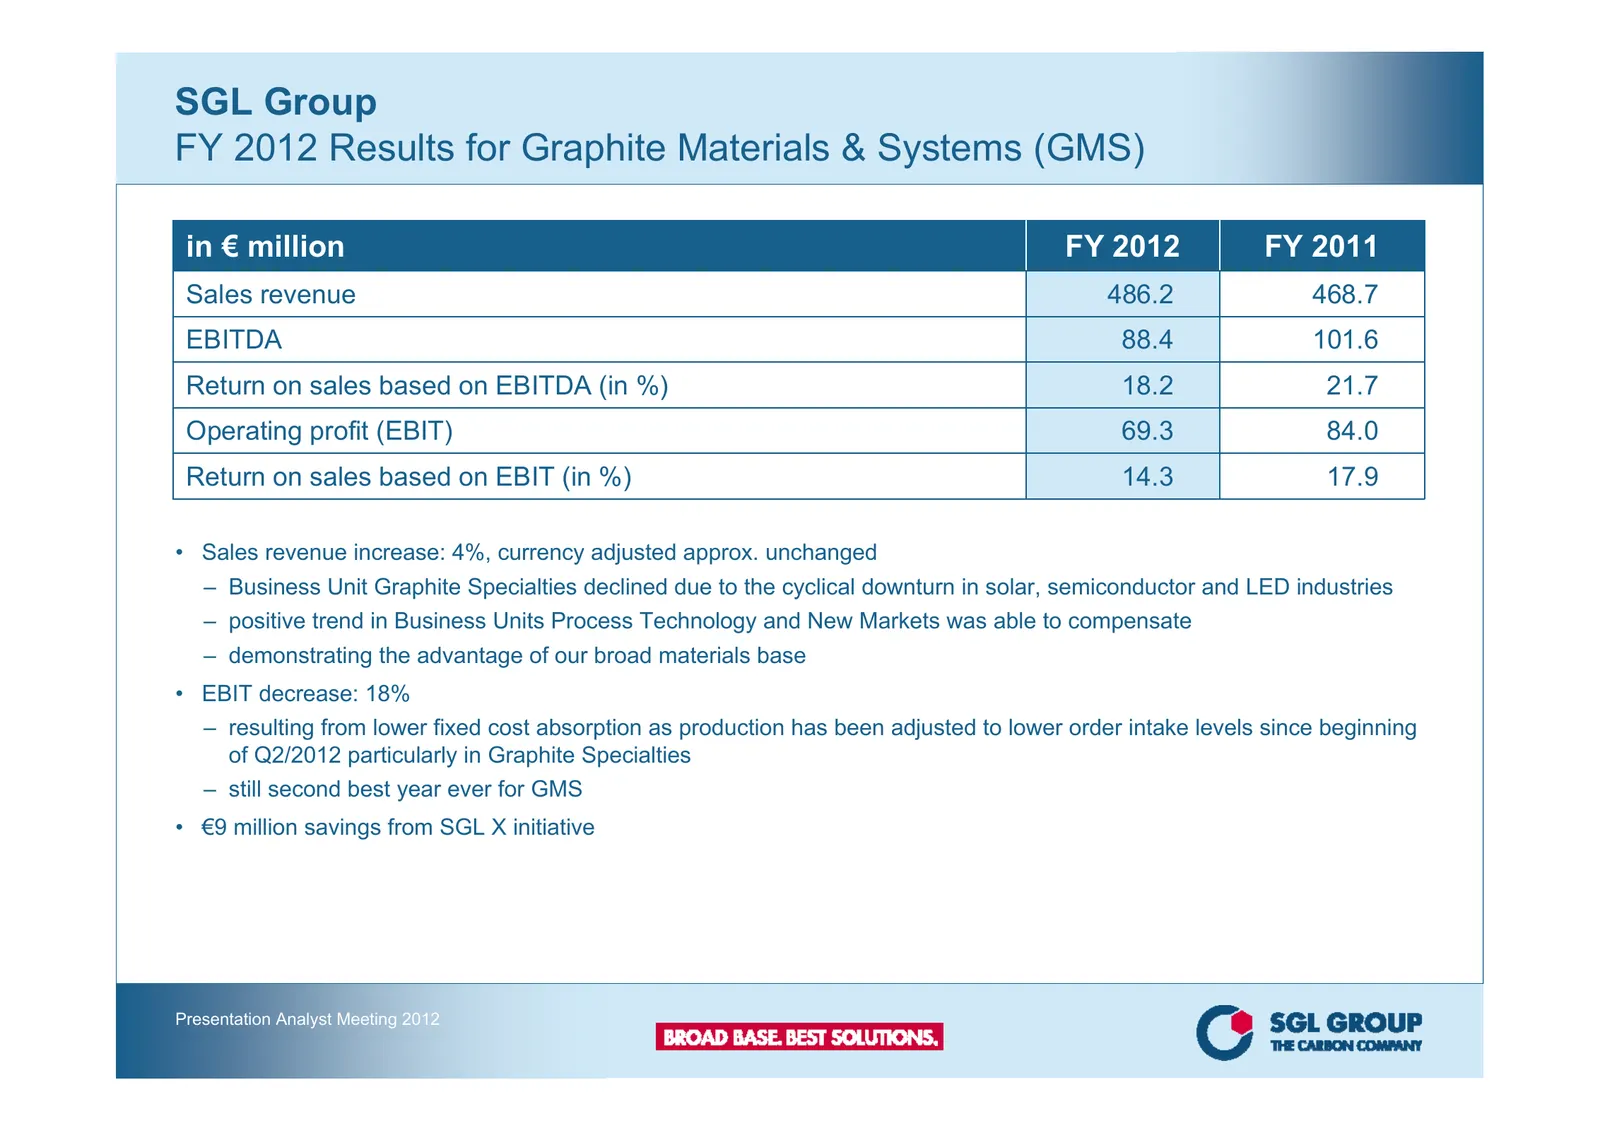
Slide 9: FY 2012 Results for Graphite Materials & Systems (GMS)
SGL Group FY 2012 Results for Graphite Materials & Systems (GMS) in € million FY 2012 FY 2011 Sales revenue 486.2 468.7 EBITDA 88.4 101.6 Return on sales based on EBITDA (in %) 18.2 21.7 Operating profit (EBIT) 69.3 84.0 Return on sales based on EBIT (in %) 14.3 17.9 • Sales revenue increase: 4%, cu
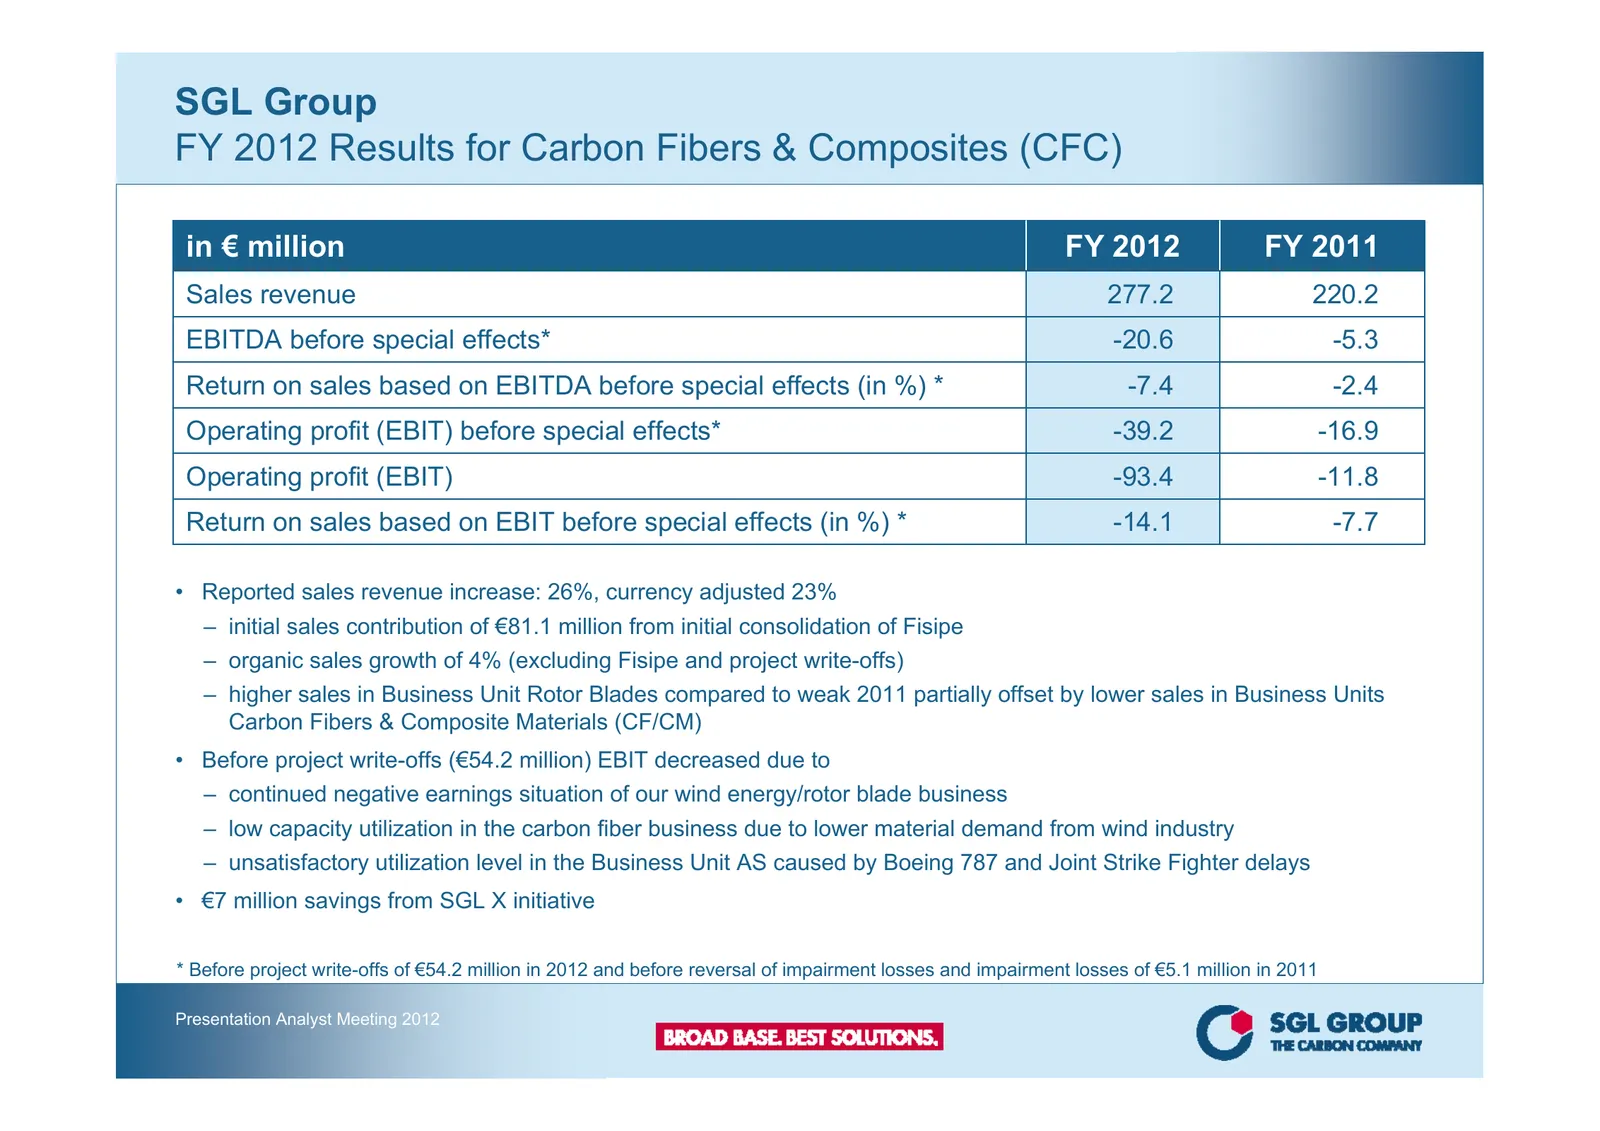
Slide 10: FY 2012 Results for Carbon Fibers & Composites (CFC)
SGL Group FY 2012 Results for Carbon Fibers & Composites (CFC) in € million FY 2012 FY 2011 Sales revenue 277.2 220.2 EBITDA before special effects* -20.6 -5.3 Return on sales based on EBITDA before special effects (in %) * -7.4 -2.4 Operating profit (EBIT) before special effects* -39.2 -16.9 Operat
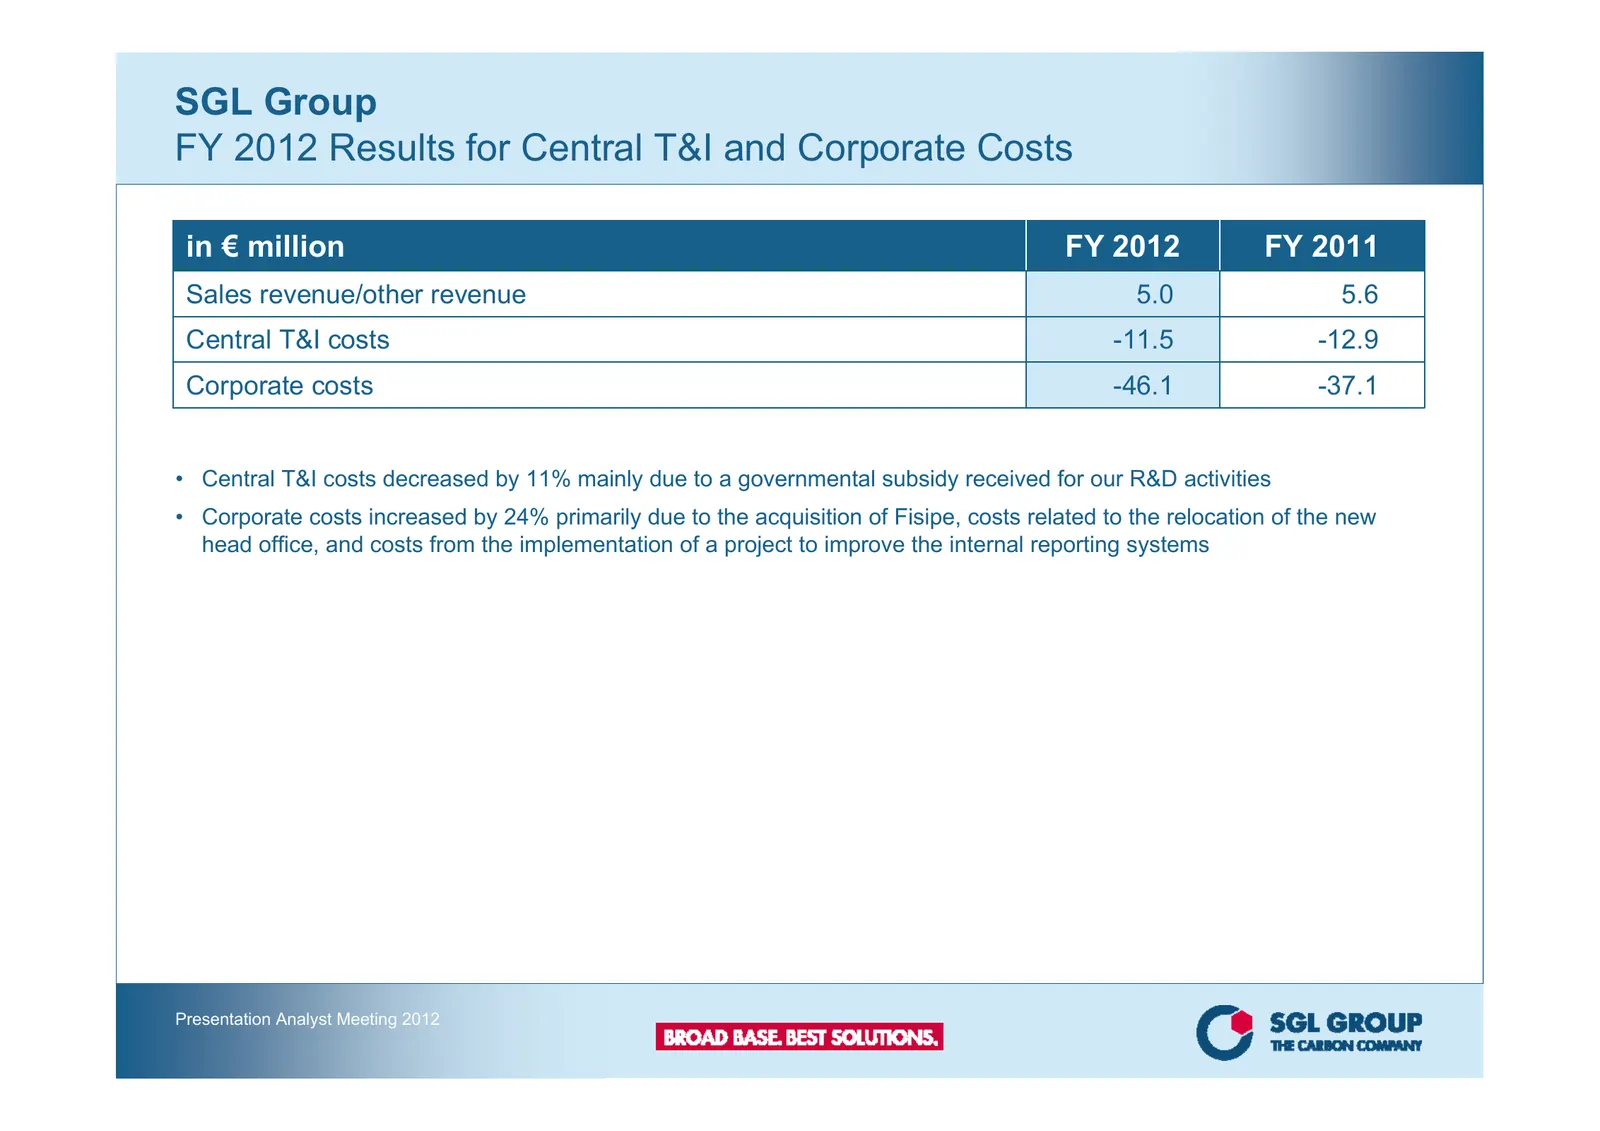
Slide 11: FY 2012 Results for Central T&I and Corporate Costs
SGL Group FY 2012 Results for Central T&I and Corporate Costs in € million FY 2012 FY 2011 Sales revenue/other revenue 5.0 5.6 Central T&I costs -11.5 -12.9 Corporate costs -46.1 -37.1 • Central T&I costs decreased by 11% mainly due to a governmental subsidy received for our R&D activities • Corpora
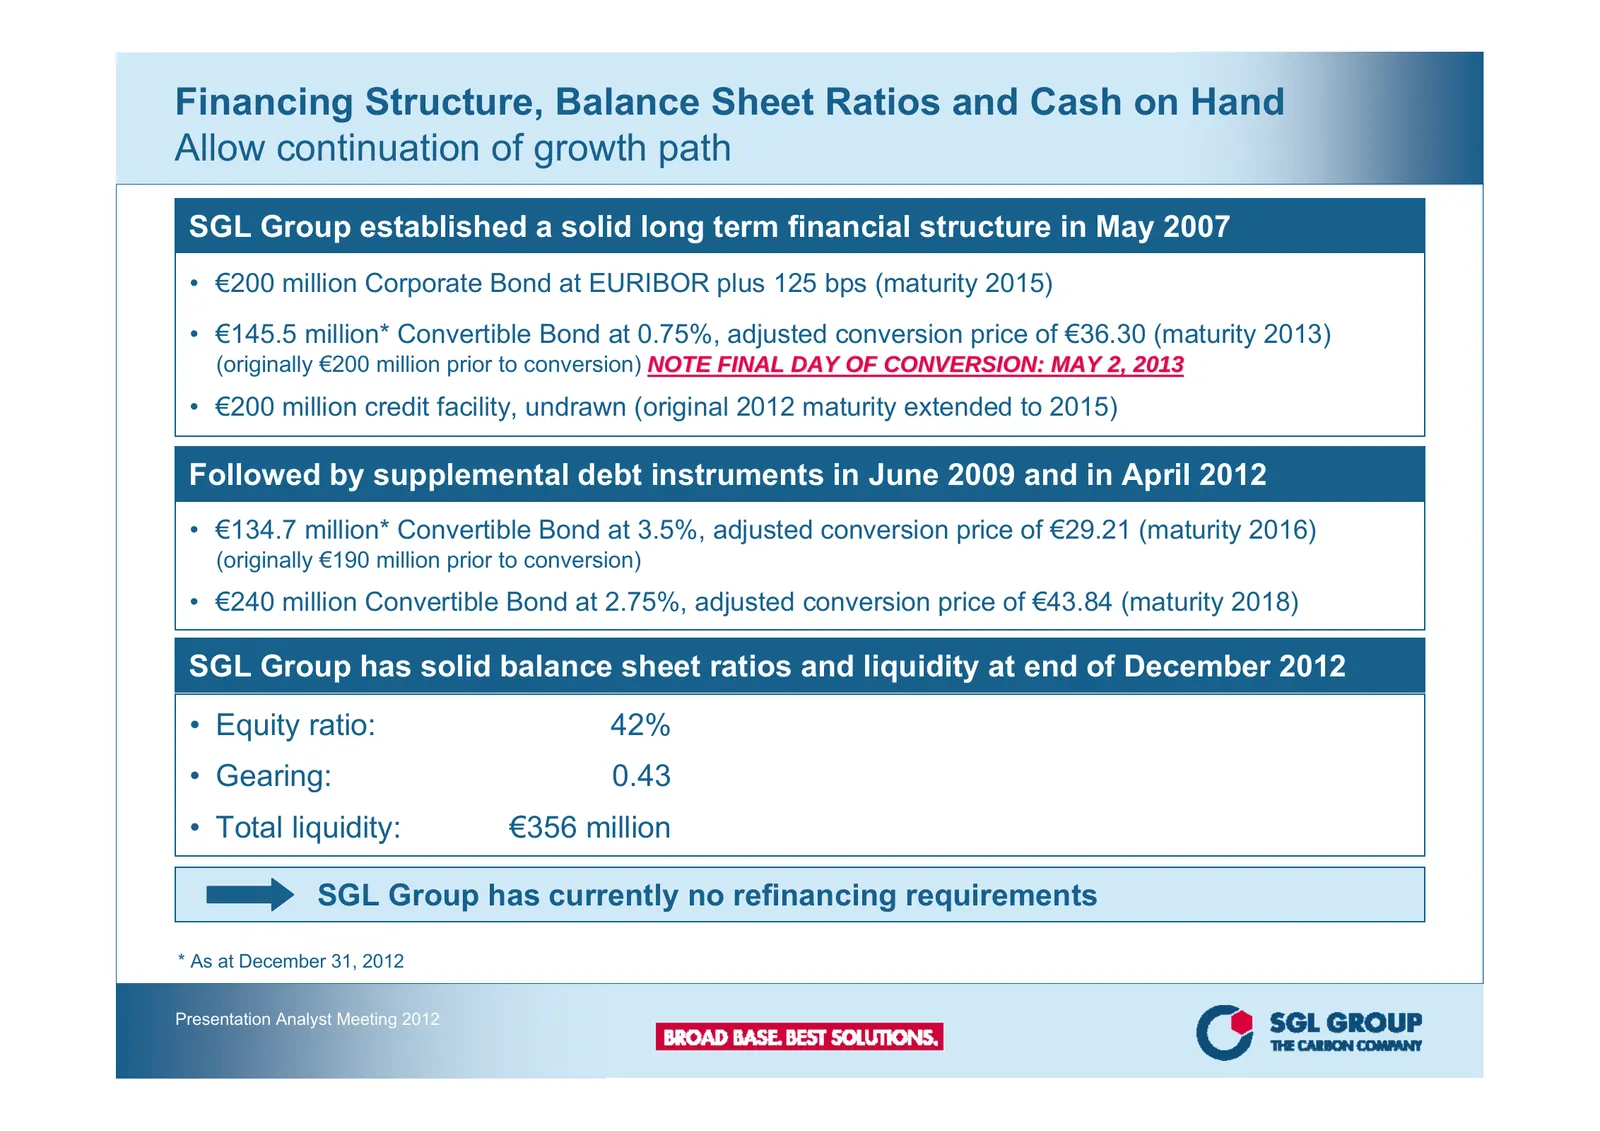
Slide 12: Financing Structure, Balance Sheet Ratios and Cash on Hand
Financing Structure, Balance Sheet Ratios and Cash on Hand Allow continuation of growth path SGL Group established a solid long term financial structure in May 2007 • €200 million Corporate Bond at EURIBOR plus 125 bps (maturity 2015) • €145.5 million* Convertible Bond at 0.75%, adjusted conversion
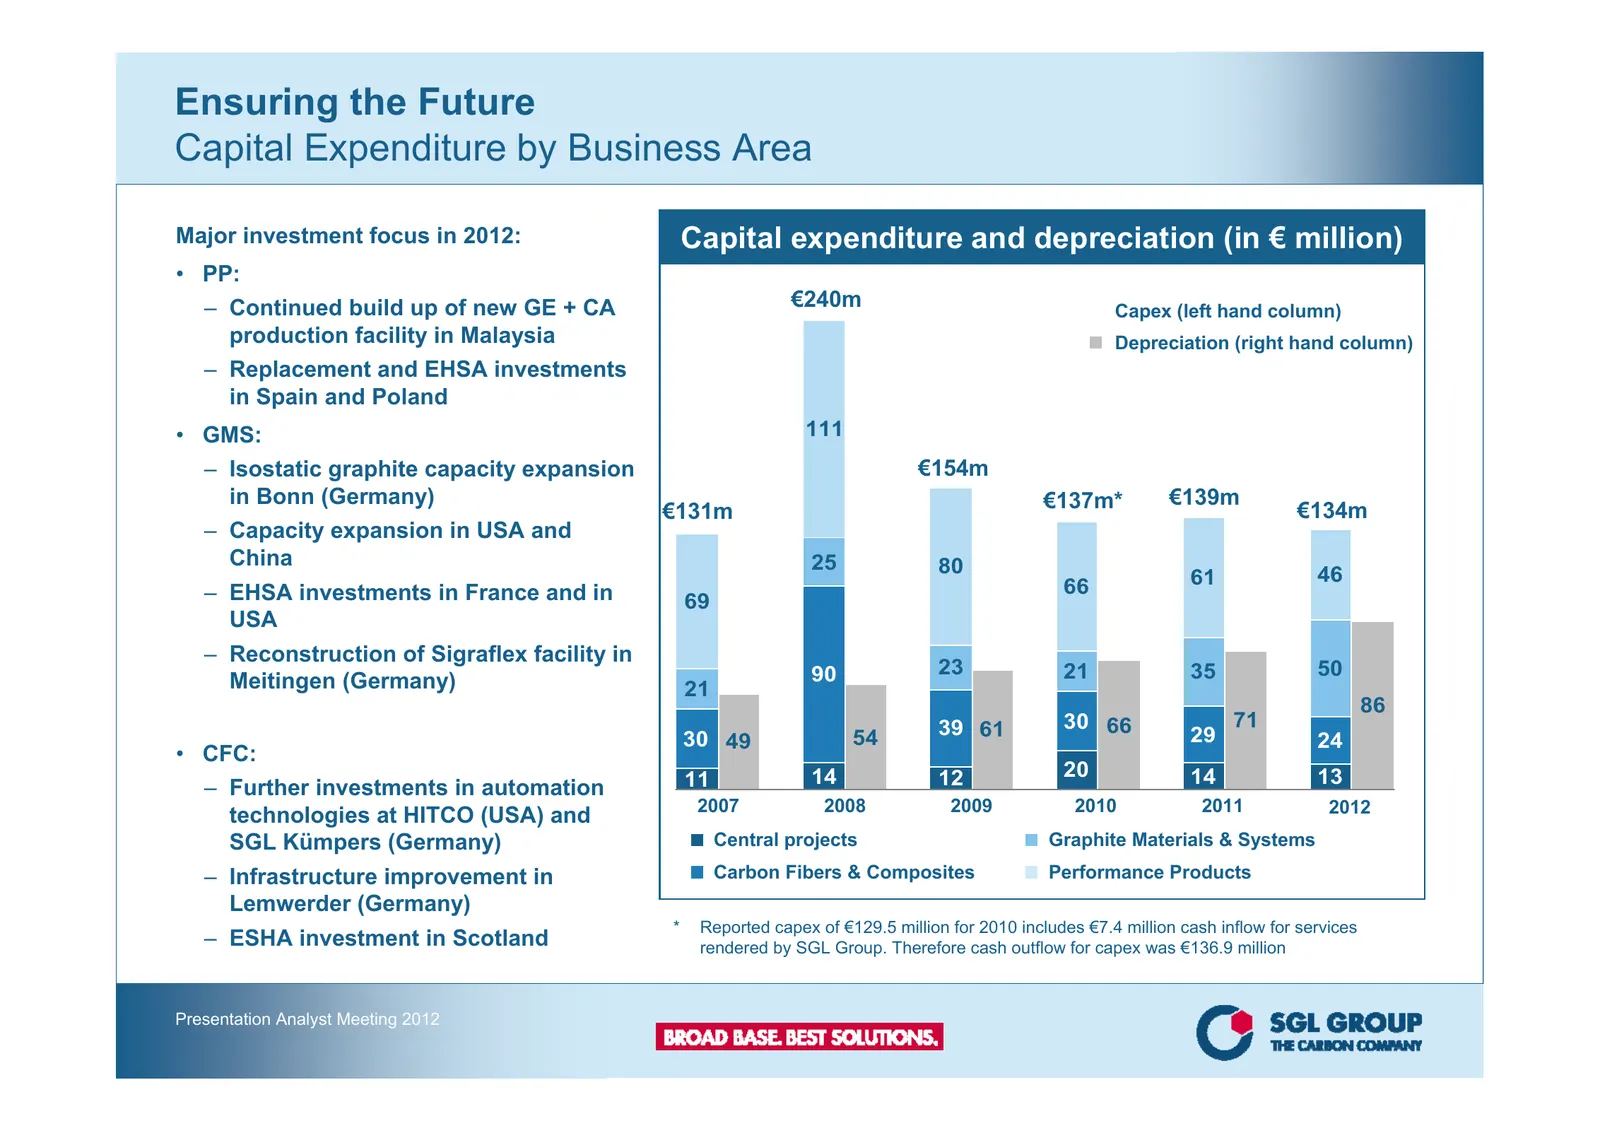
Slide 13: Ensuring the Future: Capital Expenditure by Business Area
Ensuring the Future Capital Expenditure by Business Area Major investment focus in 2012: Capital expenditure and depreciation (in € million) • PP: – Continued build up of new GE + CA €240m Capex (left hand column) production facility in Malaysia Depreciation (right hand column) – Replacement and EHS
Slide 14: Outlook 2013
Outlook 2013 Presentation Analyst Meeting 2012
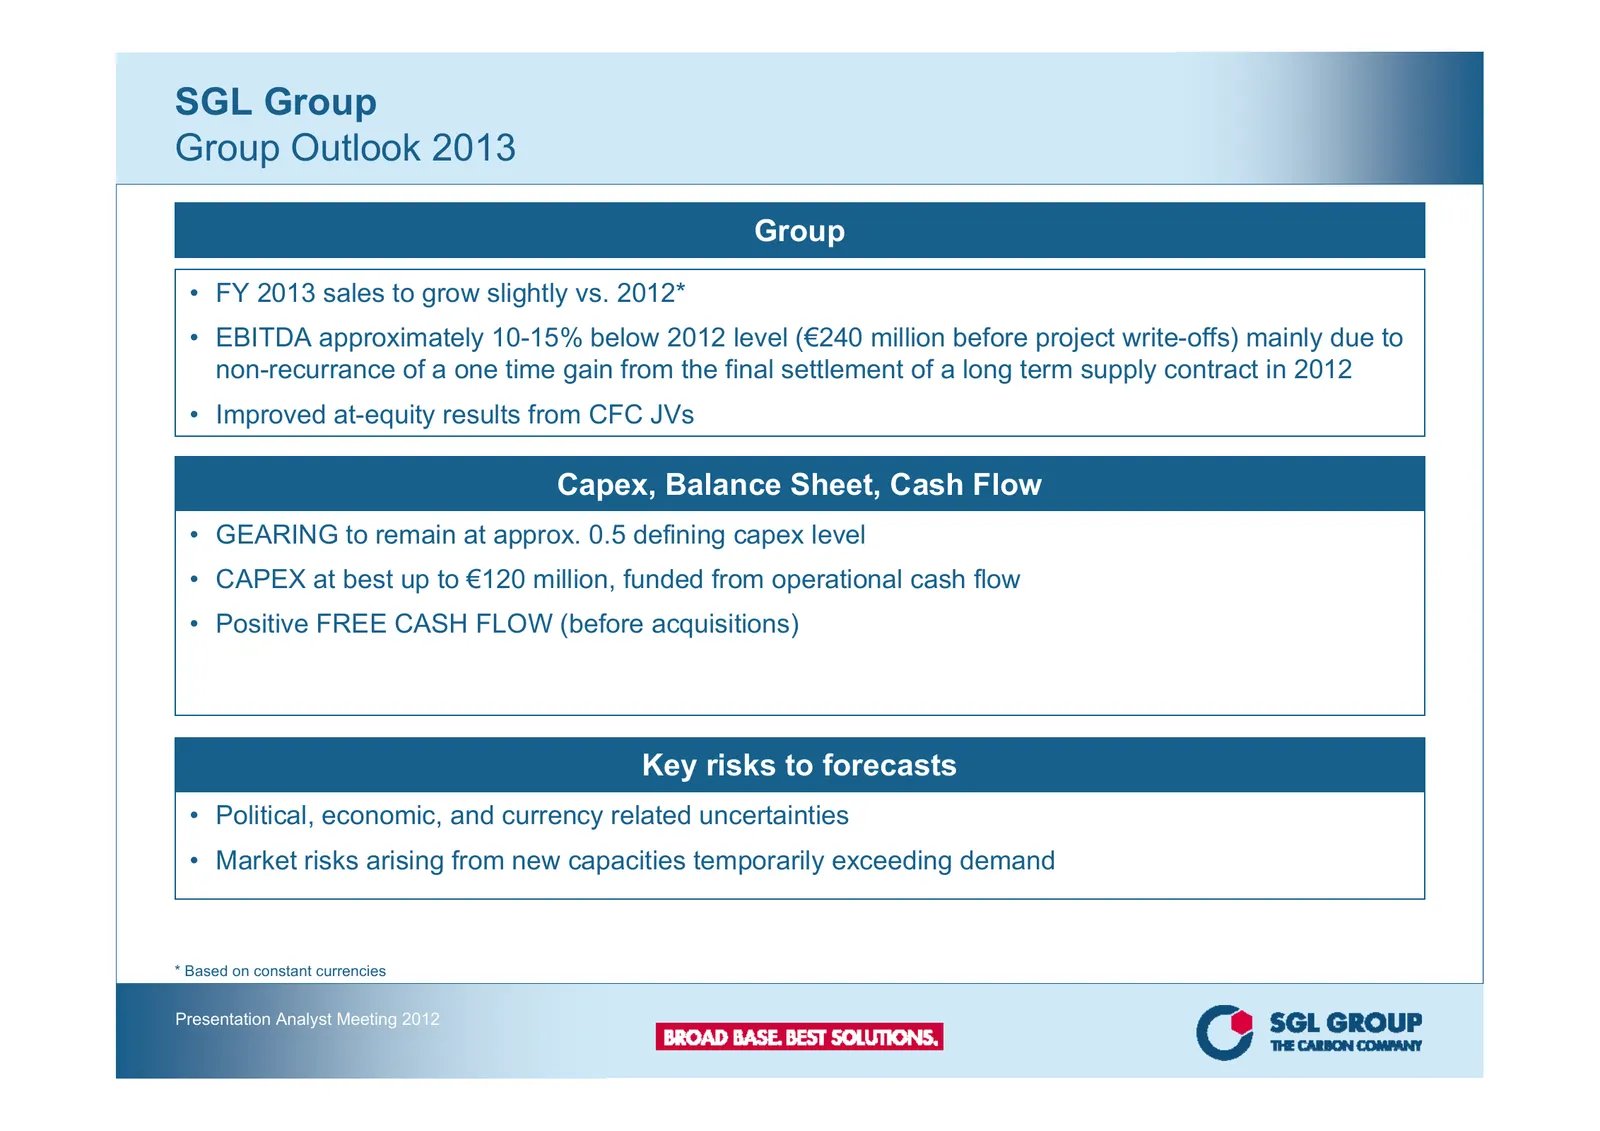
Slide 15: Group Outlook 2013
SGL Group Group Outlook 2013 Group • FY 2013 sales to grow slightly vs. 2012* • EBITDA approximately 10-15% below 2012 level (€240 million before project write-offs) mainly due to non-recurrance of a one time gain from the final settlement of a long term supply contract in 2012 • Improved at-equity
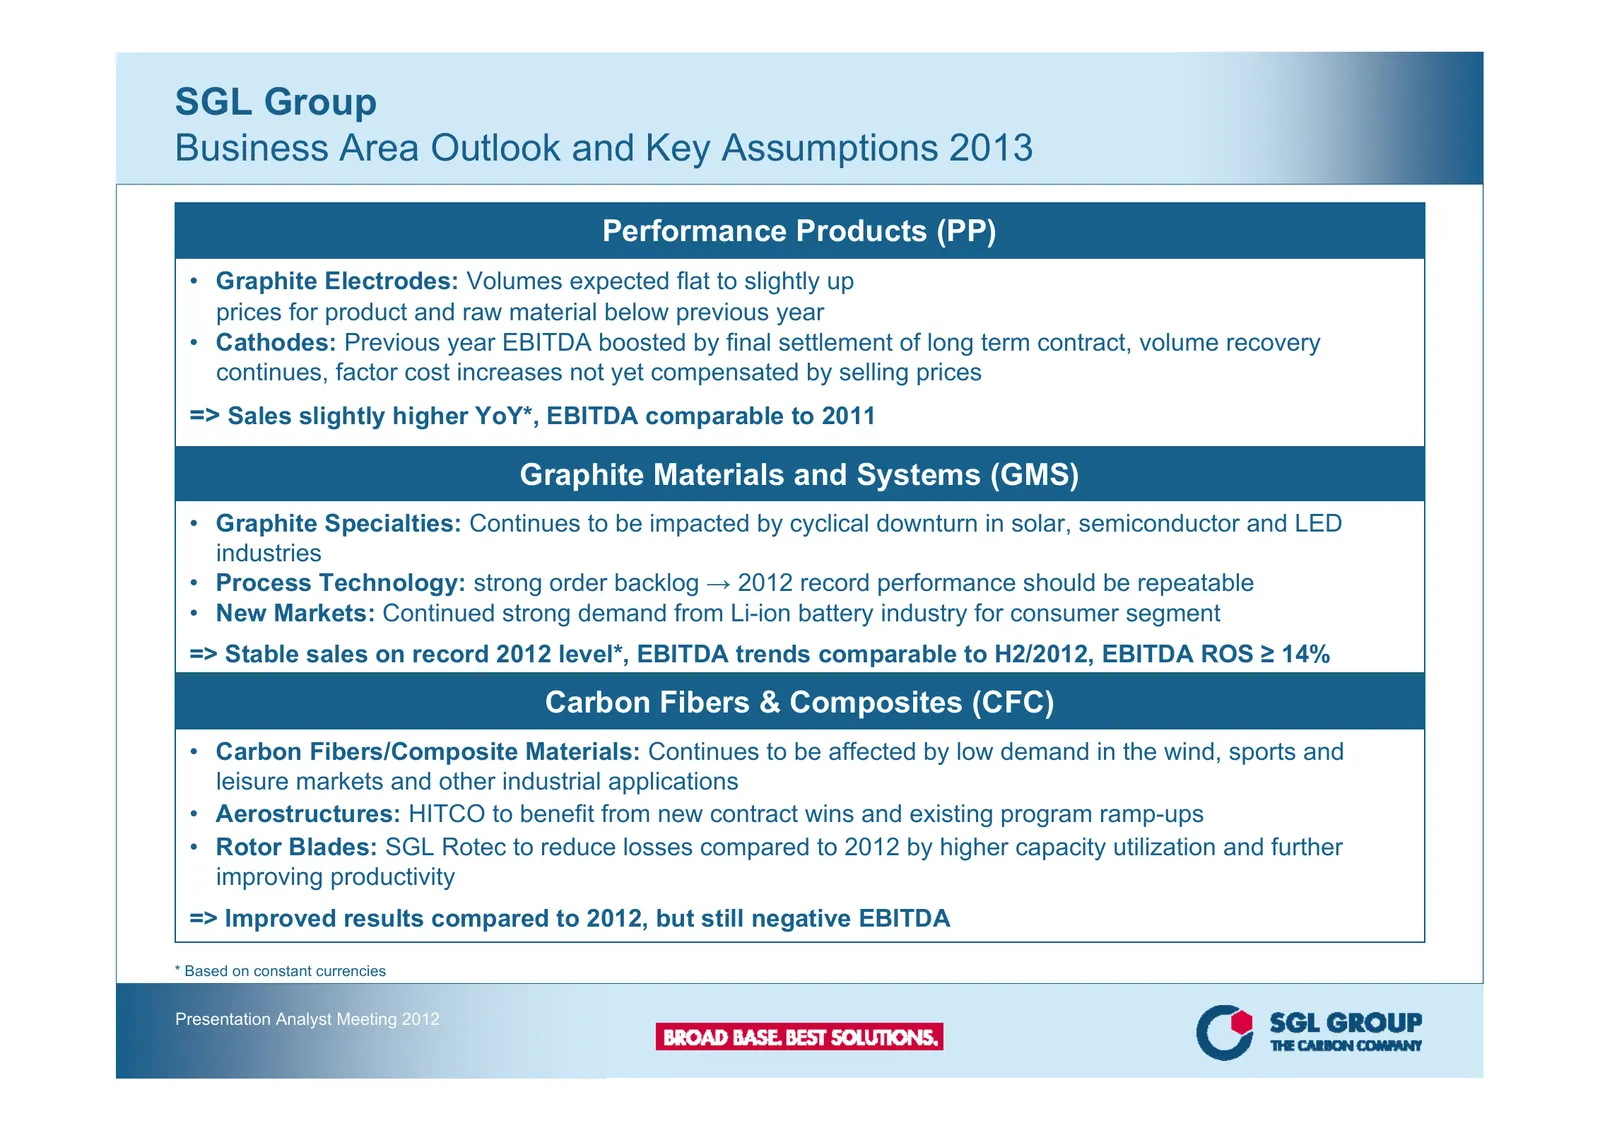
Slide 16: Business Area Outlook and Key Assumptions 2013
SGL Group Business Area Outlook and Key Assumptions 2013 Performance Products (PP) • Graphite Electrodes: Volumes expected flat to slightly up prices for product and raw material below previous year • Cathodes: Previous year EBITDA boosted by final settlement of long term contract, volume recovery c
Slide 17: Strategic Outlook
Strategic Outlook Presentation Analyst Meeting 2012
Slide 18: The strategy of SGL Group: balanced mix of established and future business
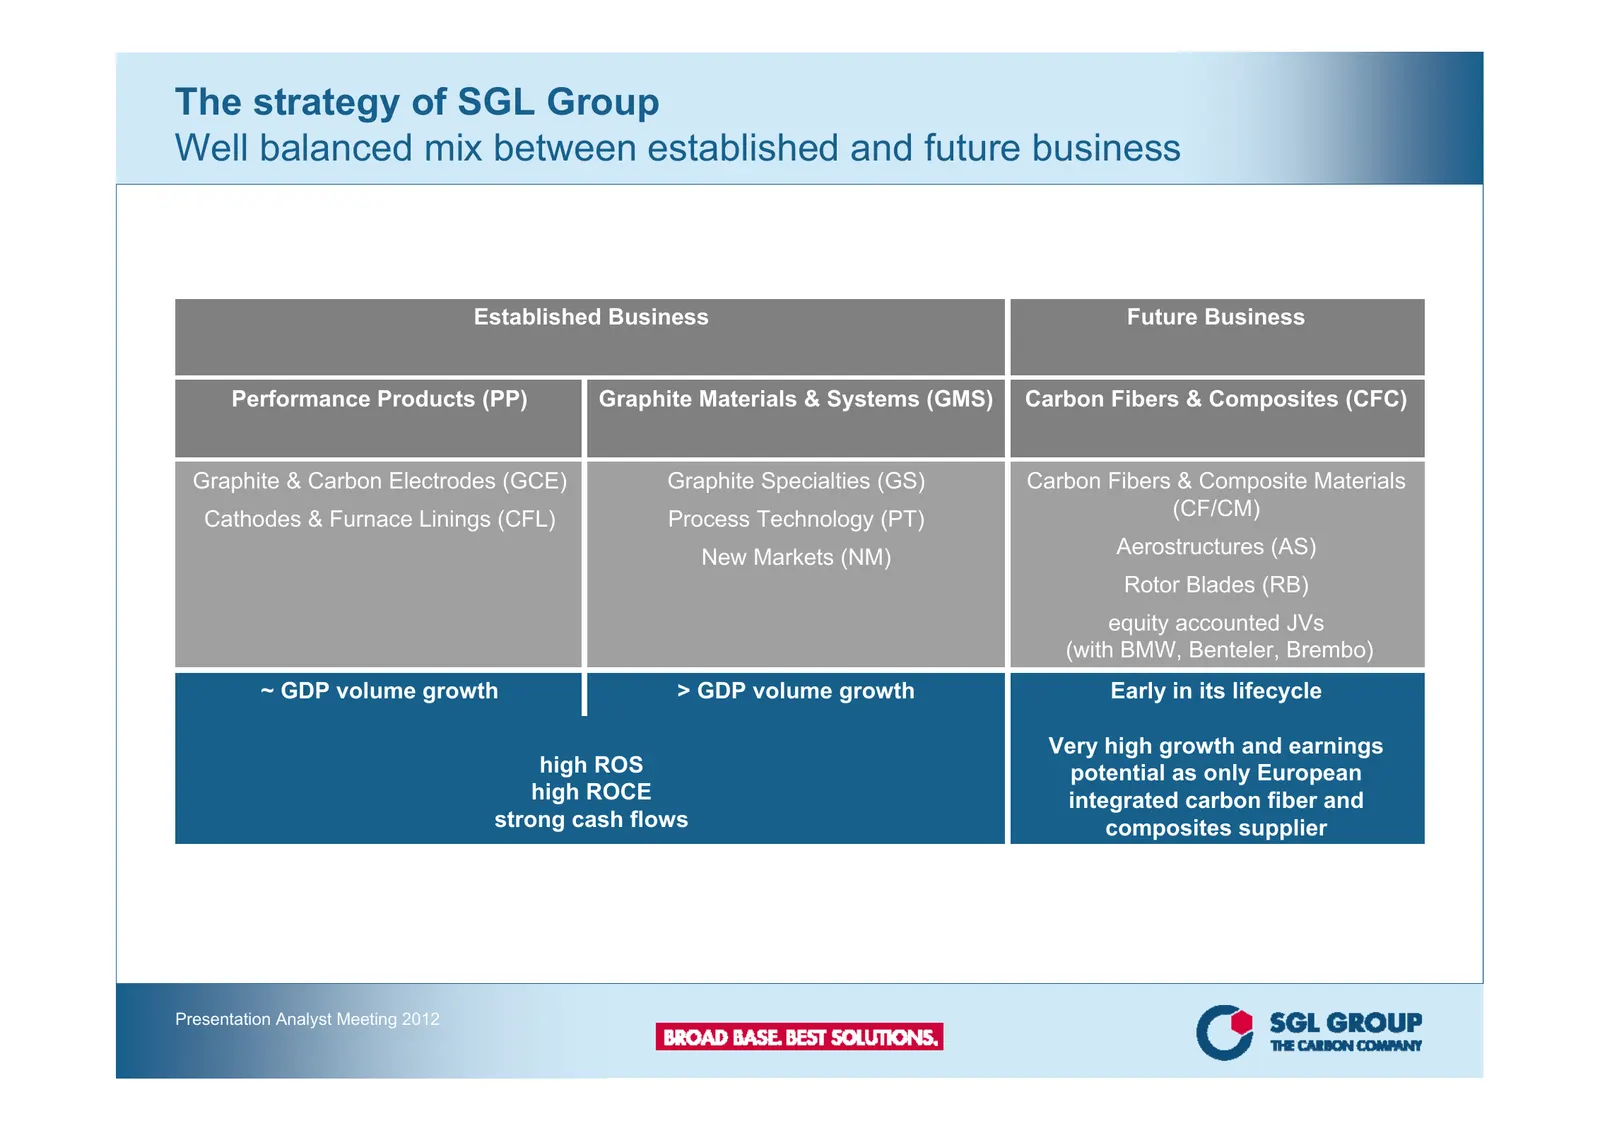
The strategy of SGL Group Well balanced mix between established and future business Established Business Future Business Performance Products (PP) Graphite Materials & Systems (GMS) Carbon Fibers & Composites (CFC) Graphite & Carbon Electrodes (GCE) Graphite Specialties (GS) Carbon Fibers & Composit
Slide 19: The strategy of SGL Group: balanced mix of established and future business
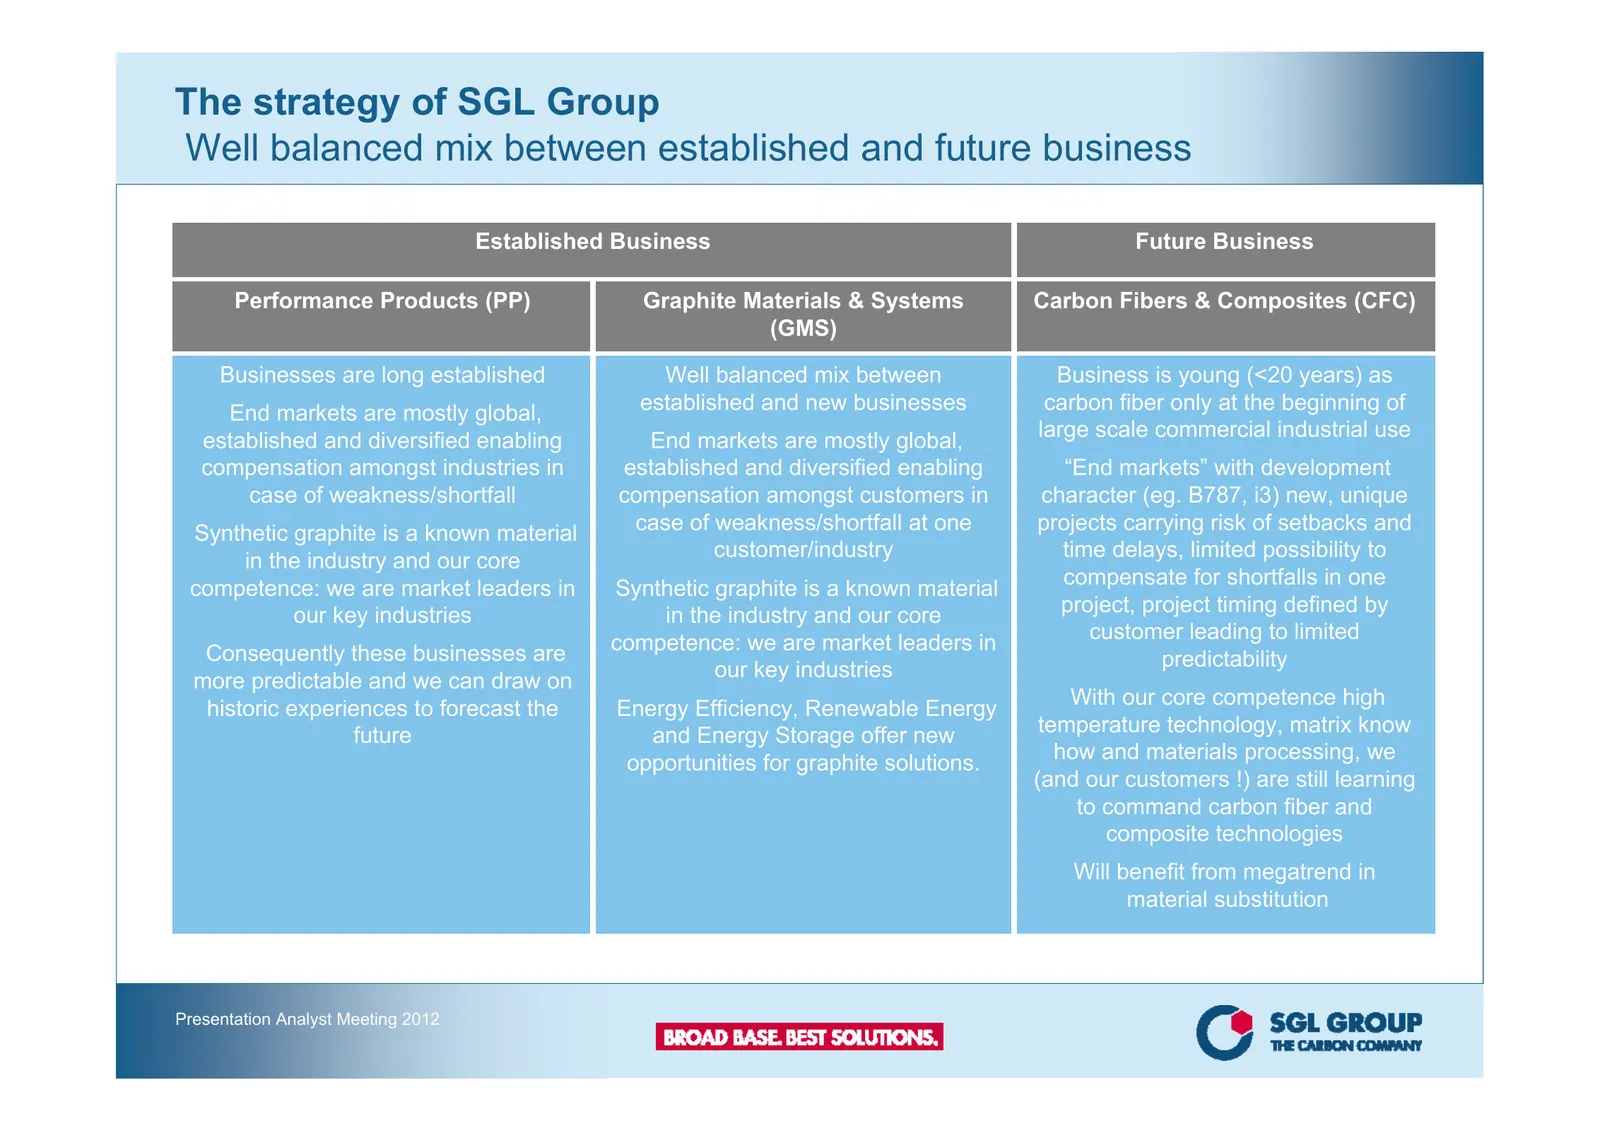
The strategy of SGL Group Well balanced mix between established and future business Established Business Future Business Performance Products (PP) Graphite Materials & Systems Carbon Fibers & Composites (CFC) (GMS) Businesses are long established Well balanced mix between Business is young (<20 year
Slide 20: Group Sales to increase by more than 10% p.a.
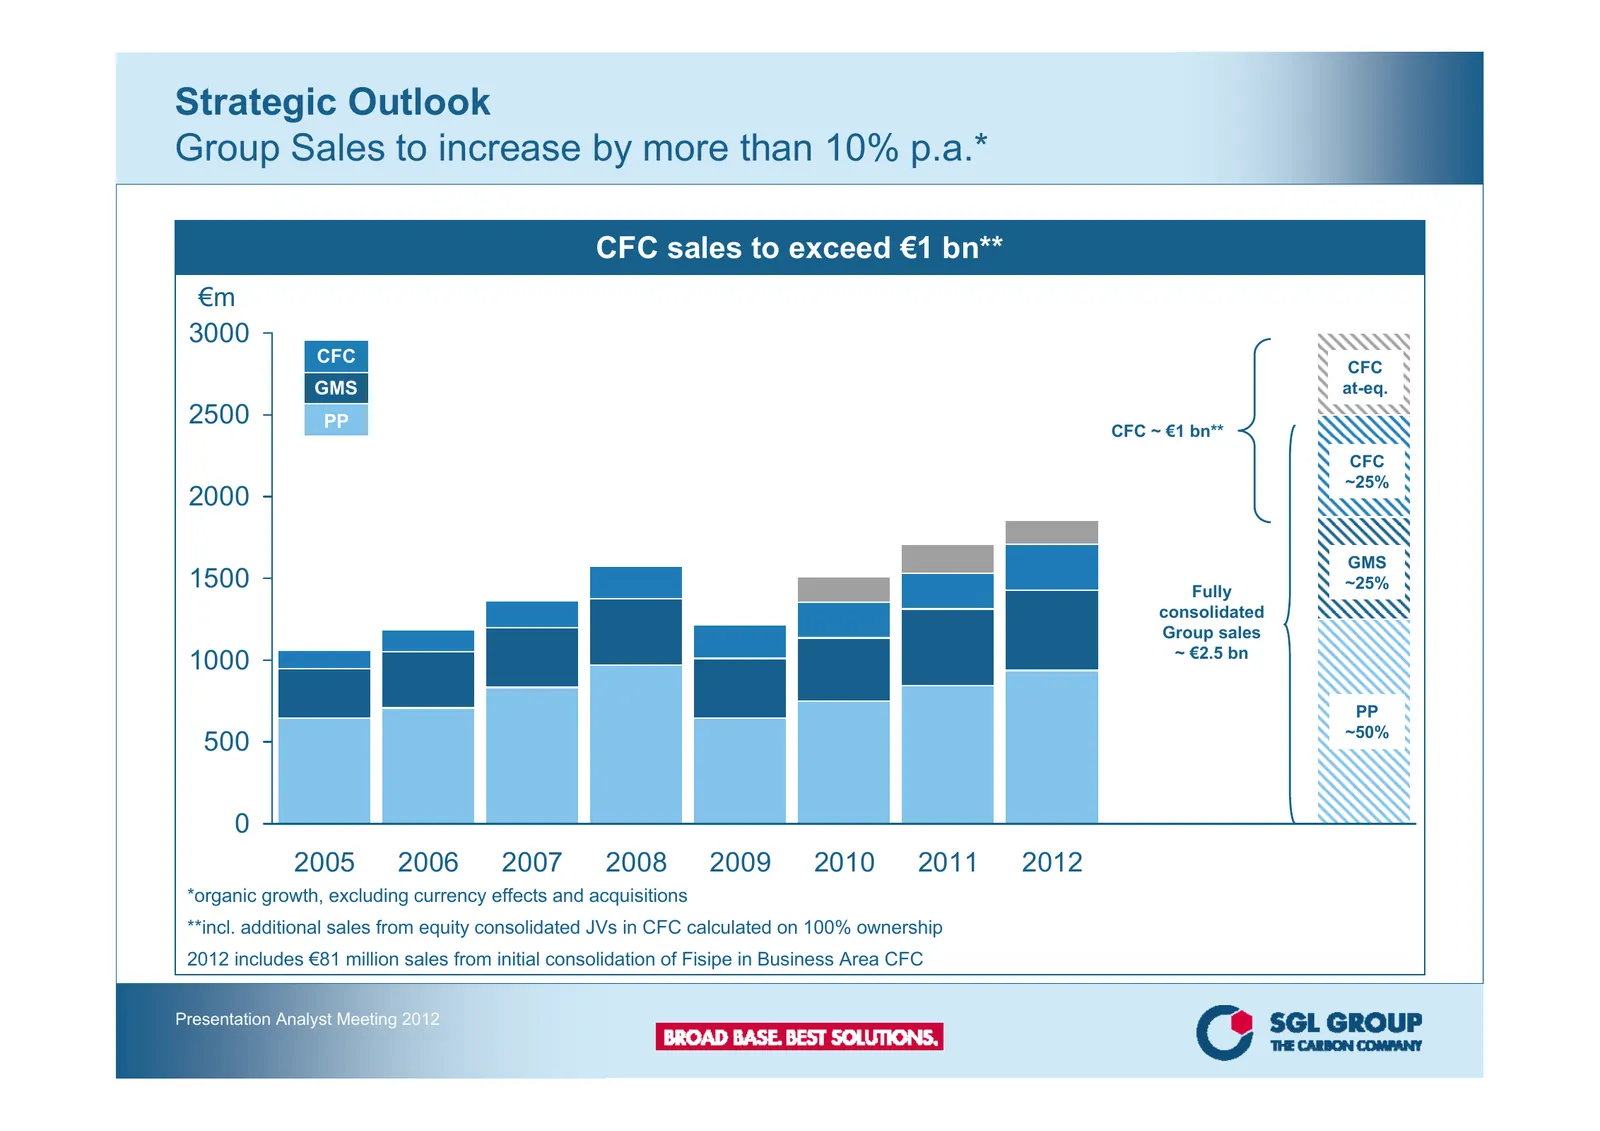
Strategic Outlook Group Sales to increase by more than 10% p.a.* CFC sales to exceed €1 bn** €m 3000 CFC CFC GMS at-eq. 2500 PP CFC ~ €1 bn** CFC ~25% 2000 GMS 1500 Fully ~25% consolidated Group sales ~ €2.5 bn 1000 PP ~50% 500 0 2005 2006 2007 2008 2009 2010 2011 2012 *organic growth, excluding cur
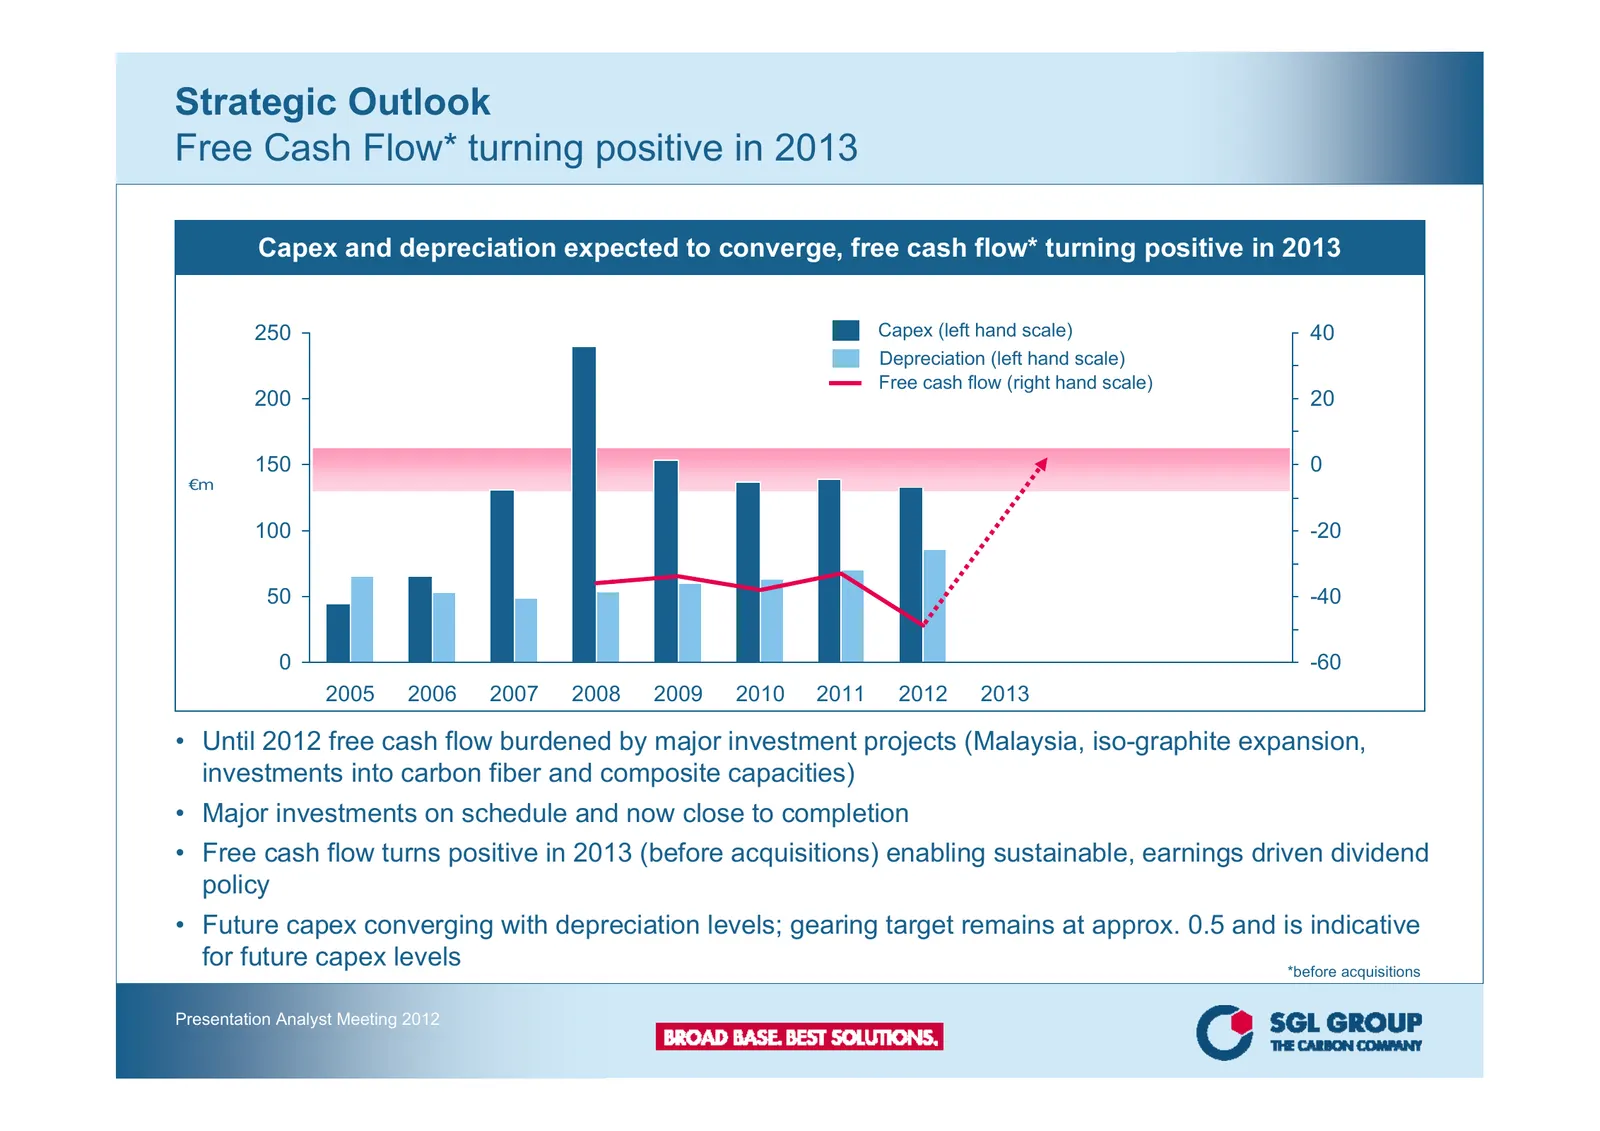
Slide 21: Free Cash Flow turning positive in 2013
Strategic Outlook Free Cash Flow* turning positive in 2013 Capex and depreciation expected to converge, free cash flow* turning positive in 2013 250 Capex (left hand scale) 40 Depreciation (left hand scale) Free cash flow (right hand scale) 200 20 150 0 €m 100 -20 50 -40 0 -60 2005 2006 2007 2008 20
Slide 22: Introduction of EBITDA as Key Performance Measure
Strategic Outlook Introduction of EBITDA as Key Performance Measure • Over the past years, SGL Group has transformed from an “INVEST-TO-MAINTAIN” mode to a technology driven “INVEST-TO-GROW” mode • Expansion focused on Asia for PP and GMS as well as the build up of our future growth in CFC • “INVEST
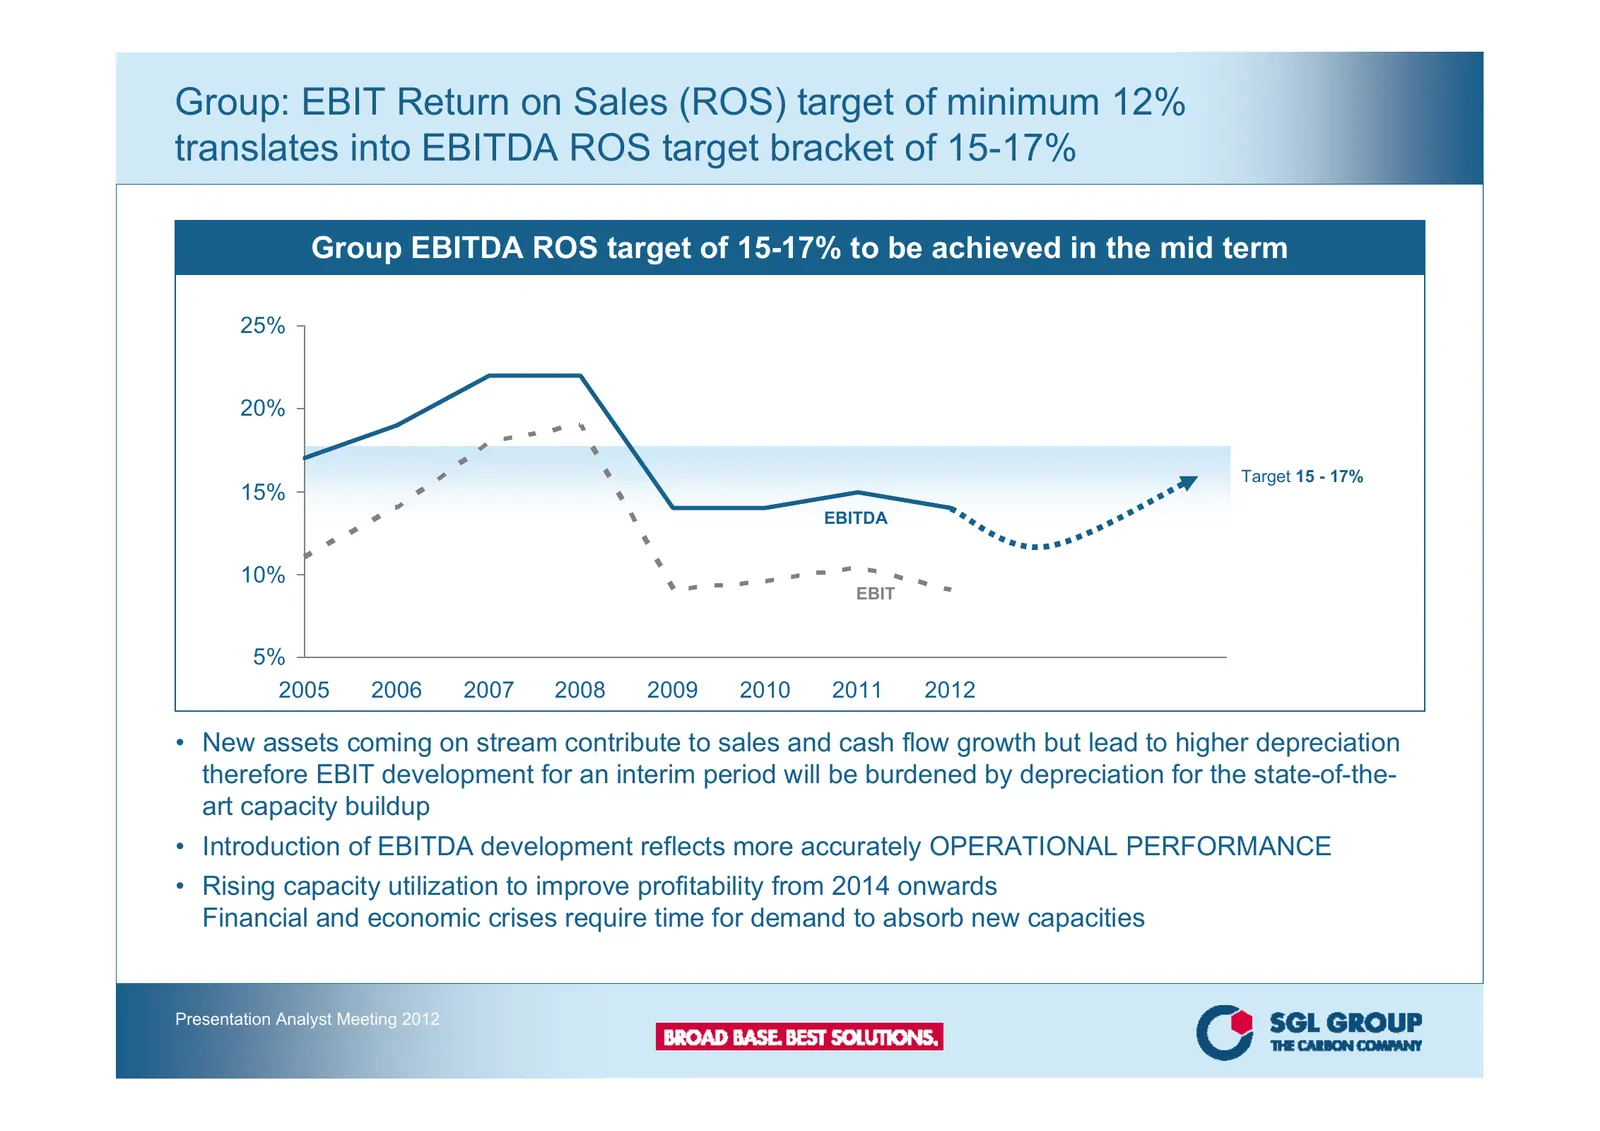
Slide 23: Group EBIT ROS target of minimum 12% translates into EBITDA ROS target of 15-17%
Group: EBIT Return on Sales (ROS) target of minimum 12% translates into EBITDA ROS target bracket of 15-17% Group EBITDA ROS target of 15-17% to be achieved in the mid term 25% 20% Target 15 - 17% 15% EBITDA 10% EBIT 5% 2005 2006 2007 2008 2009 2010 2011 2012 • New assets coming on stream contribute
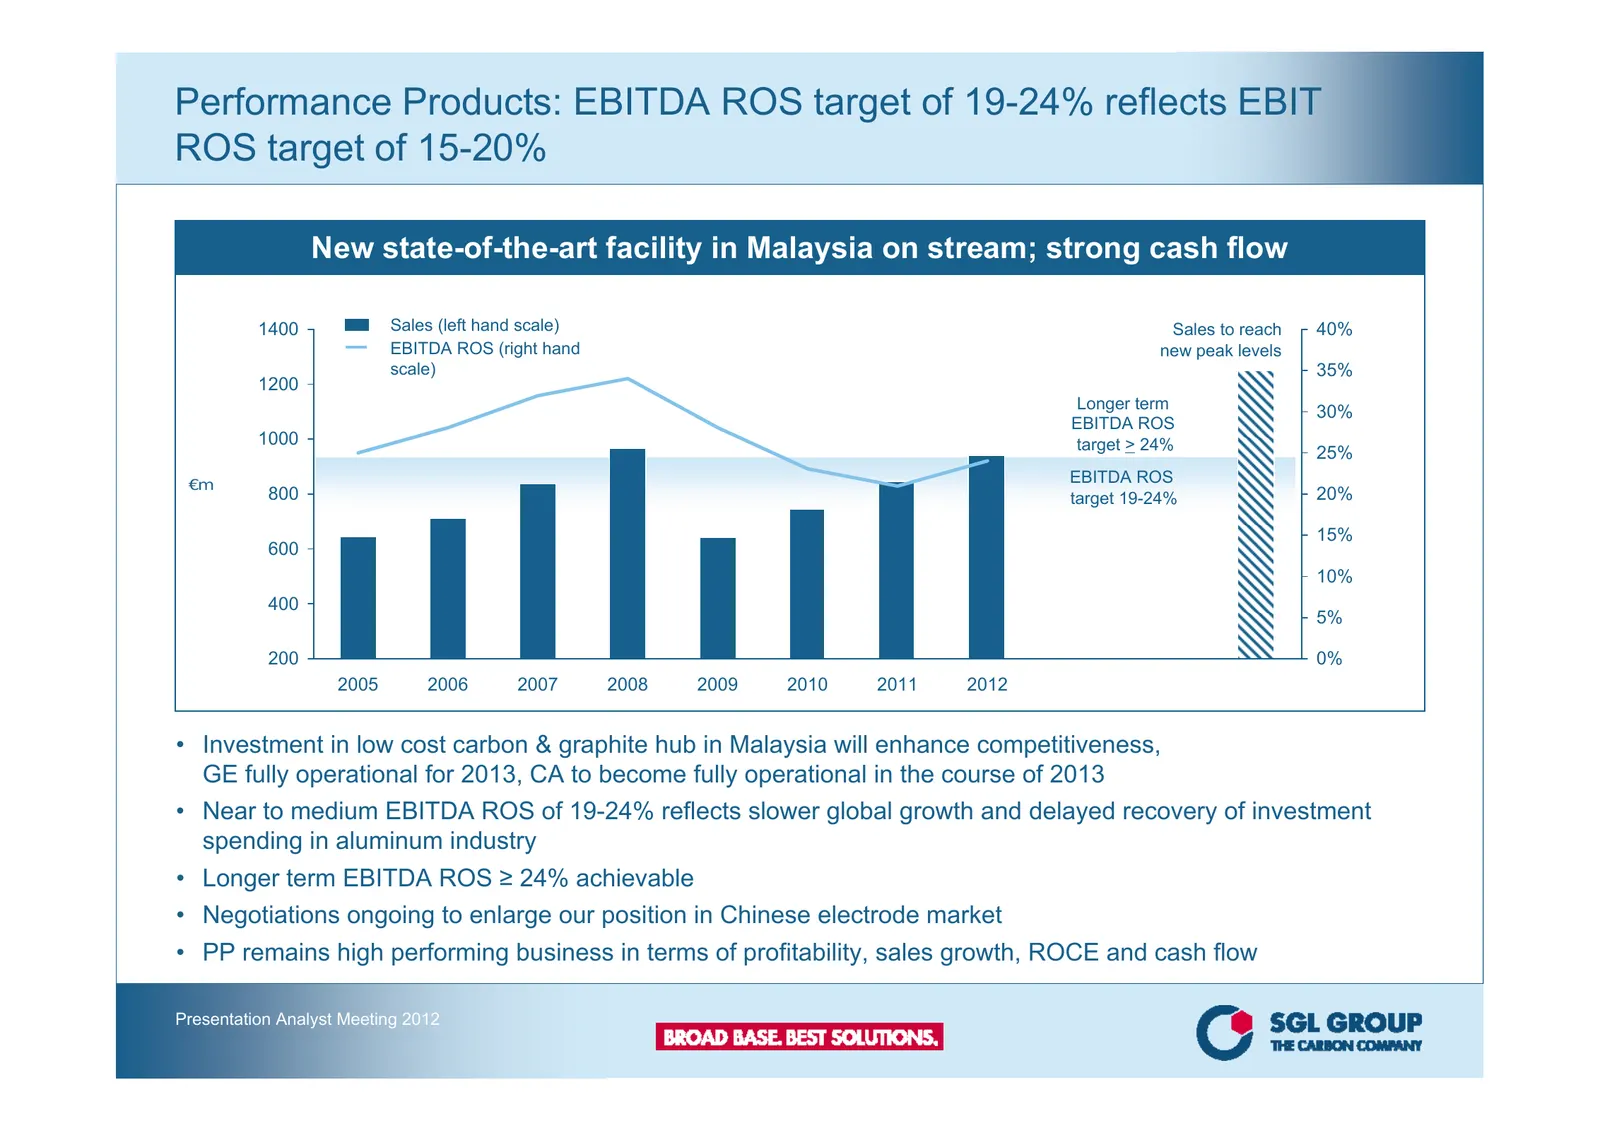
Slide 24: Performance Products: EBITDA ROS target of 19-24%
Performance Products: EBITDA ROS target of 19-24% reflects EBIT ROS target of 15-20% New state-of-the-art facility in Malaysia on stream; strong cash flow 1400 Sales (left hand scale) Sales to reach 40% EBITDA ROS (right hand new peak levels scale) 35% 1200 Longer term 30% EBITDA ROS 1000 target > 2
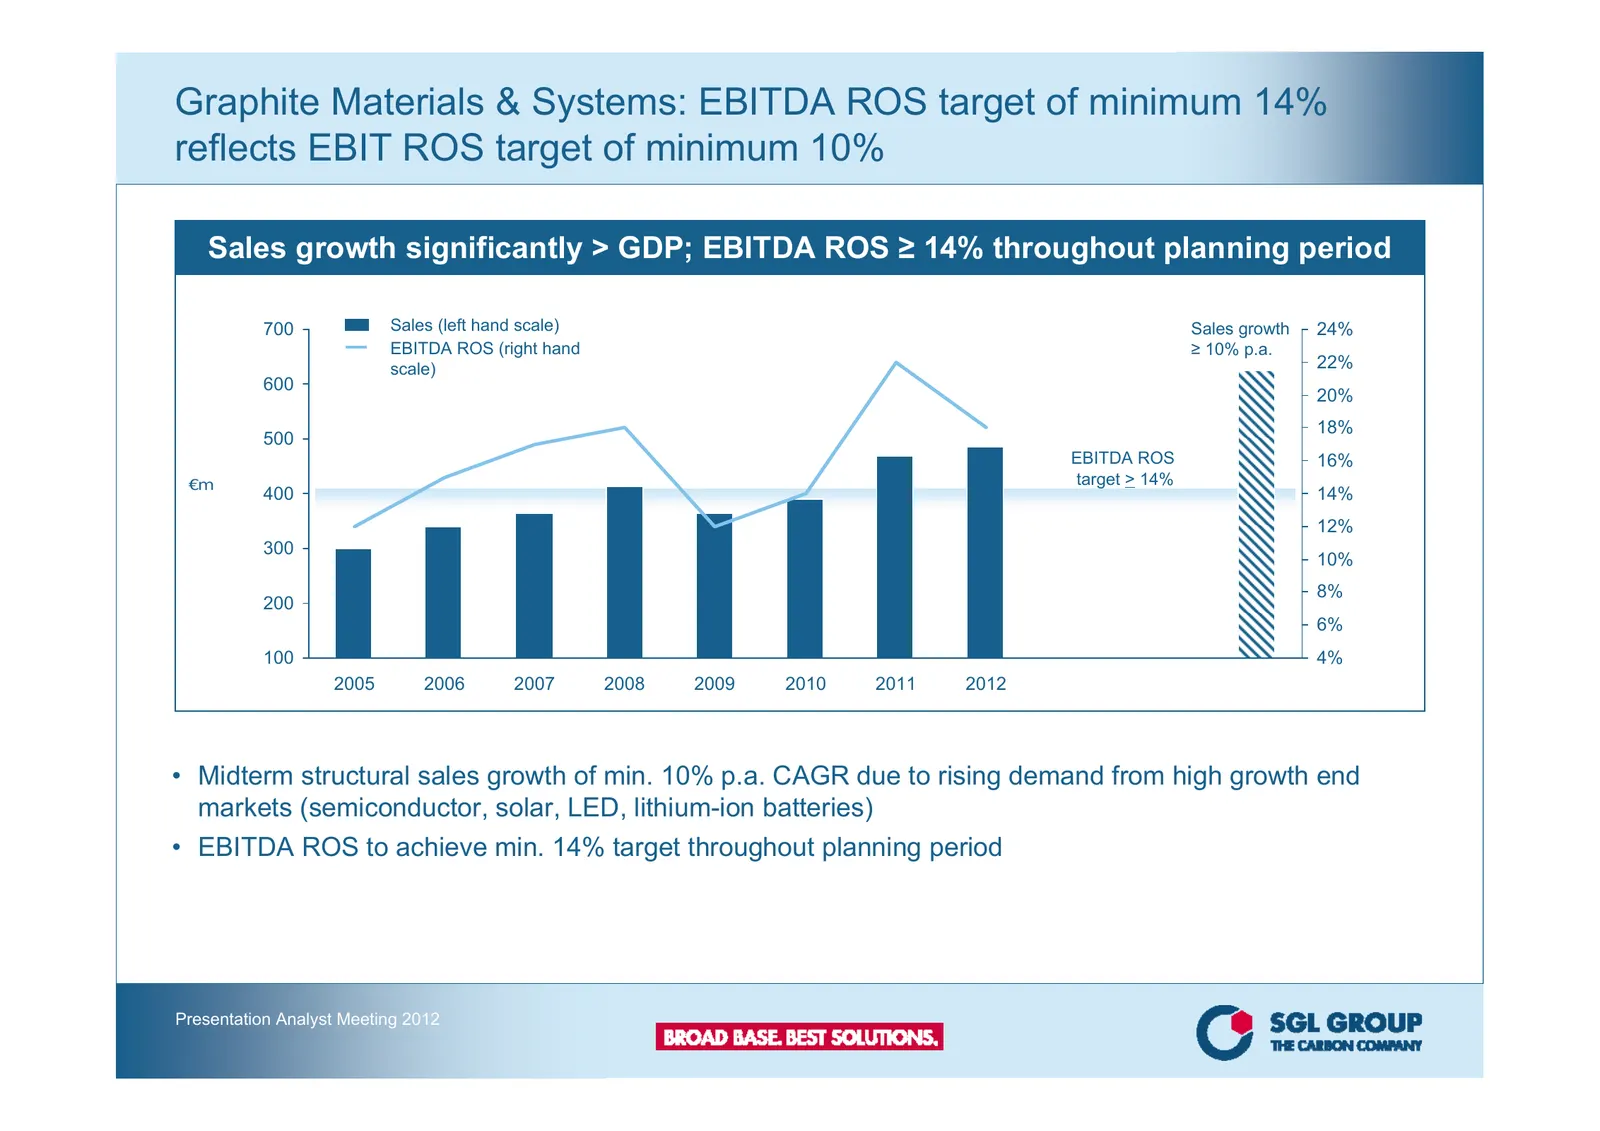
Slide 25: Graphite Materials & Systems: EBITDA ROS target of minimum 14%
Graphite Materials & Systems: EBITDA ROS target of minimum 14% reflects EBIT ROS target of minimum 10% Sales growth significantly > GDP; EBITDA ROS ≥ 14% throughout planning period 700 Sales (left hand scale) Sales growth 24% EBITDA ROS (right hand ≥ 10% p.a. scale) 22% 600 20% 18% 500 EBITDA ROS 16
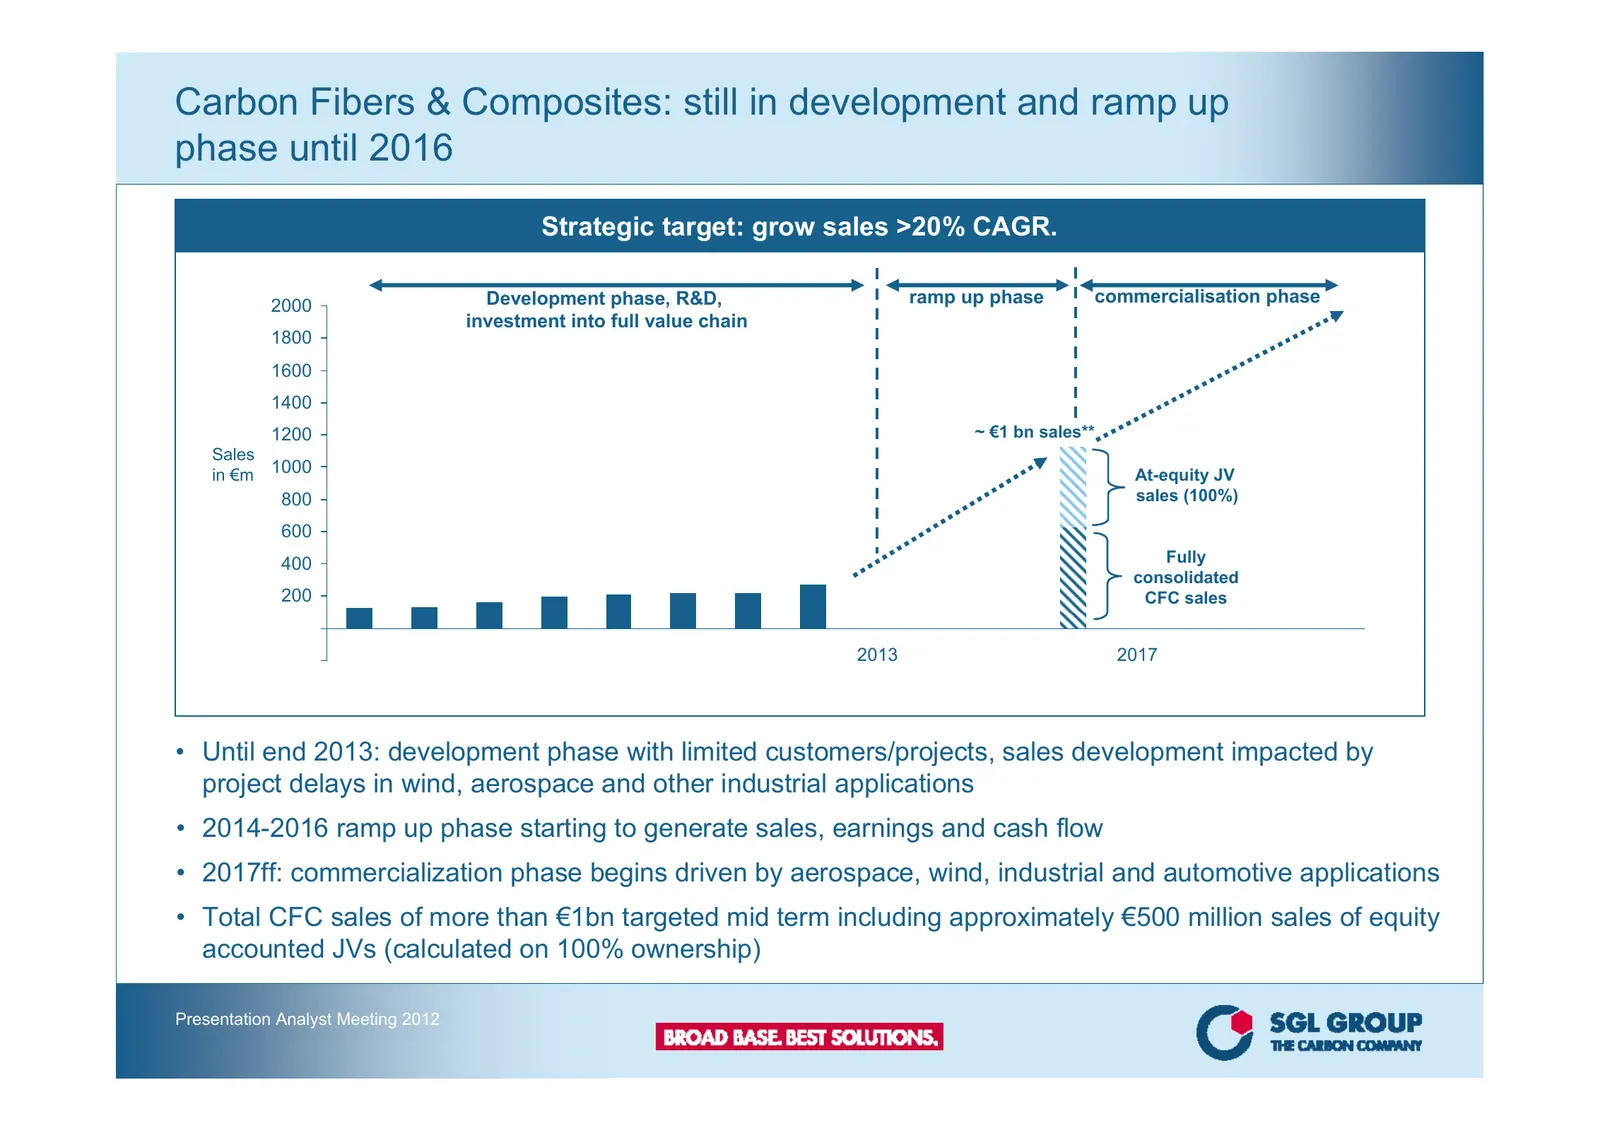
Slide 26: Carbon Fibers & Composites: still in development and ramp up phase until 2016
Carbon Fibers & Composites: still in development and ramp up phase until 2016 Strategic target: grow sales >20% CAGR. 2000 Development phase, R&D, ramp up phase commercialisation phase investment into full value chain 1800 1600 1400 1200 ~ €1 bn sales** Sales in €m 1000 At-equity JV 800 sales (100%)
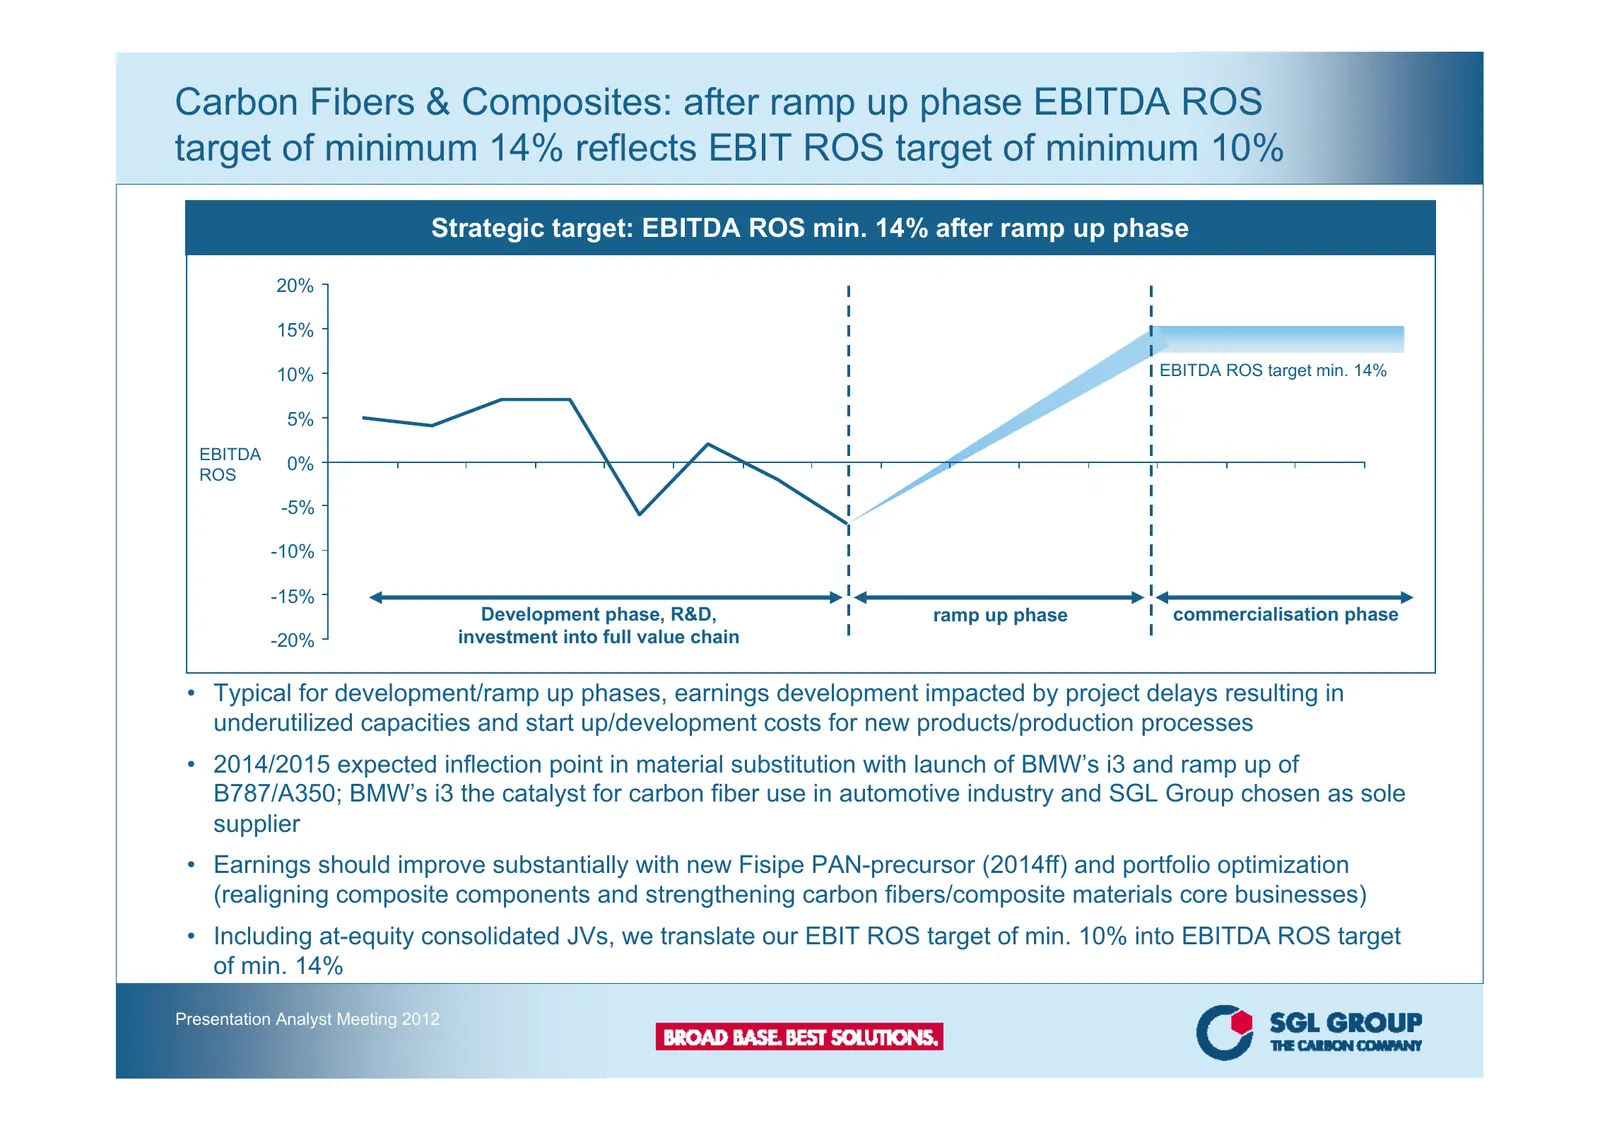
Slide 27: Carbon Fibers & Composites: EBITDA ROS target of minimum 14% after ramp up
Carbon Fibers & Composites: after ramp up phase EBITDA ROS target of minimum 14% reflects EBIT ROS target of minimum 10% Strategic target: EBITDA ROS min. 14% after ramp up phase 20% 15% 10% EBITDA ROS target min. 14% 5% EBITDA 0% ROS -5% -10% -15% Development phase, R&D, ramp up phase commercialisa
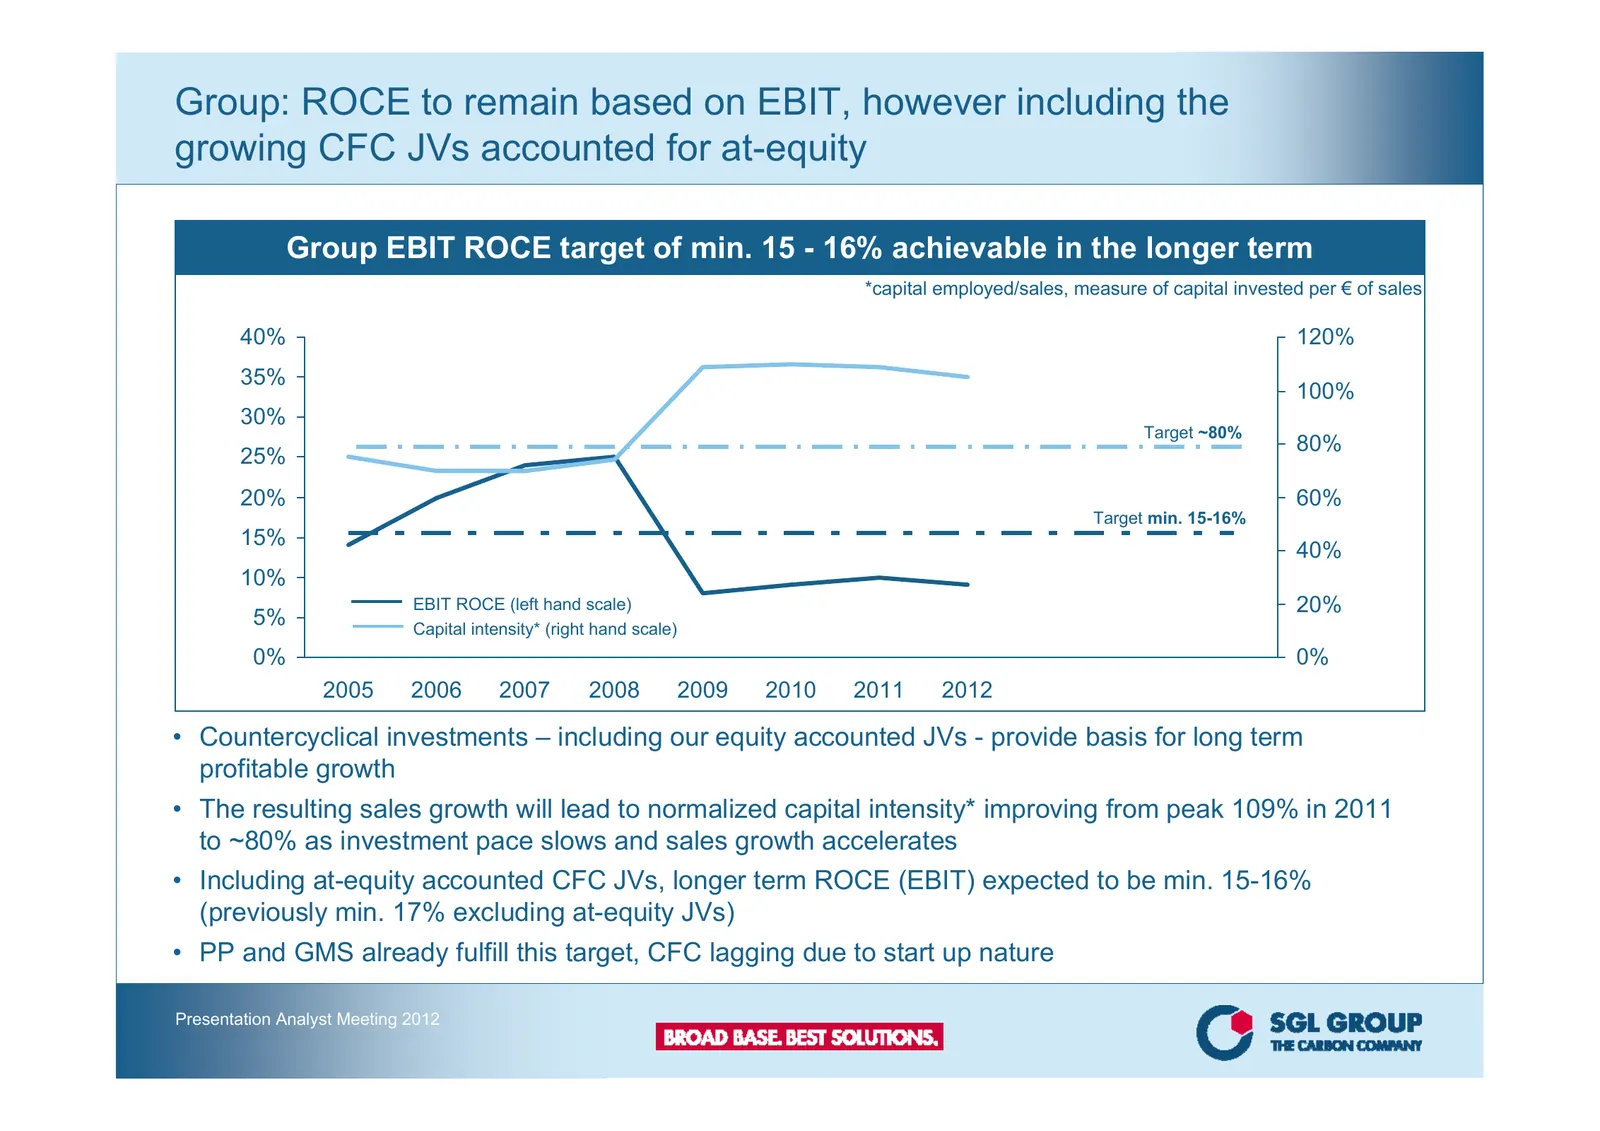
Slide 28: Group: ROCE to remain based on EBIT, including CFC JVs
Group: ROCE to remain based on EBIT, however including the growing CFC JVs accounted for at-equity Group EBIT ROCE target of min. 15 - 16% achievable in the longer term *capital employed/sales, measure of capital invested per € of sales 40% 120% 35% 100% 30% Target ~80% 80% 25% 20% 60% Target min. 1
Slide 29: Important note: forward looking statements
Important note: This presentation contains forward looking statements based on the information currently available to us and on our current projections and assumptions. By nature, forward looking statements are associated with known and unknown risks and uncertainties, as a consequence of which actu
Source: Internet Archive copy of sglgroup.com
More decks from SGL Carbon SE
 9M 2026 Earnings Presentation30 slides · Nov 5, 2026
 9M 2026 Earnings Presentation17 slides · Nov 5, 2026
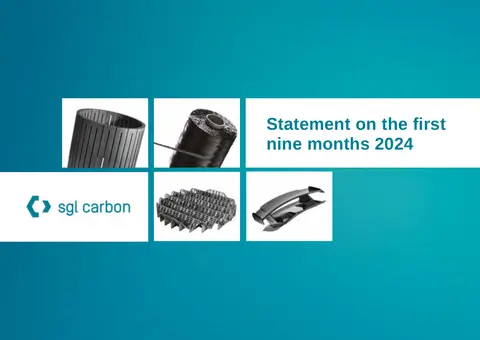 Q3 2024 Earnings Presentation28 slides · Nov 7, 2024
 H1 2024 Earnings Presentation18 slides · Aug 8, 2024
 Q1 2024 Earnings Presentation19 slides · May 8, 2024
 ESG Presentation (March 2024)7 slides · Mar 22, 2024