Pennon Group PLC · LSE:PNN
Pennon — H1 2002/03 Earnings Presentation
33 slides from Pennon's earnings presentation, November 2002
Slide 1: Pennon Group Plc Interim Results 2002
Pennon Group Plc Interim Results 2002 For the half year ended 30 September 2002
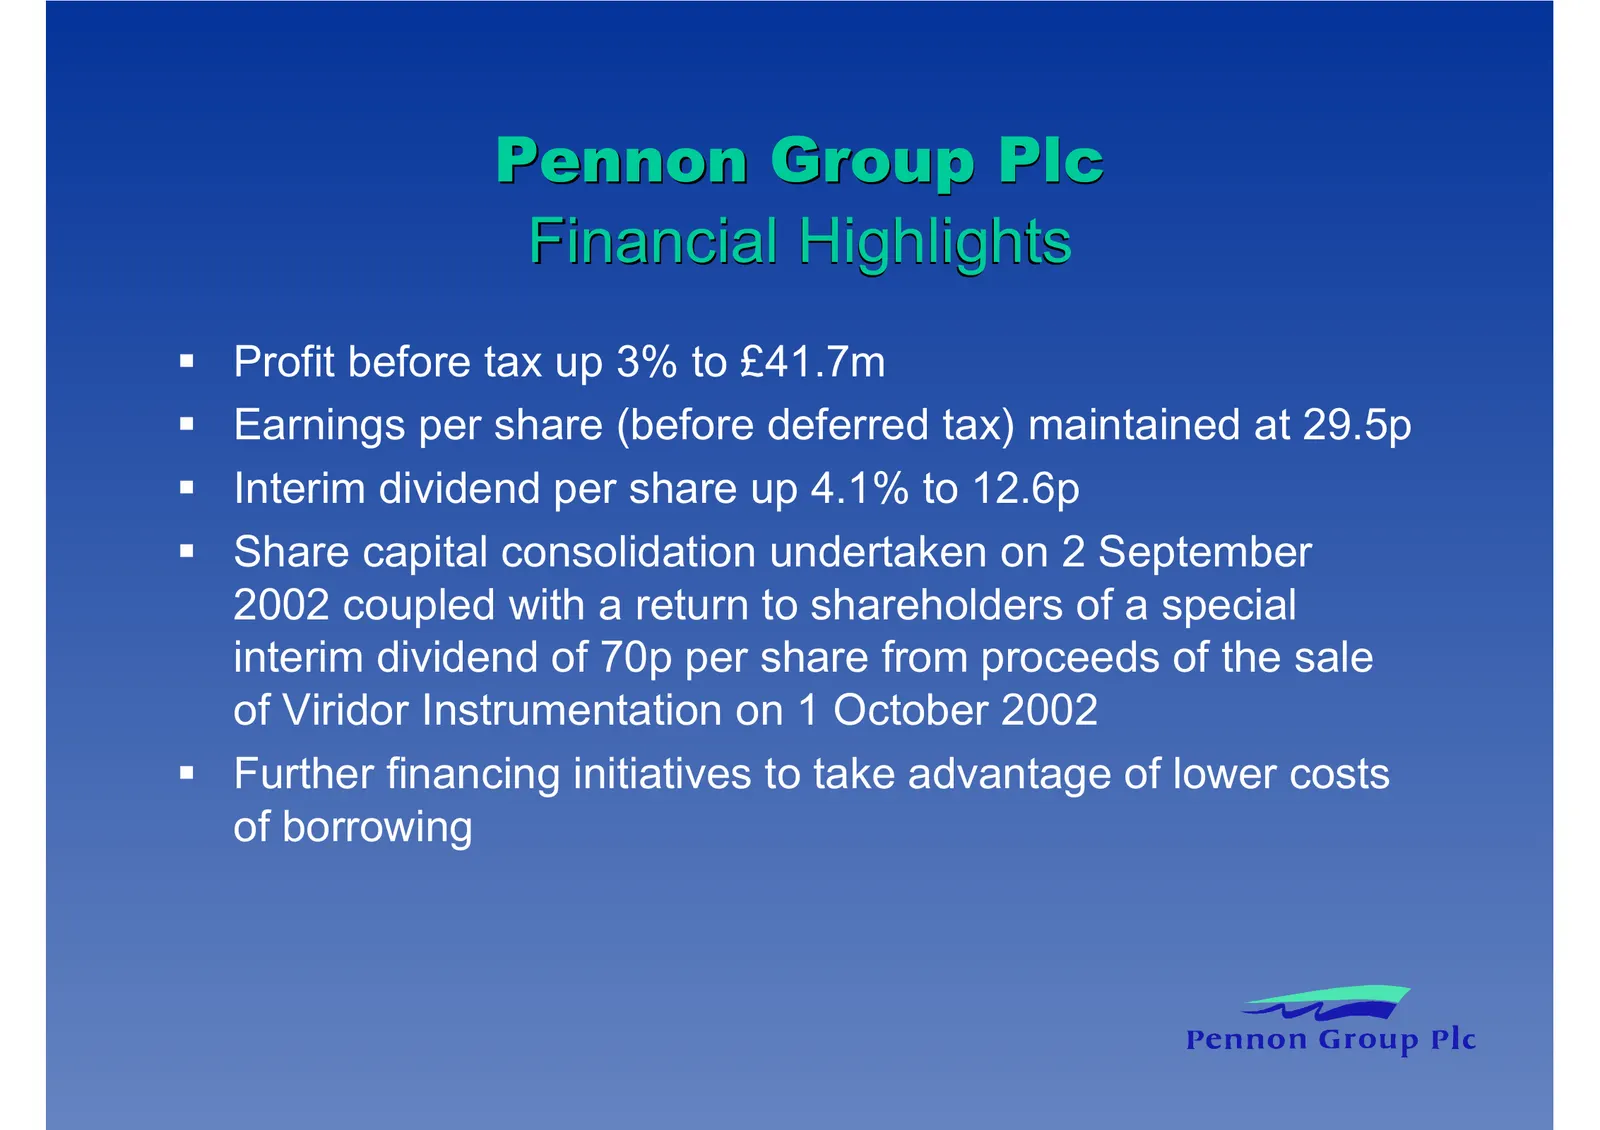
Slide 2: Financial Highlights
Pennon Group Plc Financial Highlights Profit before tax up 3% to £41.7m Earnings per share (before deferred tax) maintained at 29.5p Interim dividend per share up 4.1% to 12.6p Share capital consolidation undertaken on 2 September 2002 coupled with a return to shareholders of a special interim divid
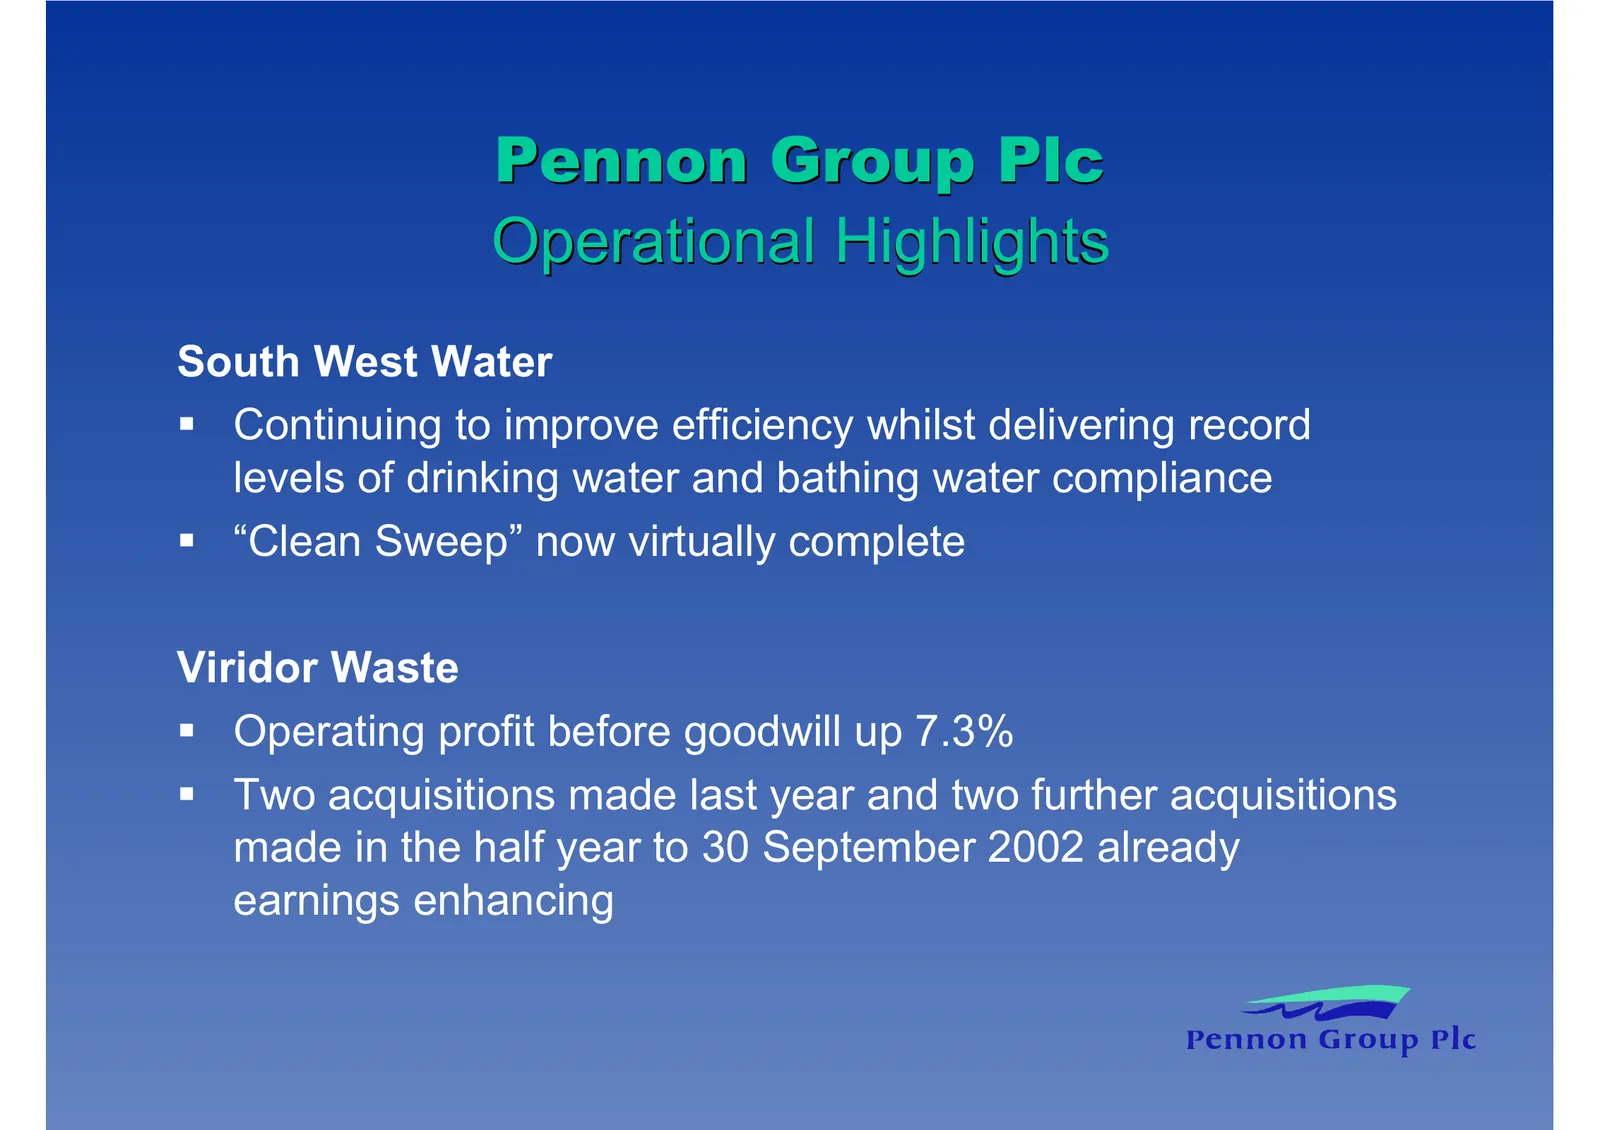
Slide 3: Operational Highlights
Pennon Group Plc Operational Highlights South West Water Continuing to improve efficiency whilst delivering record levels of drinking water and bathing water compliance “Clean Sweep” now virtually complete Viridor Waste Operating profit before goodwill up 7.3% Two acquisitions made last year and two
Slide 4: Pennon Group Plc
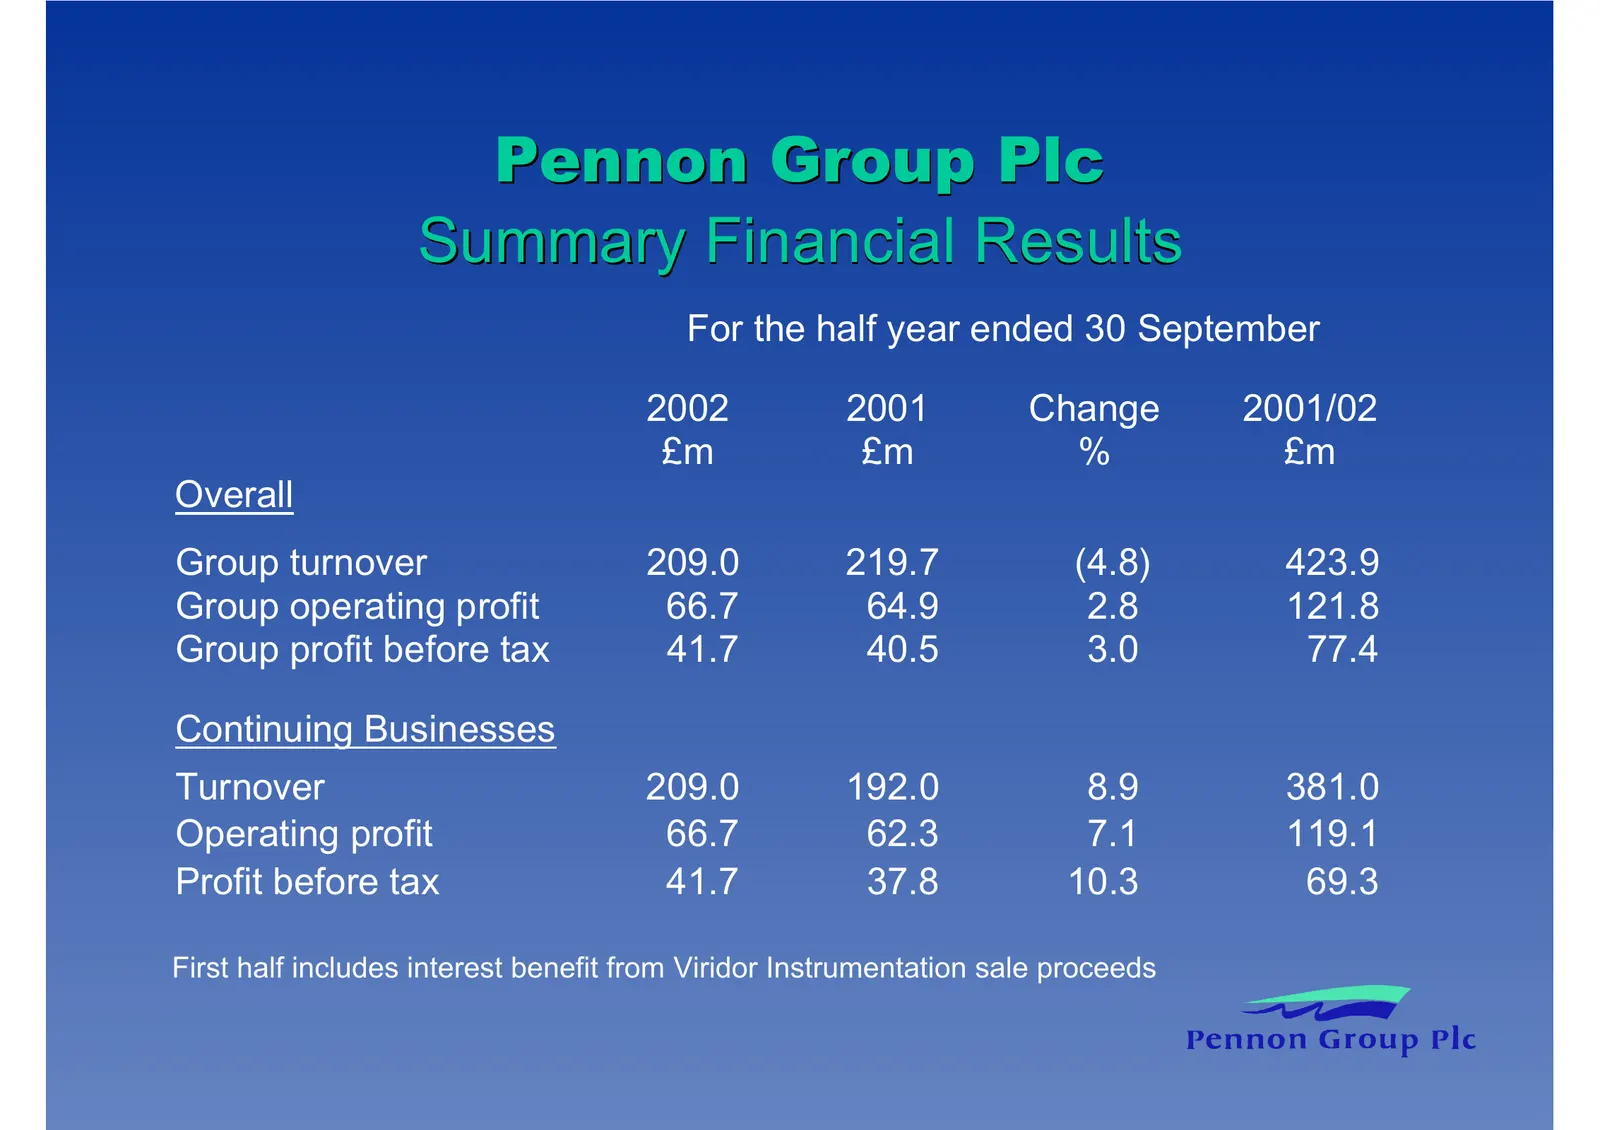
Slide 5: Summary Financial Results
Pennon Group Plc Summary Financial Results For the half year ended 30 September 2002 2001 Change 2001/02 £m £m % £m Overall Group turnover 209.0 219.7 (4.8) 423.9 Group operating profit 66.7 64.9 2.8 121.8 Group profit before tax 41.7 40.5 3.0 77.4 Continuing Businesses Turnover 209.0 192.0 8.9 381.
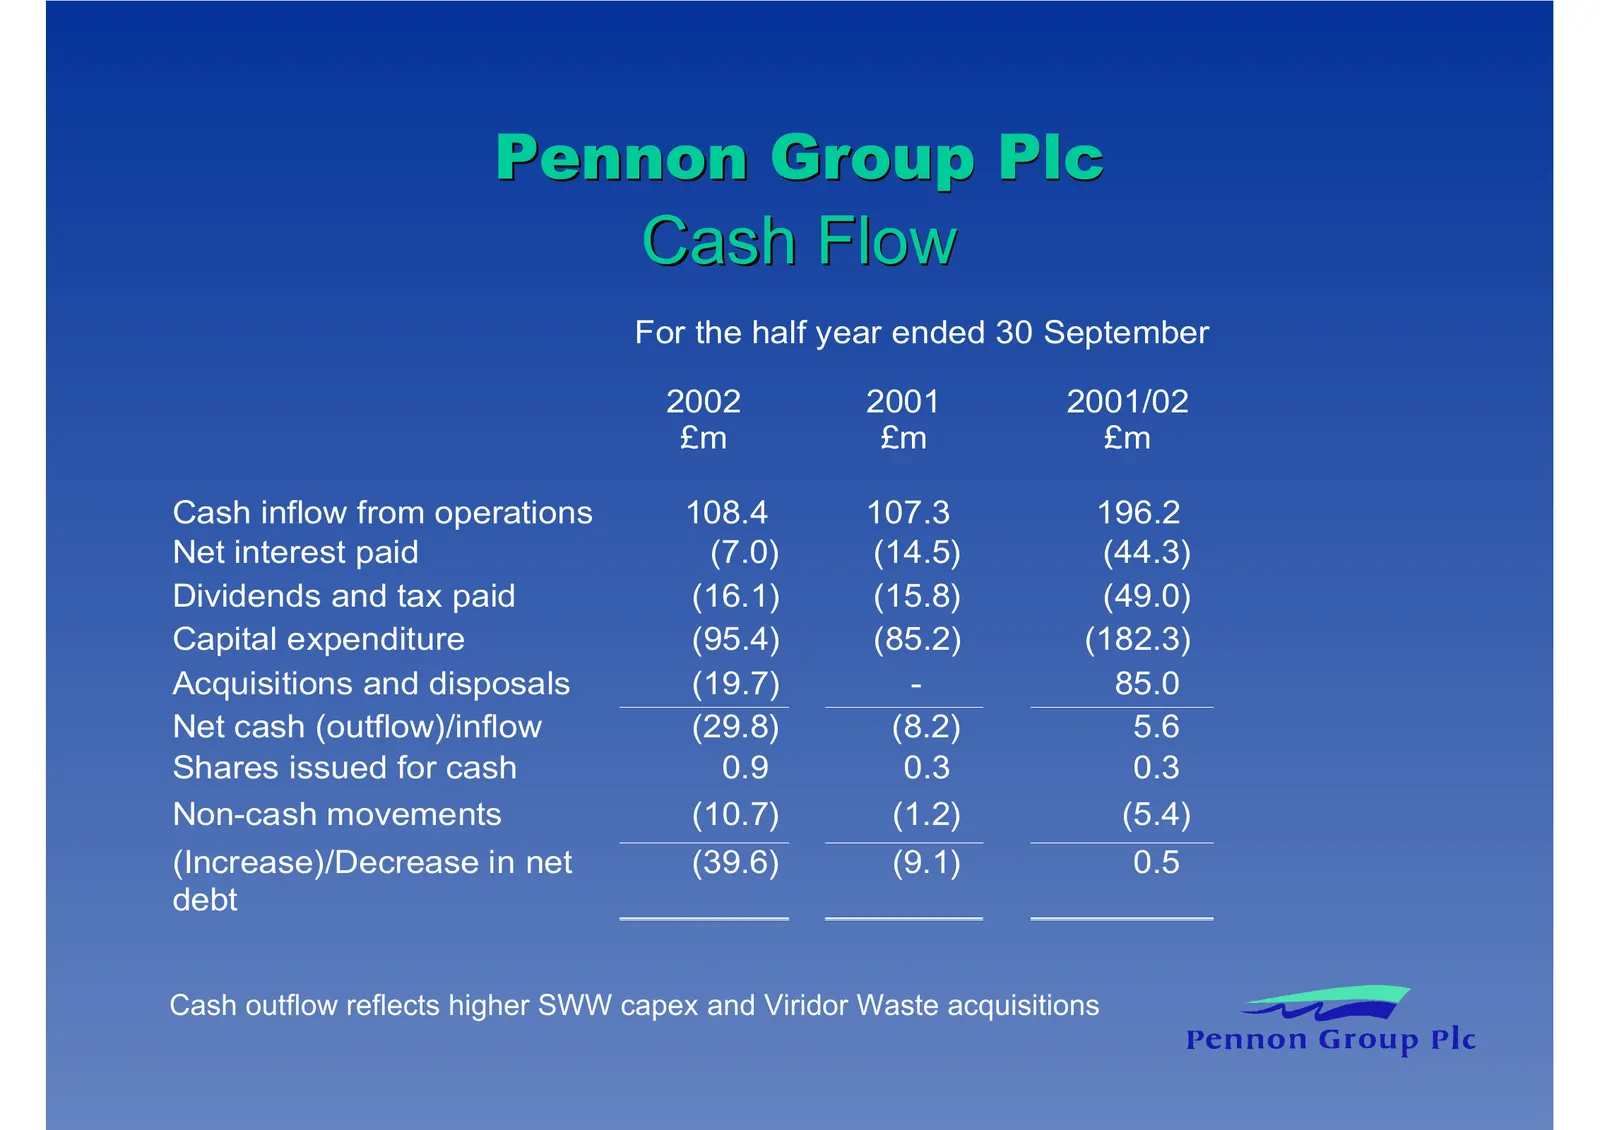
Slide 6: Cash Flow
Pennon Group Plc Cash Flow For the half year ended 30 September 2002 2001 2001/02 £m £m £m Cash inflow from operations 108.4 107.3 196.2 Net interest paid (7.0) (14.5) (44.3) Dividends and tax paid (16.1) (15.8) (49.0) Capital expenditure (95.4) (85.2) (182.3) Acquisitions and disposals (19.7) - 85.
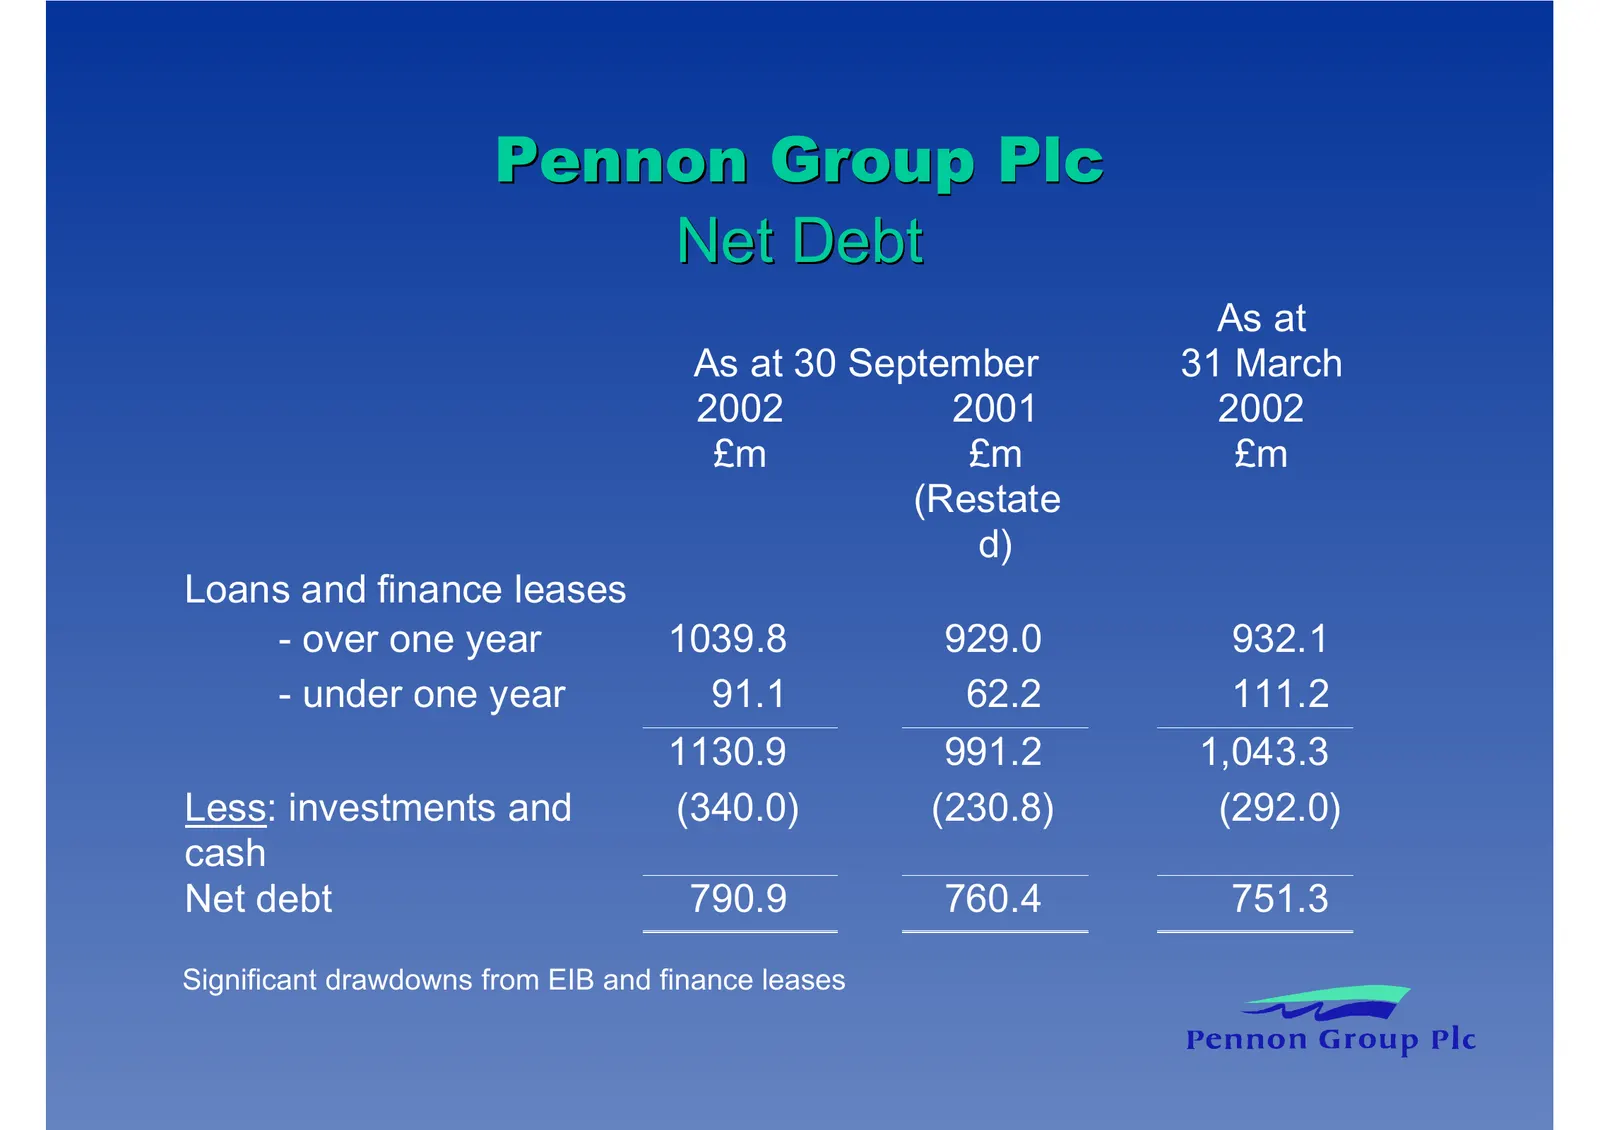
Slide 7: Net Debt
Pennon Group Plc Net Debt As at As at 30 September 31 March 2002 2001 2002 £m £m £m (Restate d) Loans and finance leases - over one year 1039.8 929.0 932.1 - under one year 91.1 62.2 111.2 1130.9 991.2 1,043.3 Less: investments and (340.0) (230.8) (292.0) cash Net debt 790.9 760.4 751.3 Significant
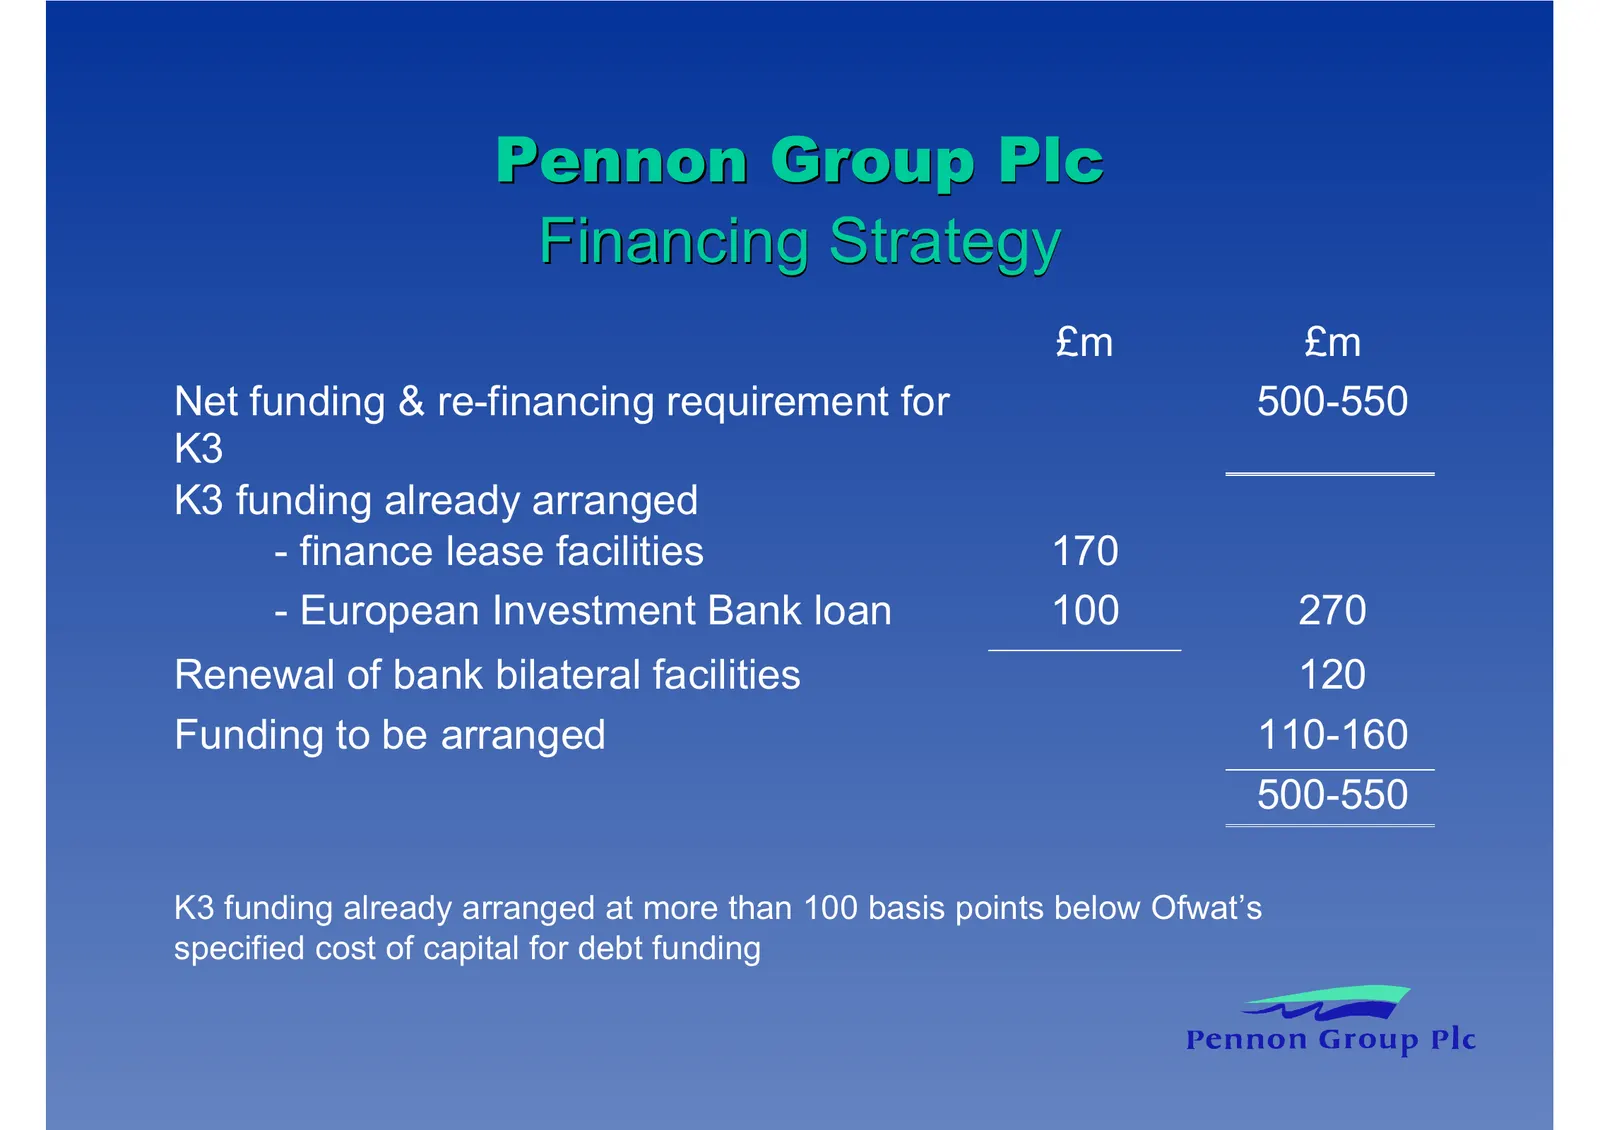
Slide 8: Financing Strategy
Pennon Group Plc Financing Strategy £m £m Net funding & re-financing requirement for 500-550 K3 K3 funding already arranged - finance lease facilities 170 - European Investment Bank loan 100 270 Renewal of bank bilateral facilities 120 Funding to be arranged 110-160 500-550 K3 funding already arrang
Slide 9: Net Interest Payable
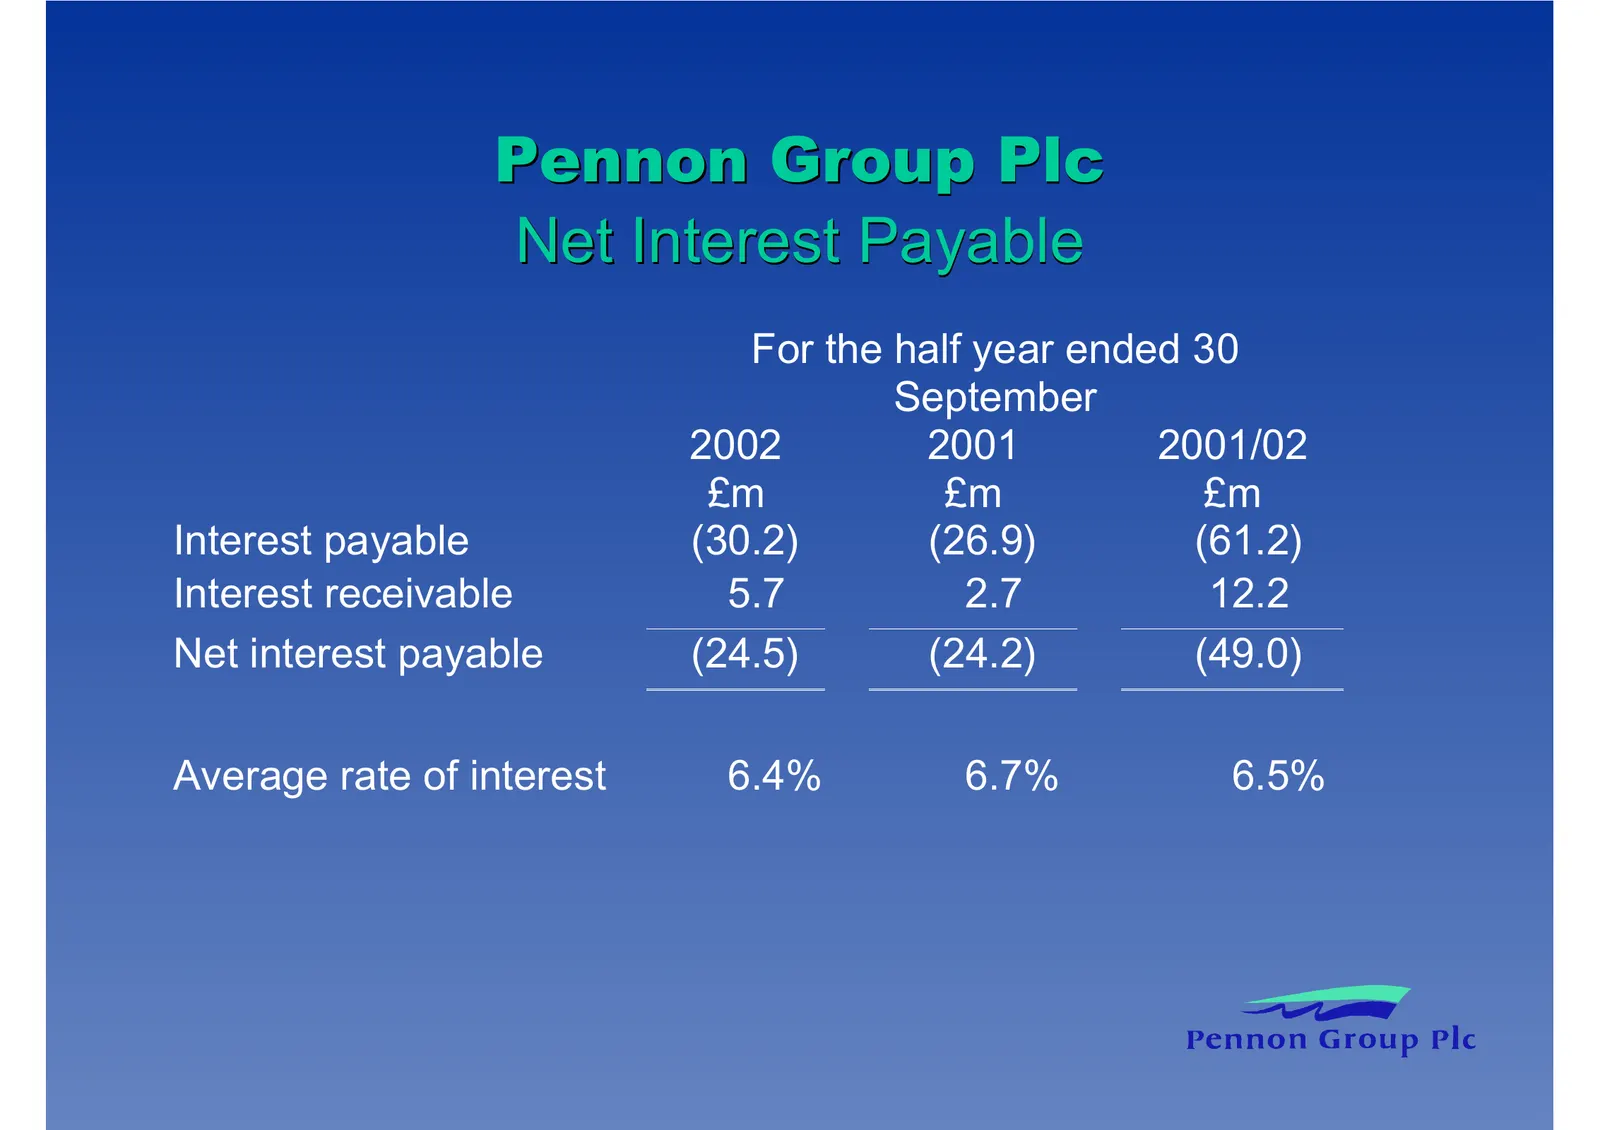
Pennon Group Plc Net Interest Payable For the half year ended 30 September 2002 2001 2001/02 £m £m £m Interest payable (30.2) (26.9) (61.2) Interest receivable 5.7 2.7 12.2 Net interest payable (24.5) (24.2) (49.0) Average rate of interest 6.4% 6.7% 6.5%
Slide 10: Financing Initiatives
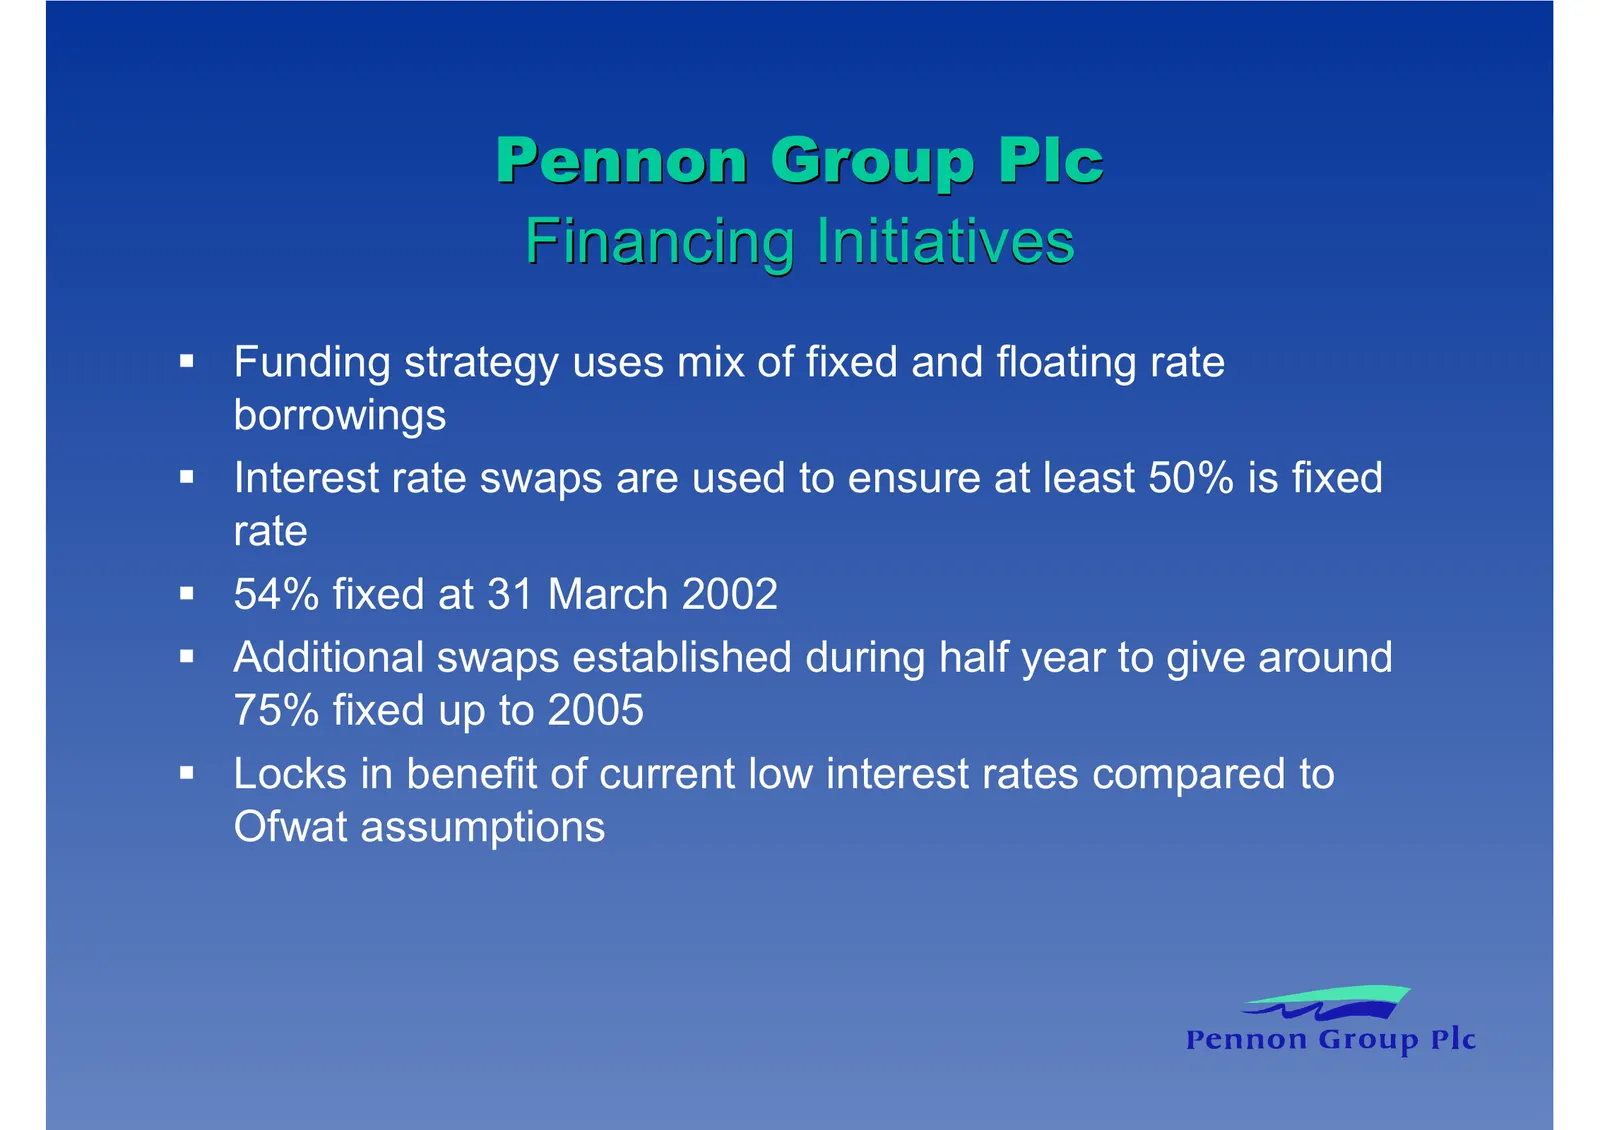
Pennon Group Plc Financing Initiatives Funding strategy uses mix of fixed and floating rate borrowings Interest rate swaps are used to ensure at least 50% is fixed rate 54% fixed at 31 March 2002 Additional swaps established during half year to give around 75% fixed up to 2005 Locks in benefit of cu
Slide 11: Depreciation
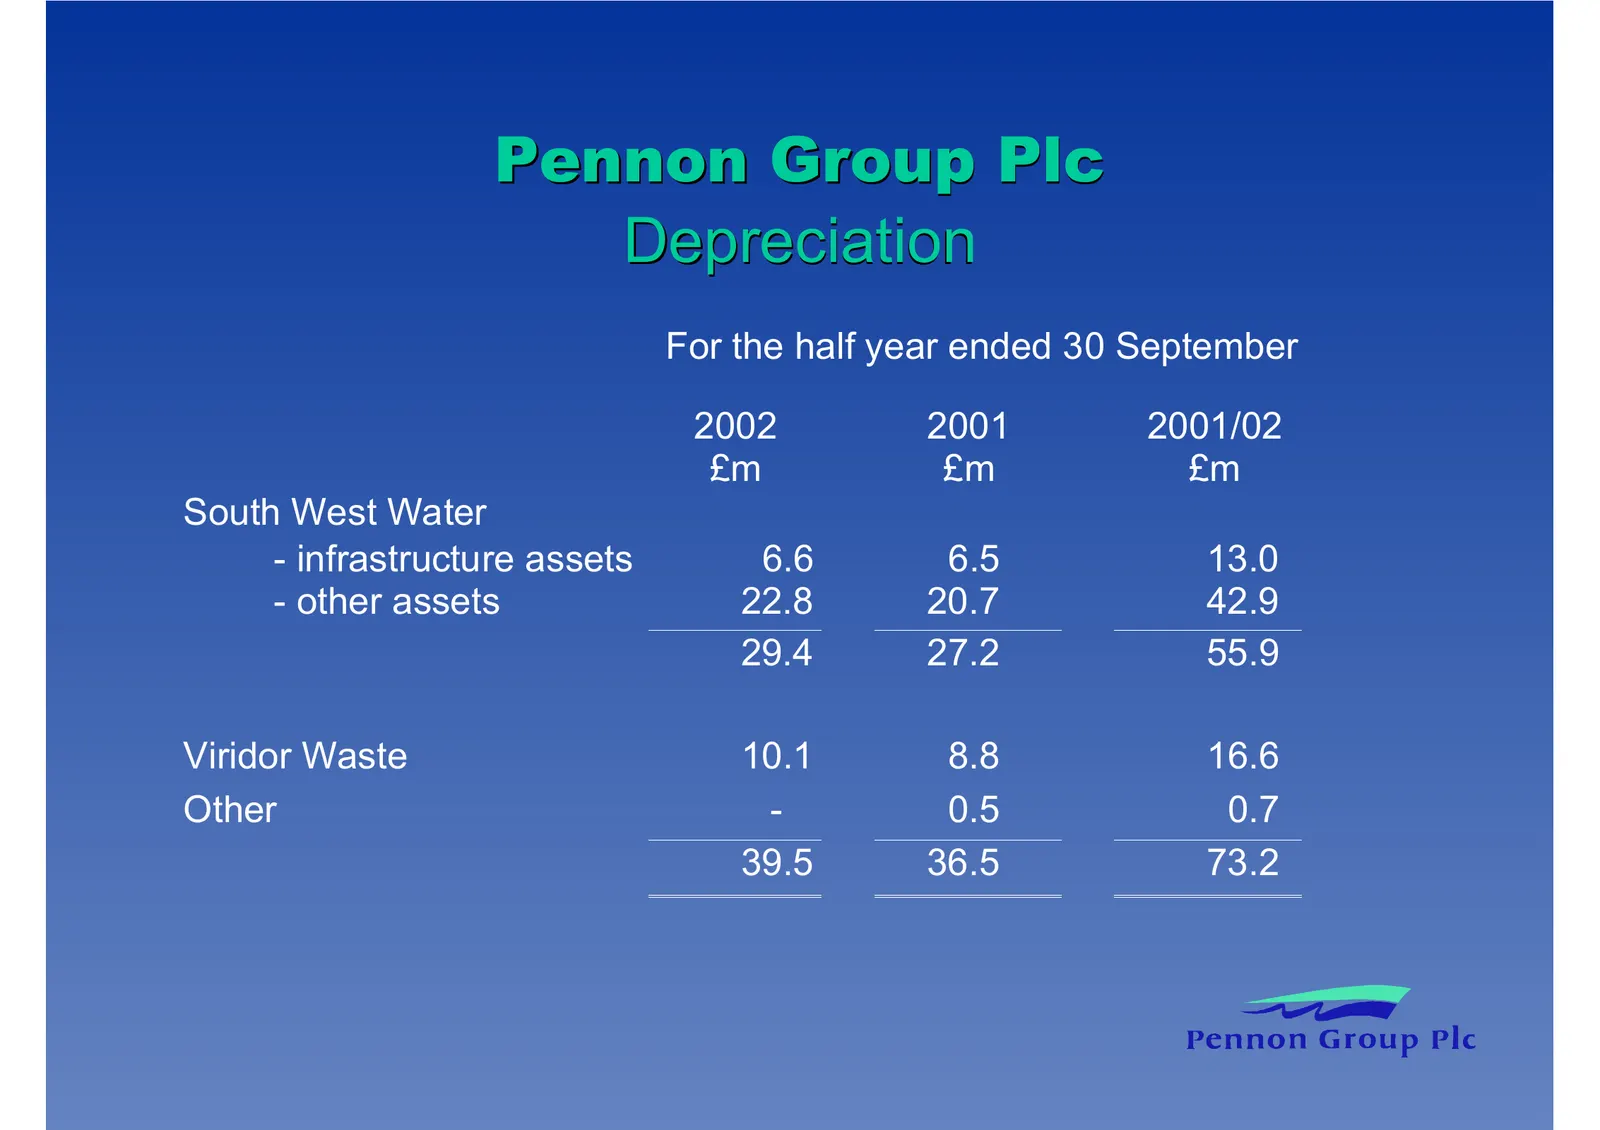
Pennon Group Plc Depreciation For the half year ended 30 September 2002 2001 2001/02 £m £m £m South West Water - infrastructure assets 6.6 6.5 13.0 - other assets 22.8 20.7 42.9 29.4 27.2 55.9 Viridor Waste 10.1 8.8 16.6 Other - 0.5 0.7 39.5 36.5 73.2
Slide 12: Taxation
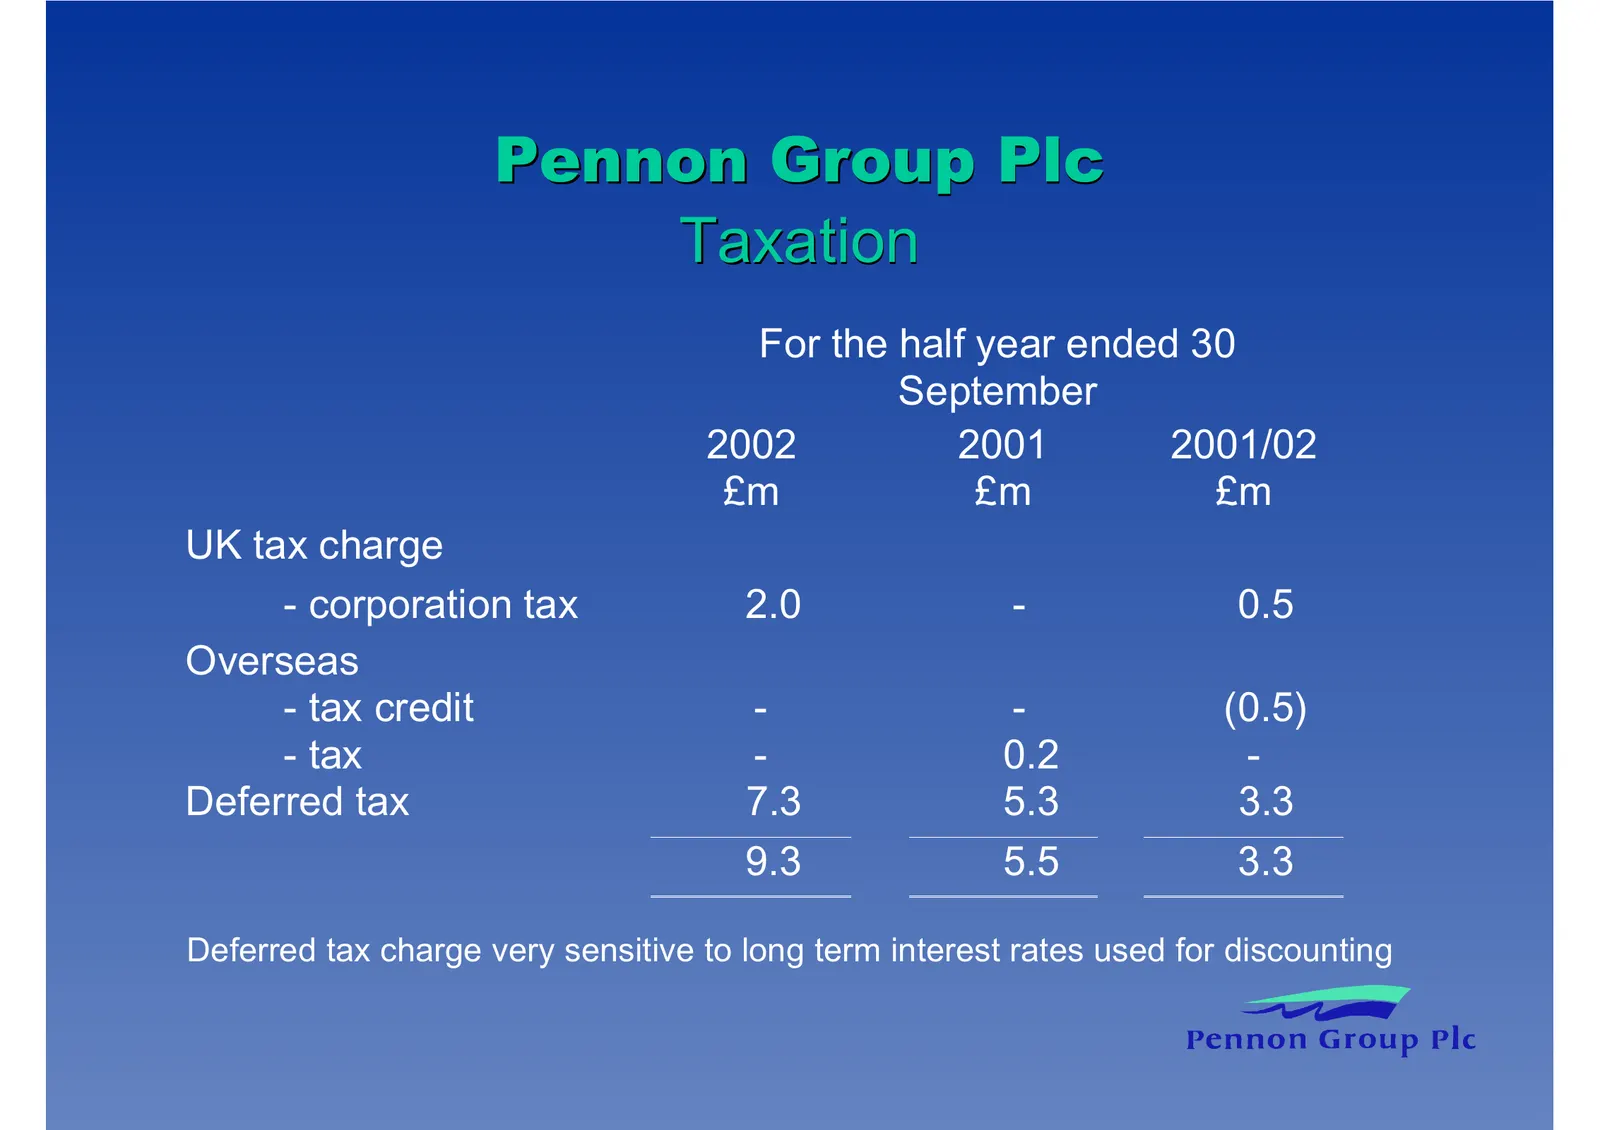
Pennon Group Plc Taxation For the half year ended 30 September 2002 2001 2001/02 £m £m £m UK tax charge - corporation tax 2.0 - 0.5 Overseas - tax credit - - (0.5) - tax - 0.2 - Deferred tax 7.3 5.3 3.3 9.3 5.5 3.3 Deferred tax charge very sensitive to long term interest rates used for discounting
Slide 13: Key Financial Ratios
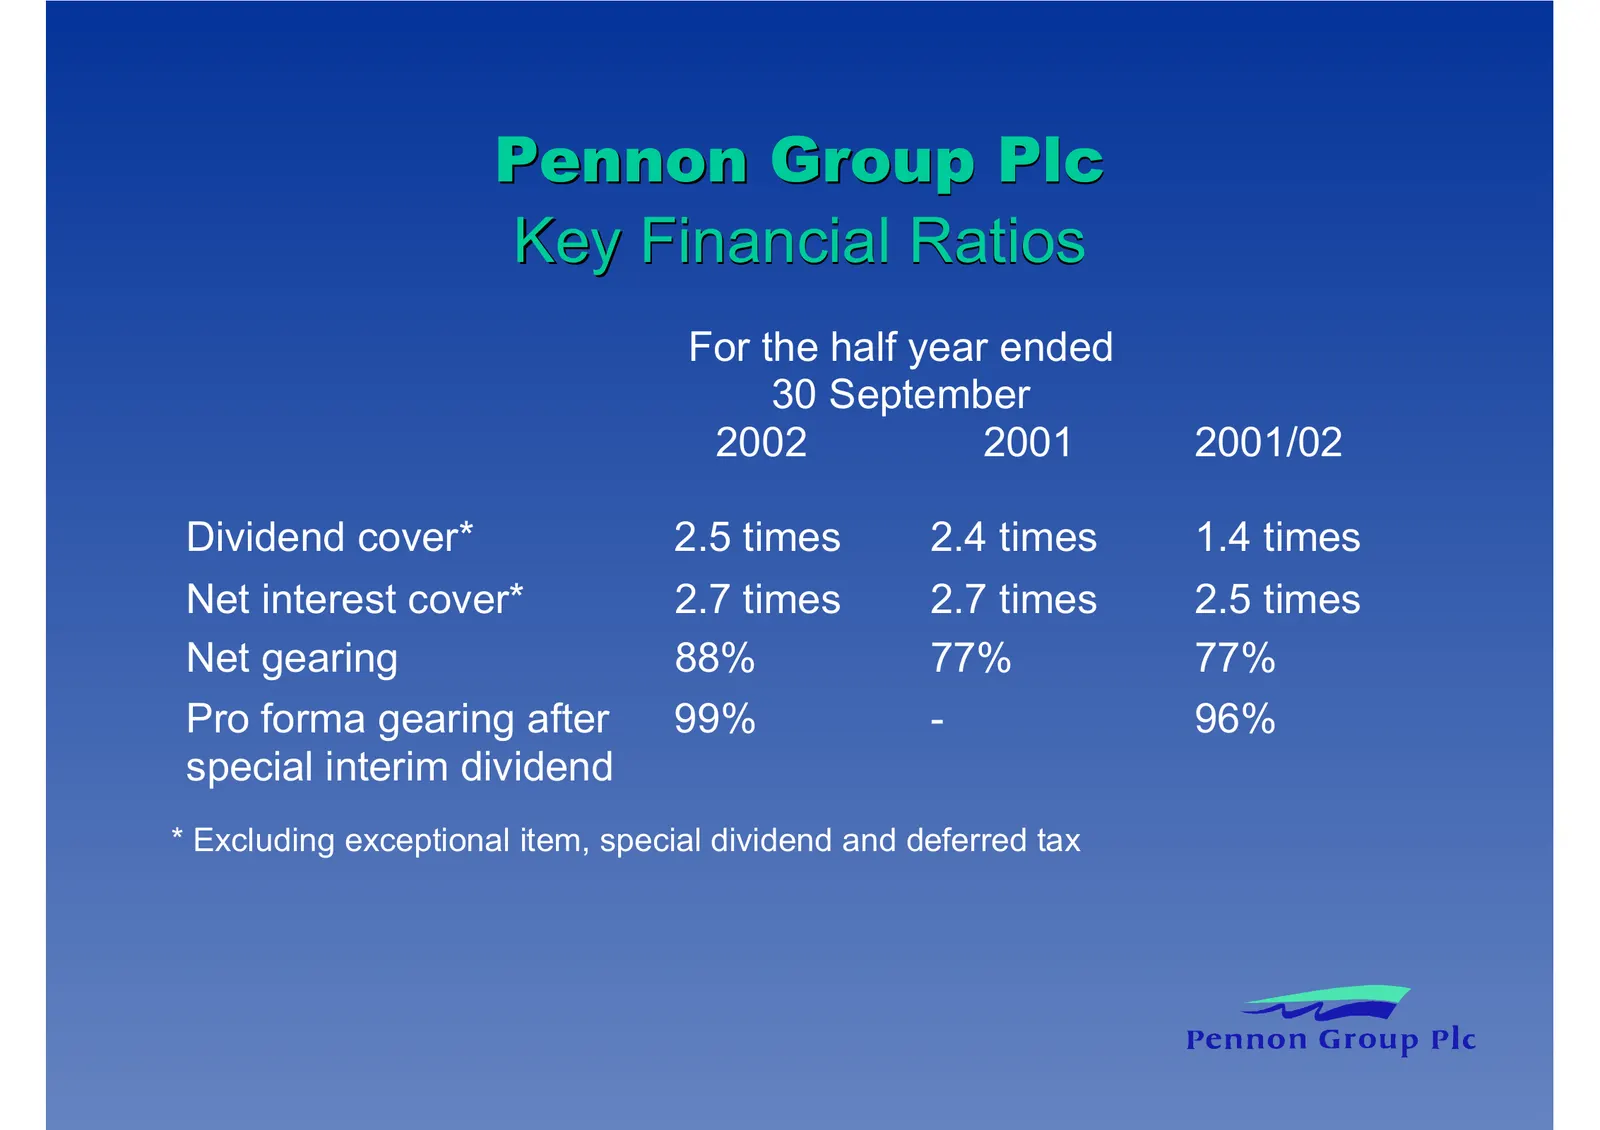
Pennon Group Plc Key Financial Ratios For the half year ended 30 September 2002 2001 2001/02 Dividend cover* 2.5 times 2.4 times 1.4 times Net interest cover* 2.7 times 2.7 times 2.5 times Net gearing 88% 77% 77% Pro forma gearing after 99% - 96% special interim dividend * Excluding exceptional item
Slide 14: Dividends
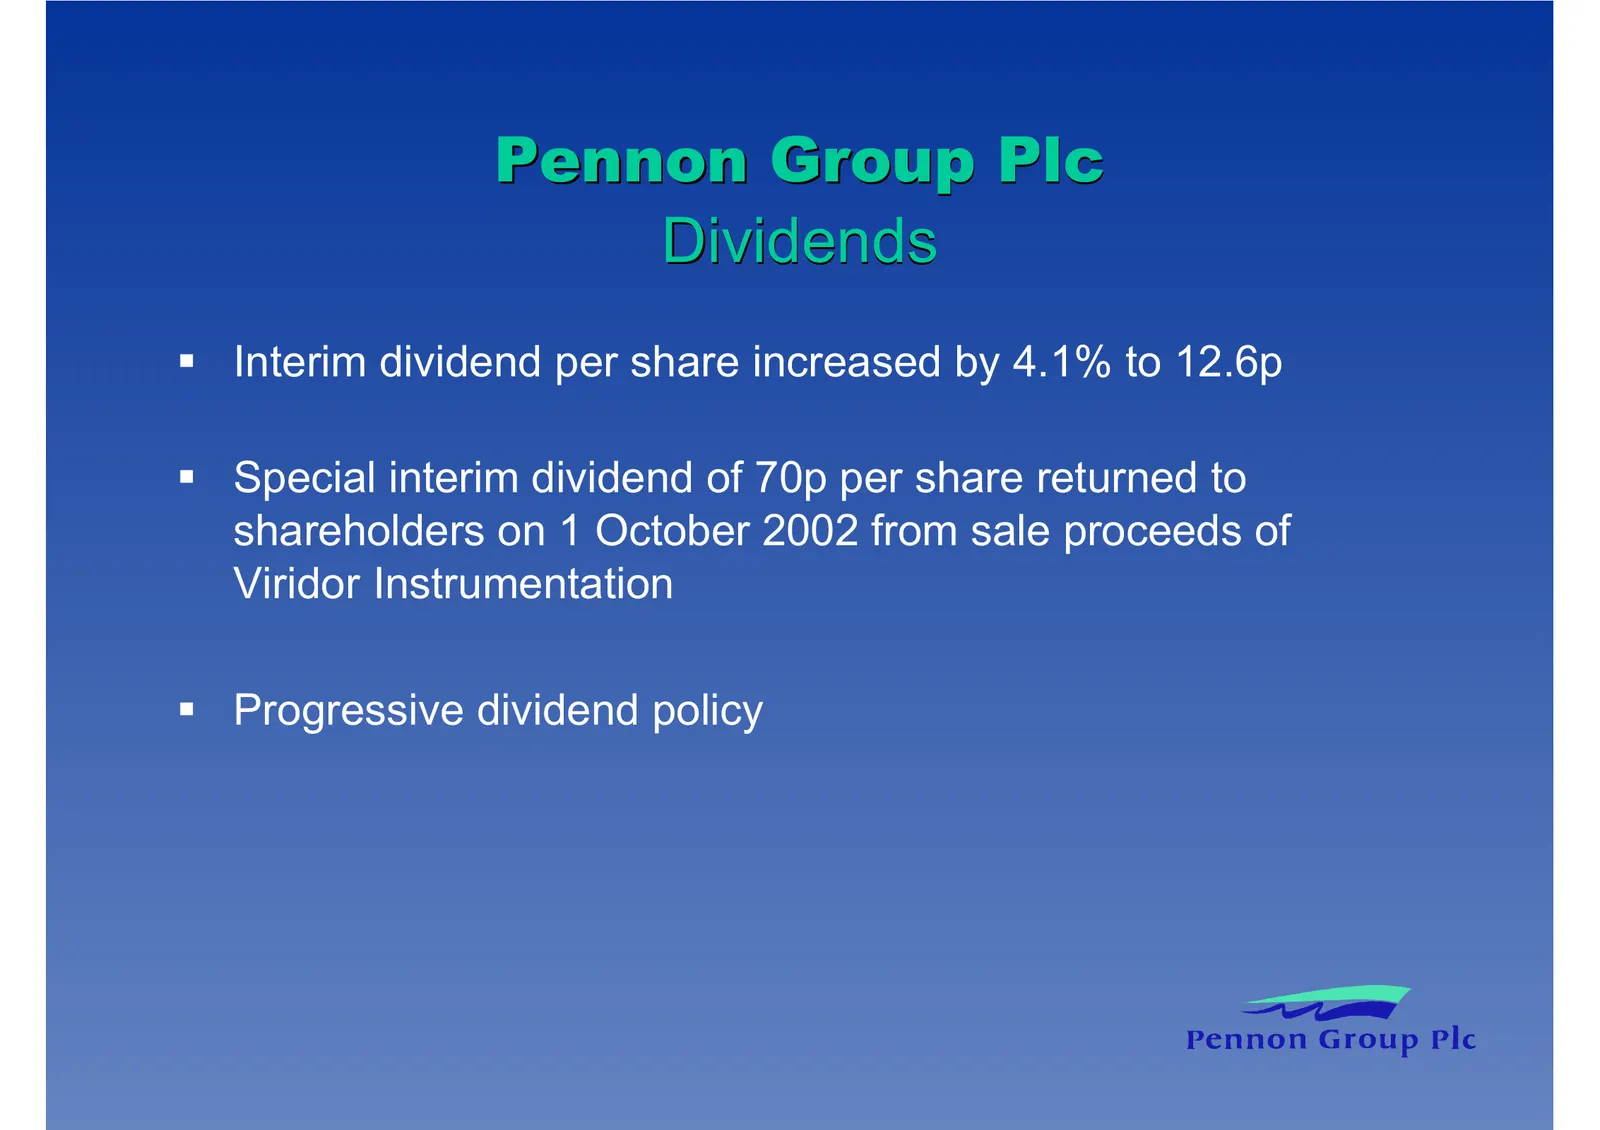
Pennon Group Plc Dividends Interim dividend per share increased by 4.1% to 12.6p Special interim dividend of 70p per share returned to shareholders on 1 October 2002 from sale proceeds of Viridor Instrumentation Progressive dividend policy
Slide 15: South West Water
Slide 16: South West Water Financial Performance Summary
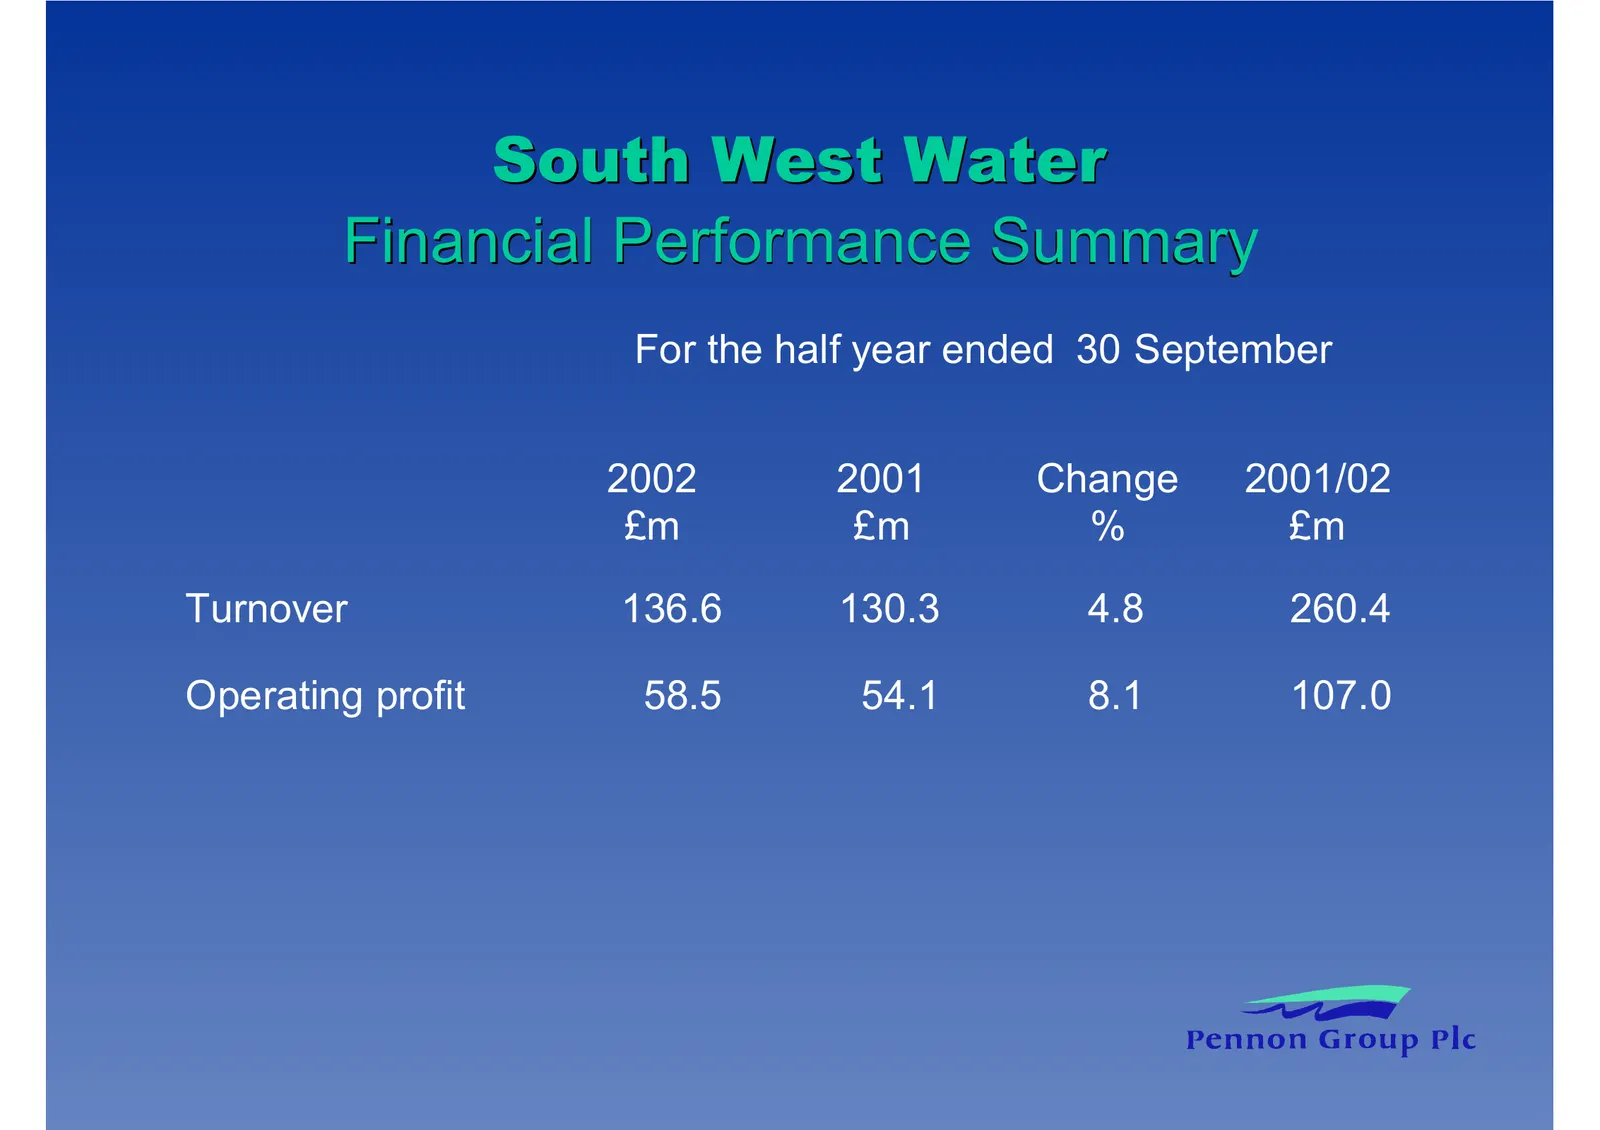
South West Water Financial Performance Summary For the half year ended 30 September 2002 2001 Change 2001/02 £m £m % £m Turnover 136.6 130.3 4.8 260.4 Operating profit 58.5 54.1 8.1 107.0
Slide 17: South West Water Turnover
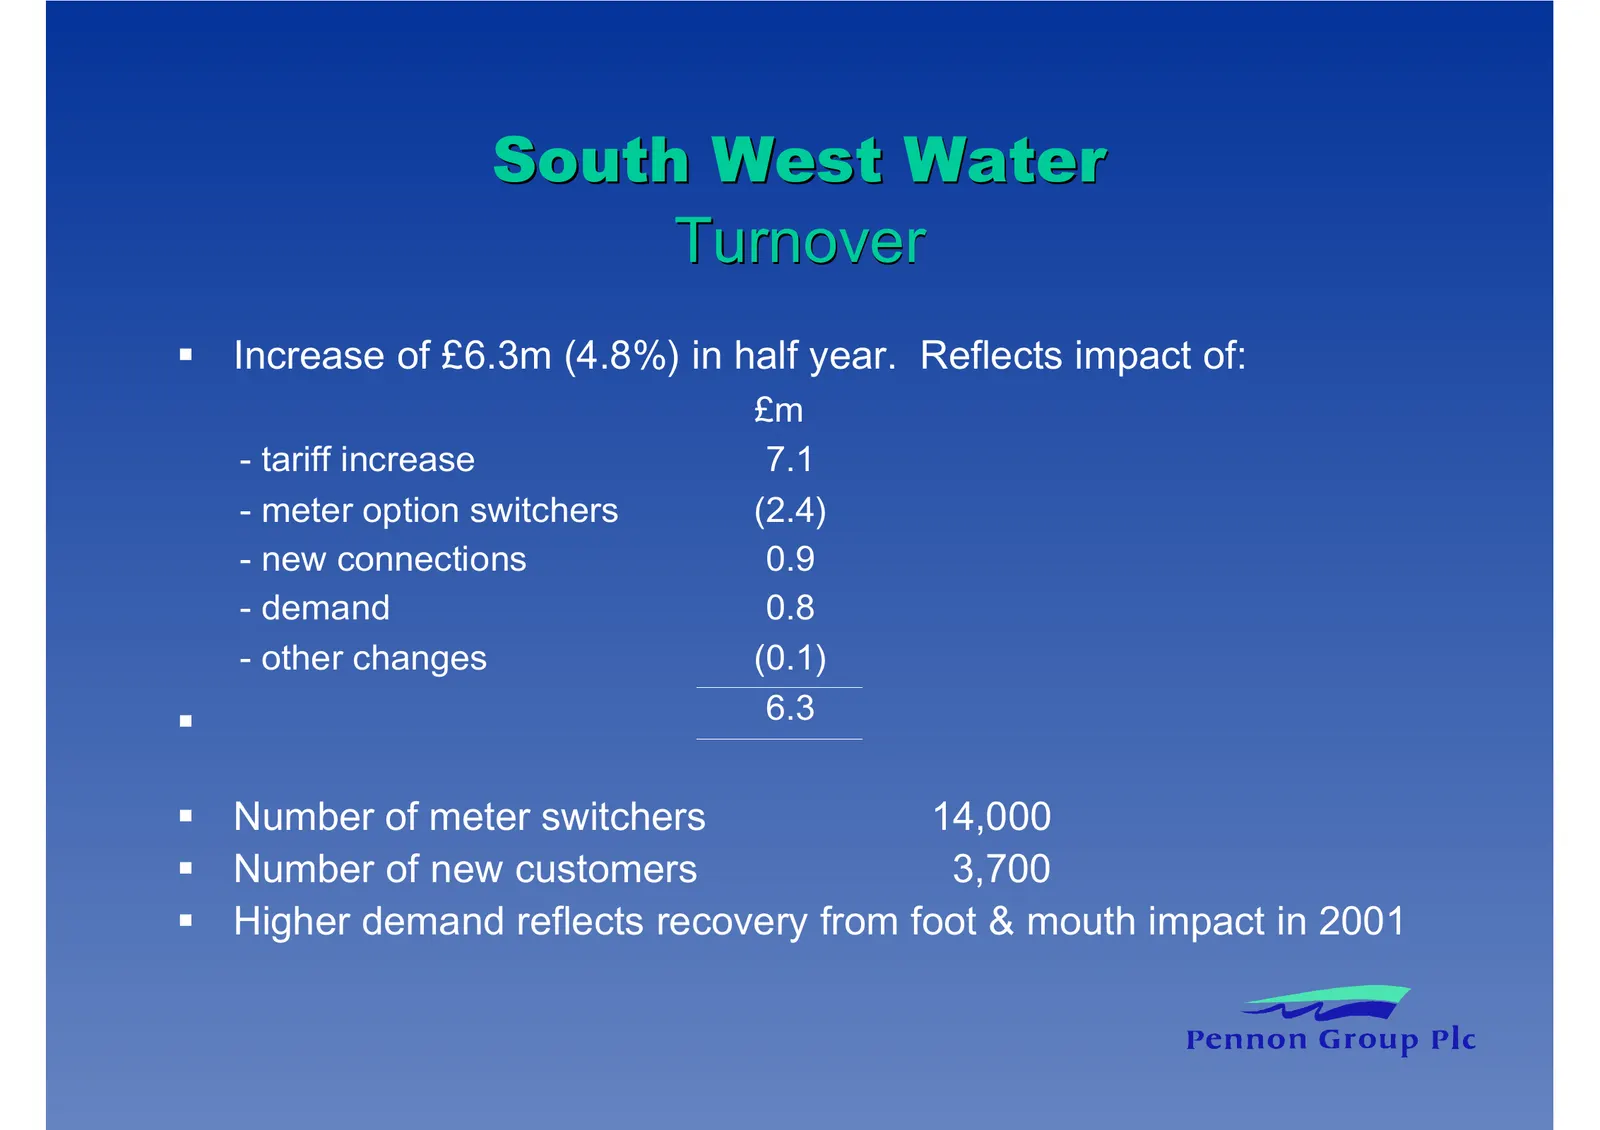
South West Water Turnover Increase of £6.3m (4.8%) in half year. Reflects impact of: £m - tariff increase 7.1 - meter option switchers (2.4) - new connections 0.9 - demand 0.8 - other changes (0.1) 6.3 Number of meter switchers 14,000 Number of new customers 3,700 Higher demand reflects recovery fro
Slide 18: South West Water Operating Costs
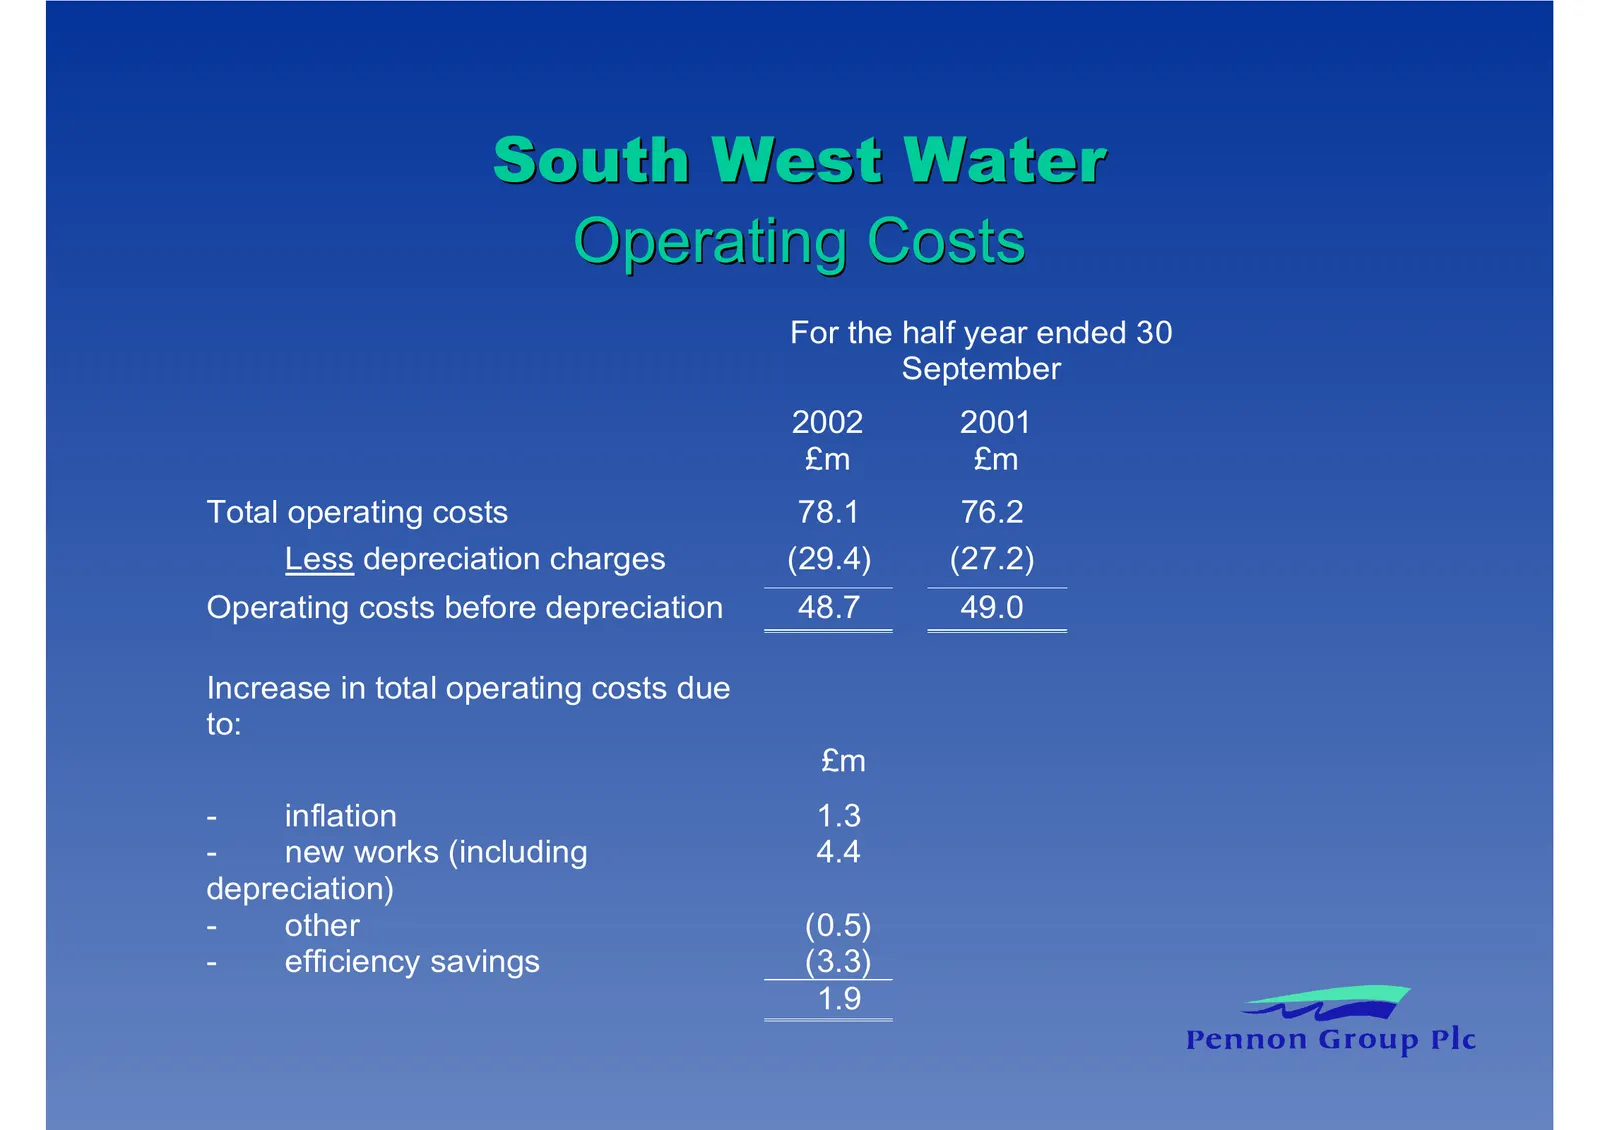
South West Water Operating Costs For the half year ended 30 September 2002 2001 £m £m Total operating costs 78.1 76.2 Less depreciation charges (29.4) (27.2) Operating costs before depreciation 48.7 49.0 Increase in total operating costs due to: £m - inflation 1.3 - new works (including 4.4 deprecia
Slide 19: Analysis of Efficiency Savings
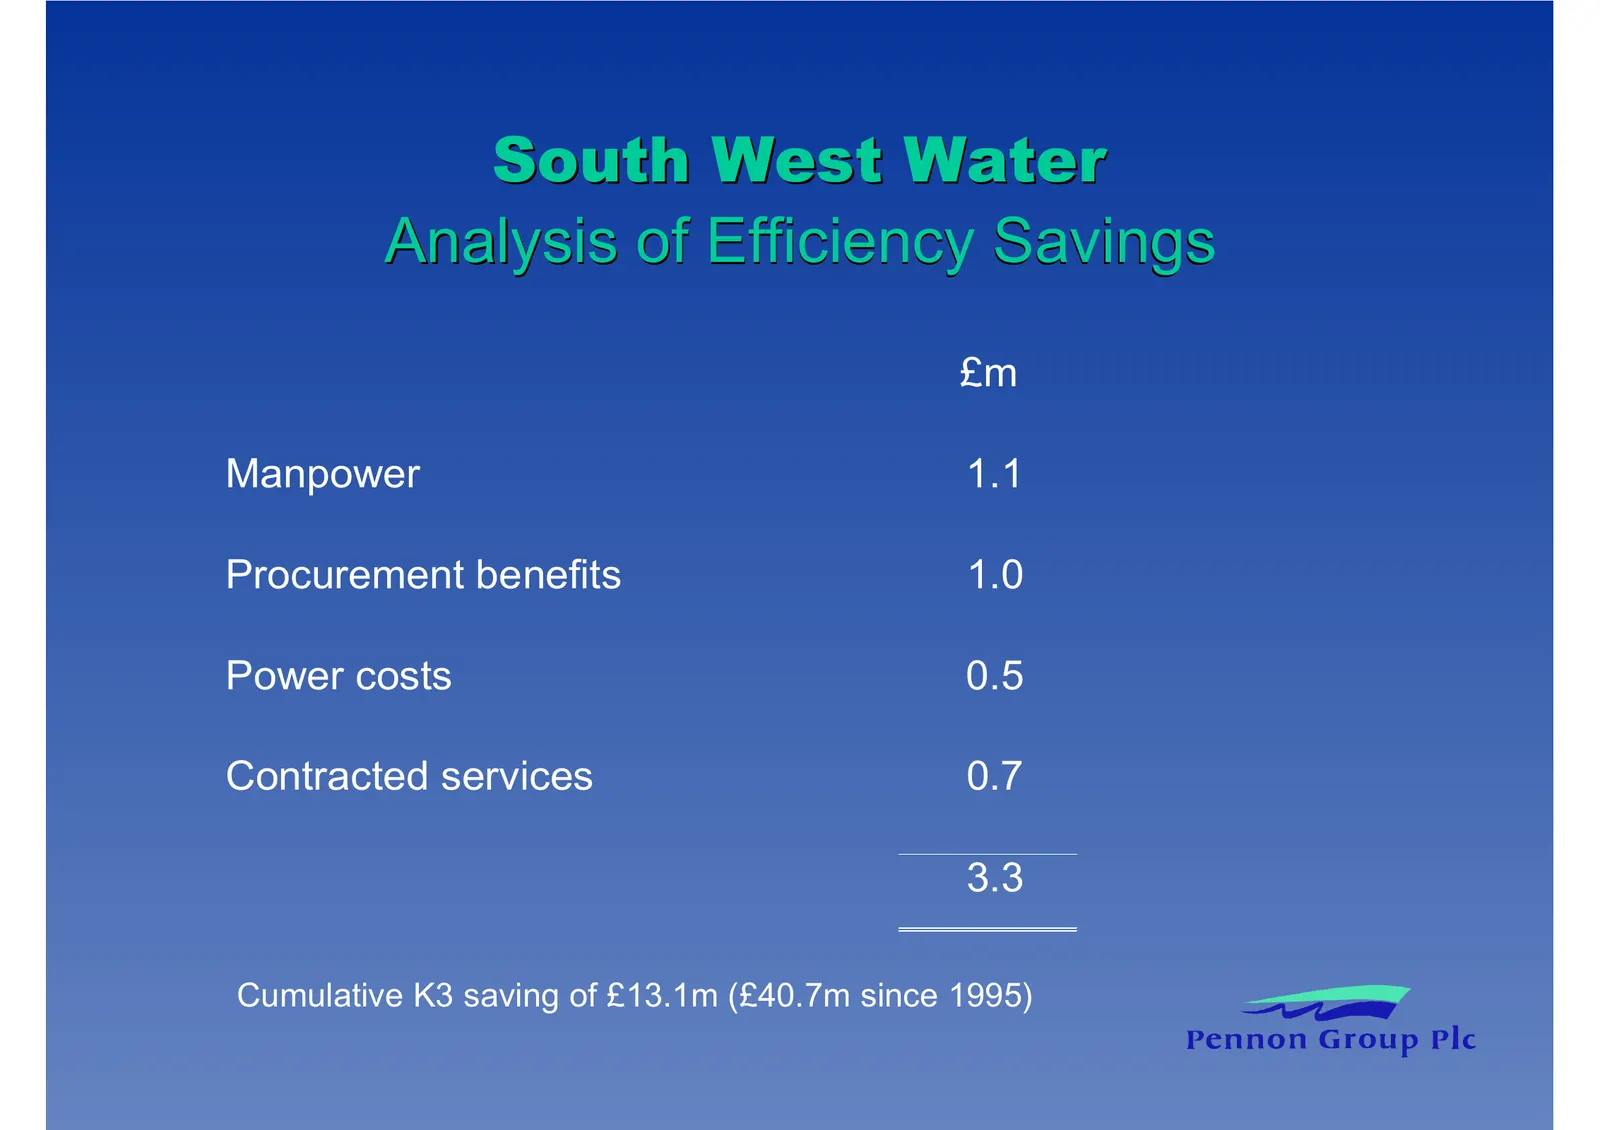
South West Water Analysis of Efficiency Savings £m Manpower 1.1 Procurement benefits 1.0 Power costs 0.5 Contracted services 0.7 3.3 Cumulative K3 saving of £13.1m (£40.7m since 1995)
Slide 20: Operational Performance Summary
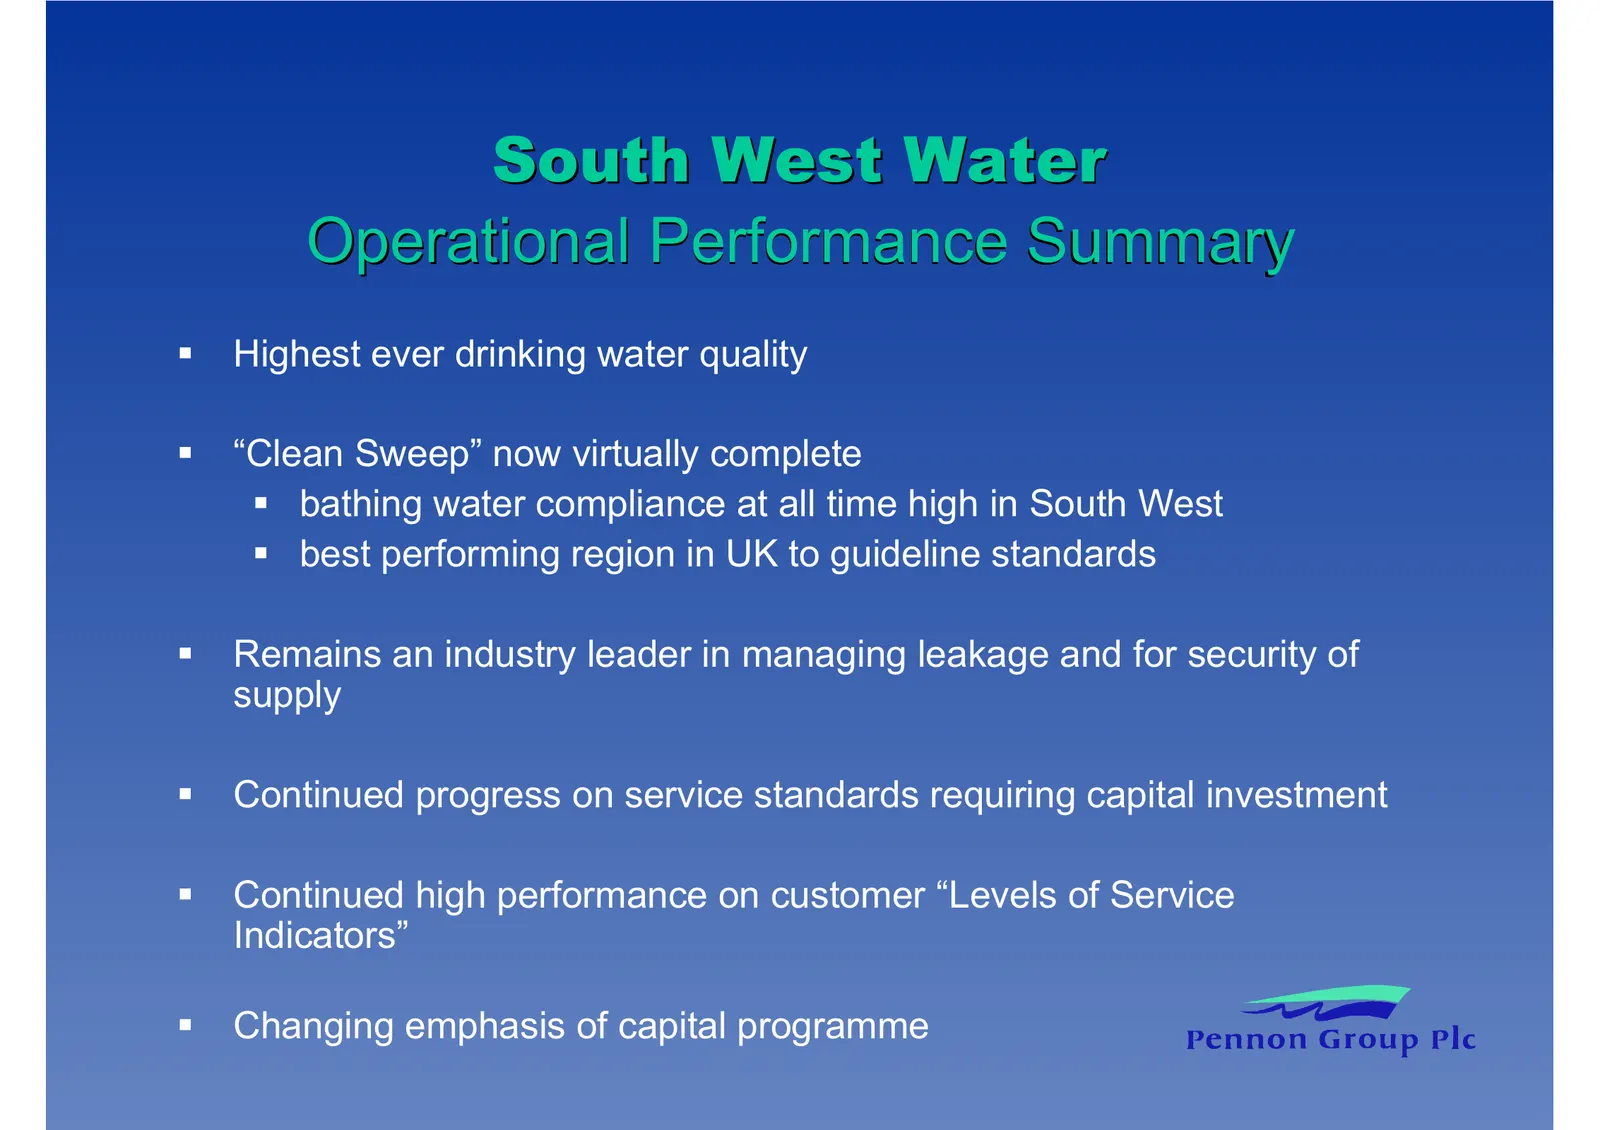
South West Water Operational Performance Summary Highest ever drinking water quality “Clean Sweep” now virtually complete bathing water compliance at all time high in South West best performing region in UK to guideline standards Remains an industry leader in managing leakage and for security of sup
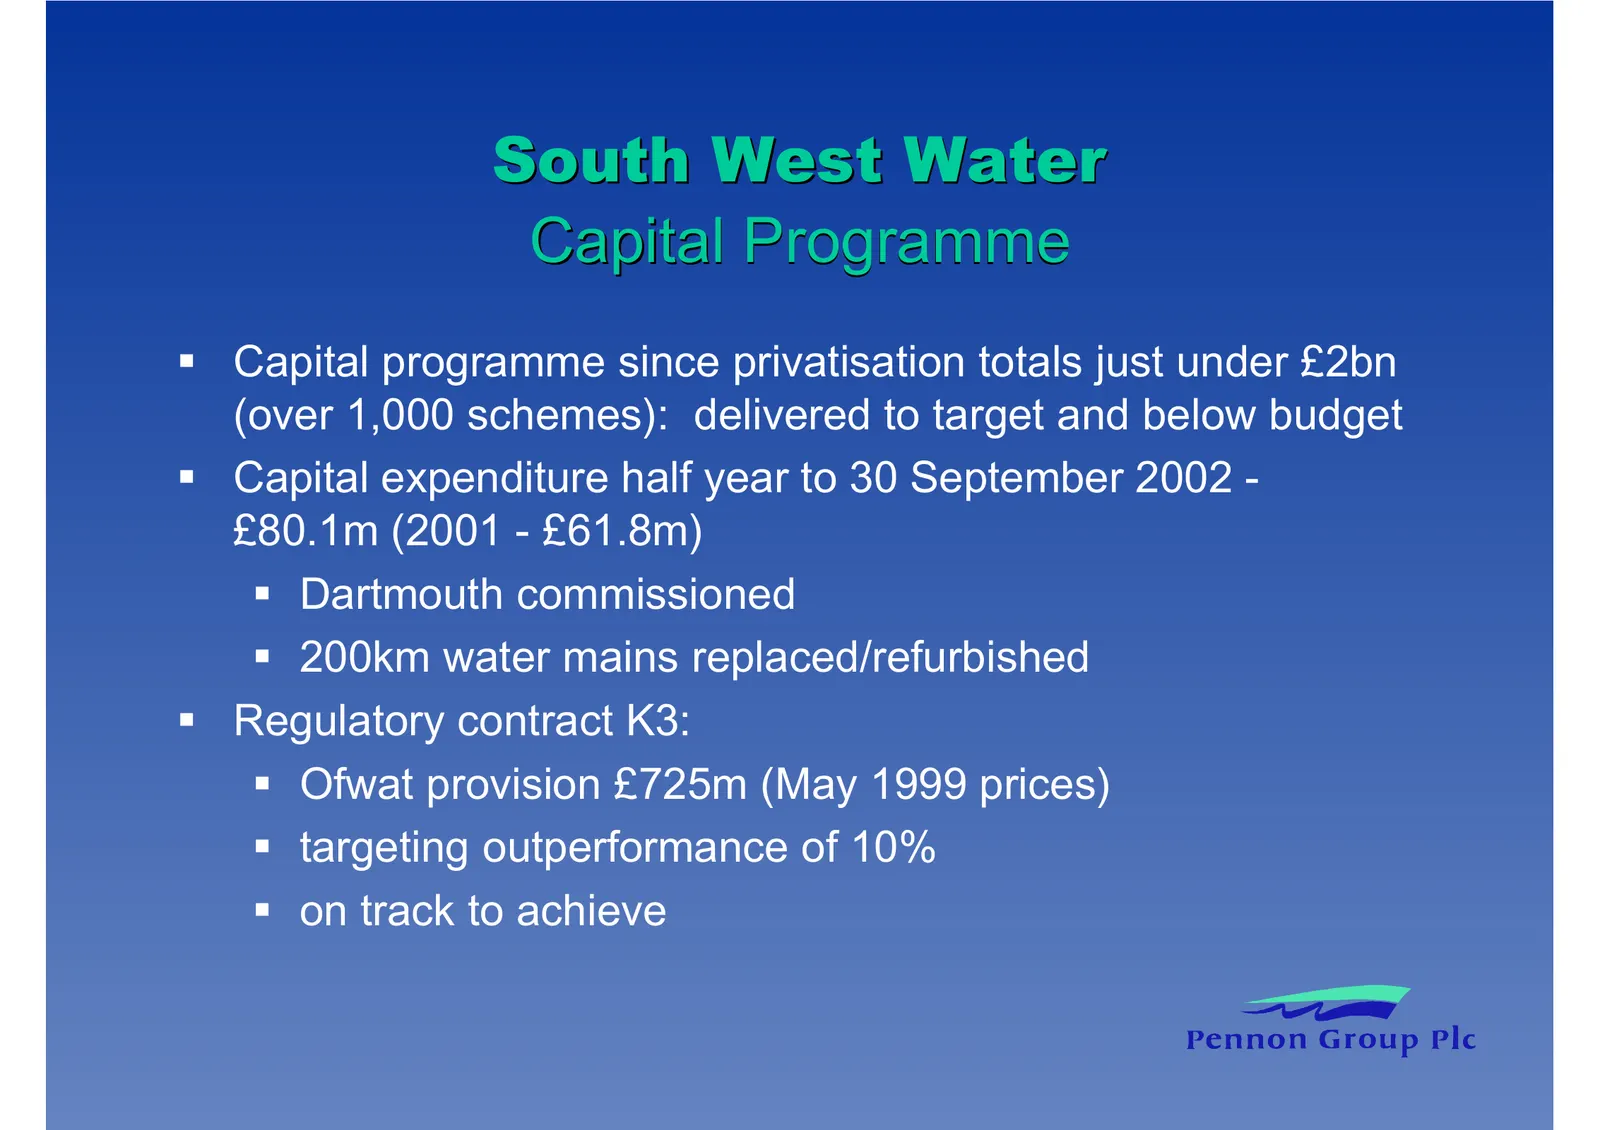
Slide 21: Capital Programme
South West Water Capital Programme Capital programme since privatisation totals just under £2bn (over 1,000 schemes): delivered to target and below budget Capital expenditure half year to 30 September 2002 - £80.1m (2001 - £61.8m) Dartmouth commissioned 200km water mains replaced/refurbished Regulat
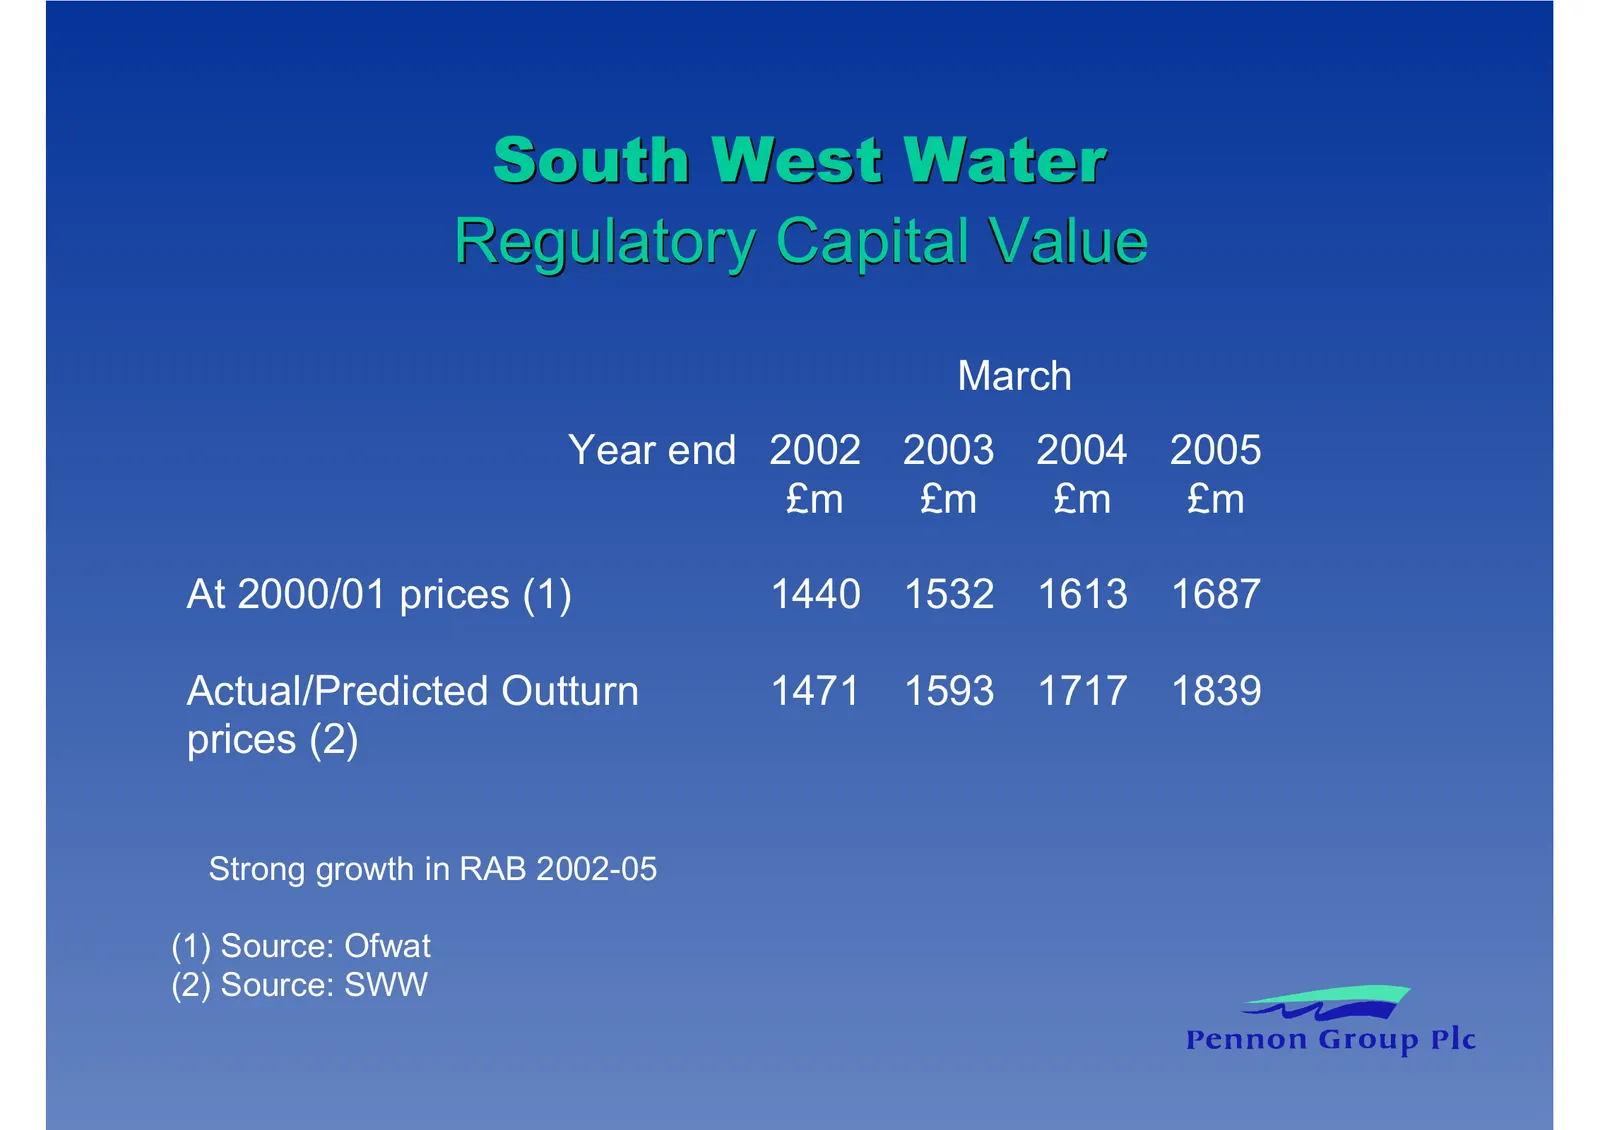
Slide 22: Regulatory Capital Value
South West Water Regulatory Capital Value March Year end 2002 2003 2004 2005 £m £m £m £m At 2000/01 prices (1) 1440 1532 1613 1687 Actual/Predicted Outturn 1471 1593 1717 1839 prices (2) Strong growth in RAB 2002-05 (1) Source: Ofwat (2) Source: SWW
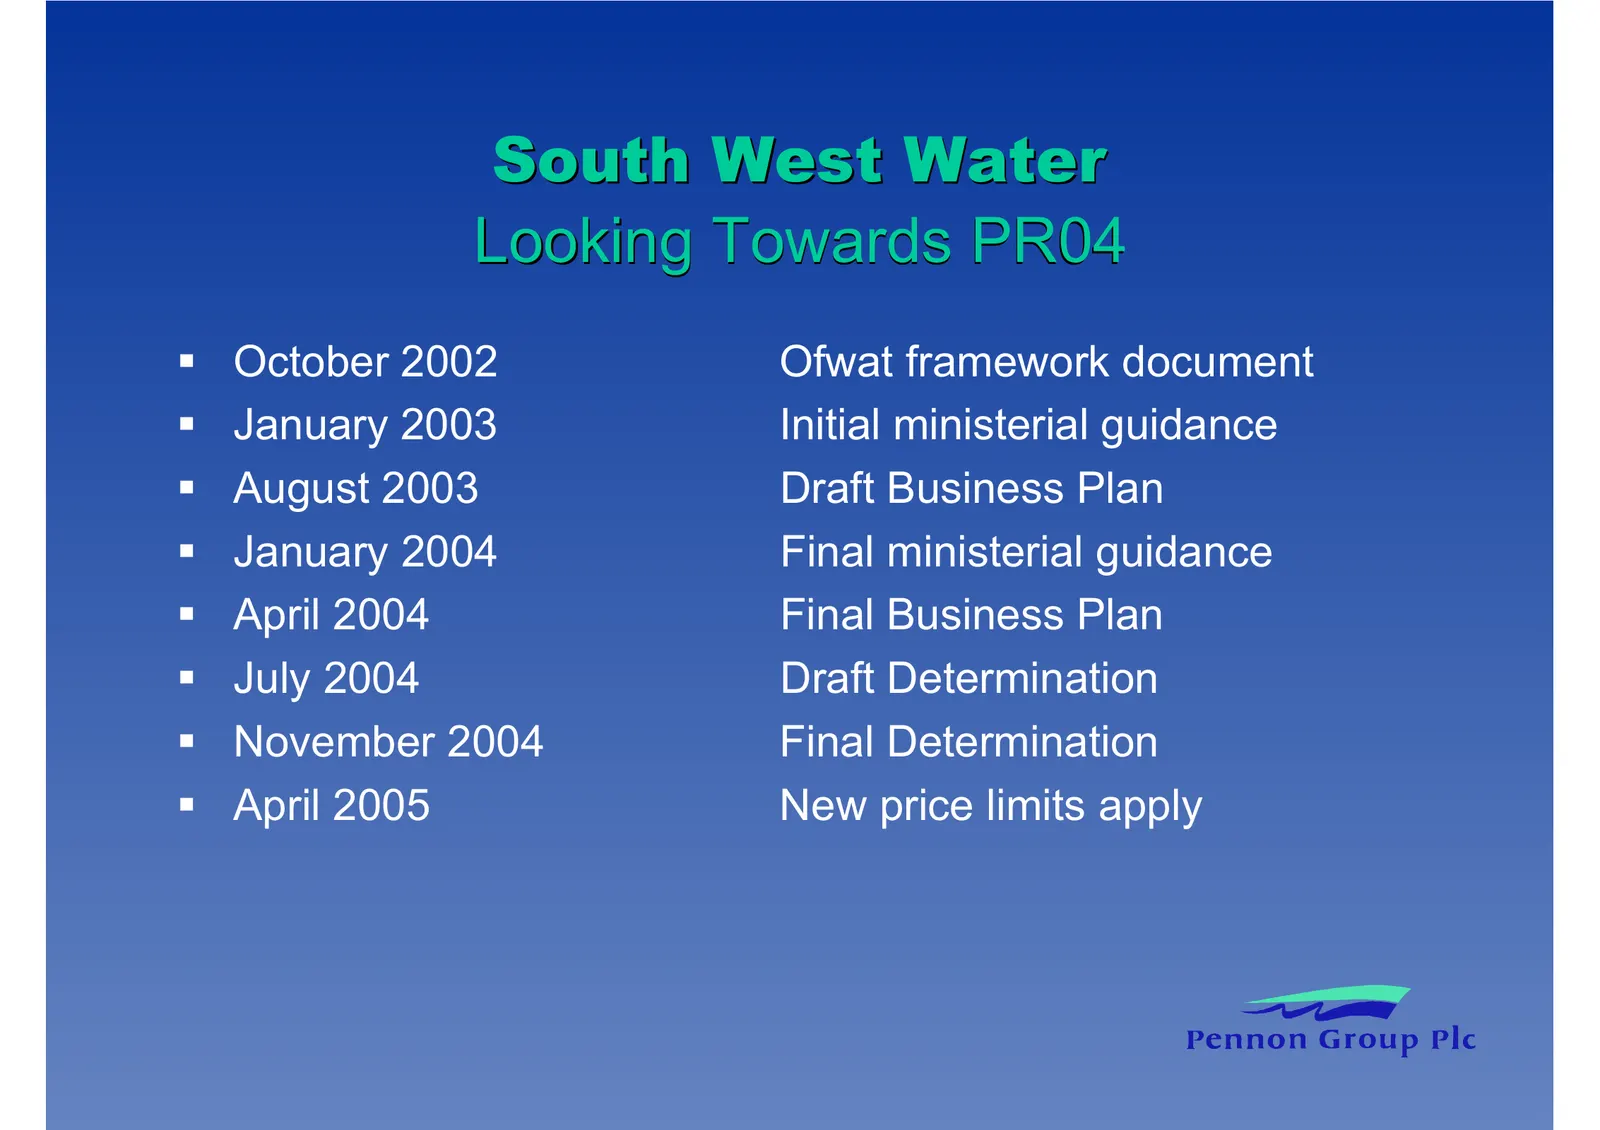
Slide 23: Looking Towards PR04
South West Water Looking Towards PR04 October 2002 Ofwat framework document January 2003 Initial ministerial guidance August 2003 Draft Business Plan January 2004 Final ministerial guidance April 2004 Final Business Plan July 2004 Draft Determination November 2004 Final Determination April 2005 New
Slide 24: Viridor Waste
Slide 25: Viridor Waste Financial Performance Summary
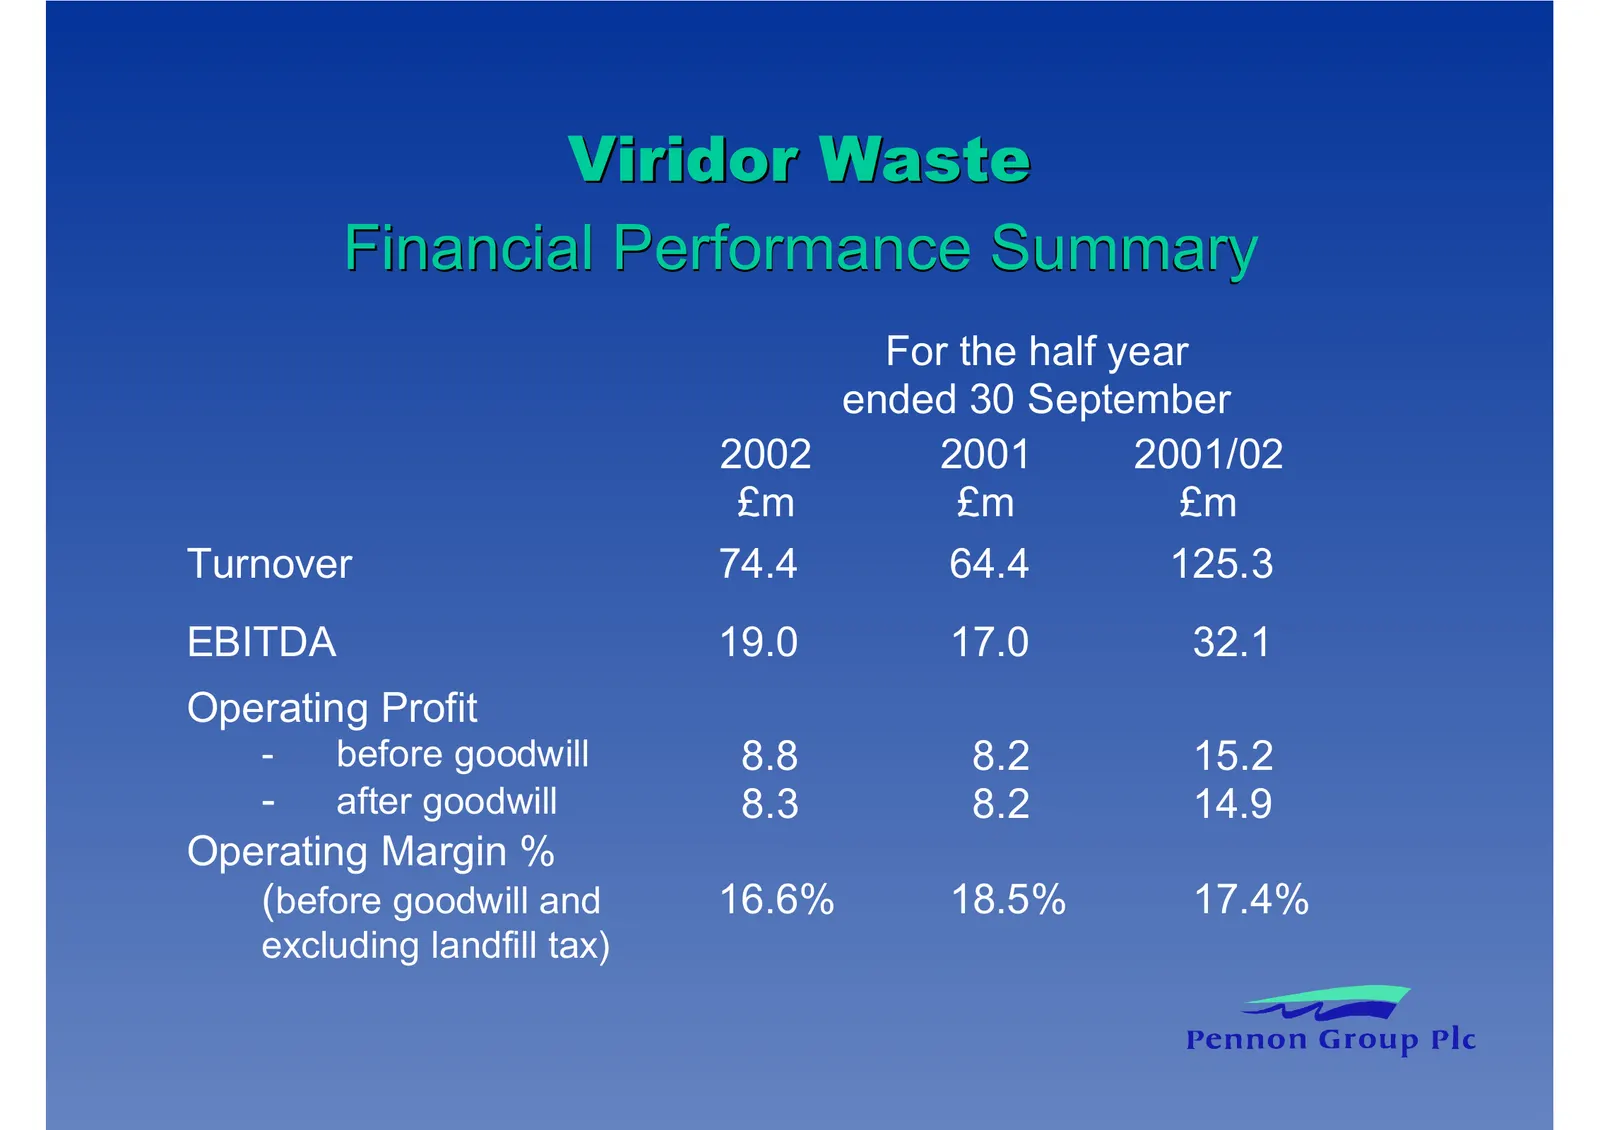
Viridor Waste Financial Performance Summary For the half year ended 30 September 2002 2001 2001/02 £m £m £m Turnover 74.4 64.4 125.3 EBITDA 19.0 17.0 32.1 Operating Profit - before goodwill 8.8 8.2 15.2 - after goodwill 8.3 8.2 14.9 Operating Margin % (before goodwill and 16.6% 18.5% 17.4% excluding
Slide 26: Viridor Waste Strategy
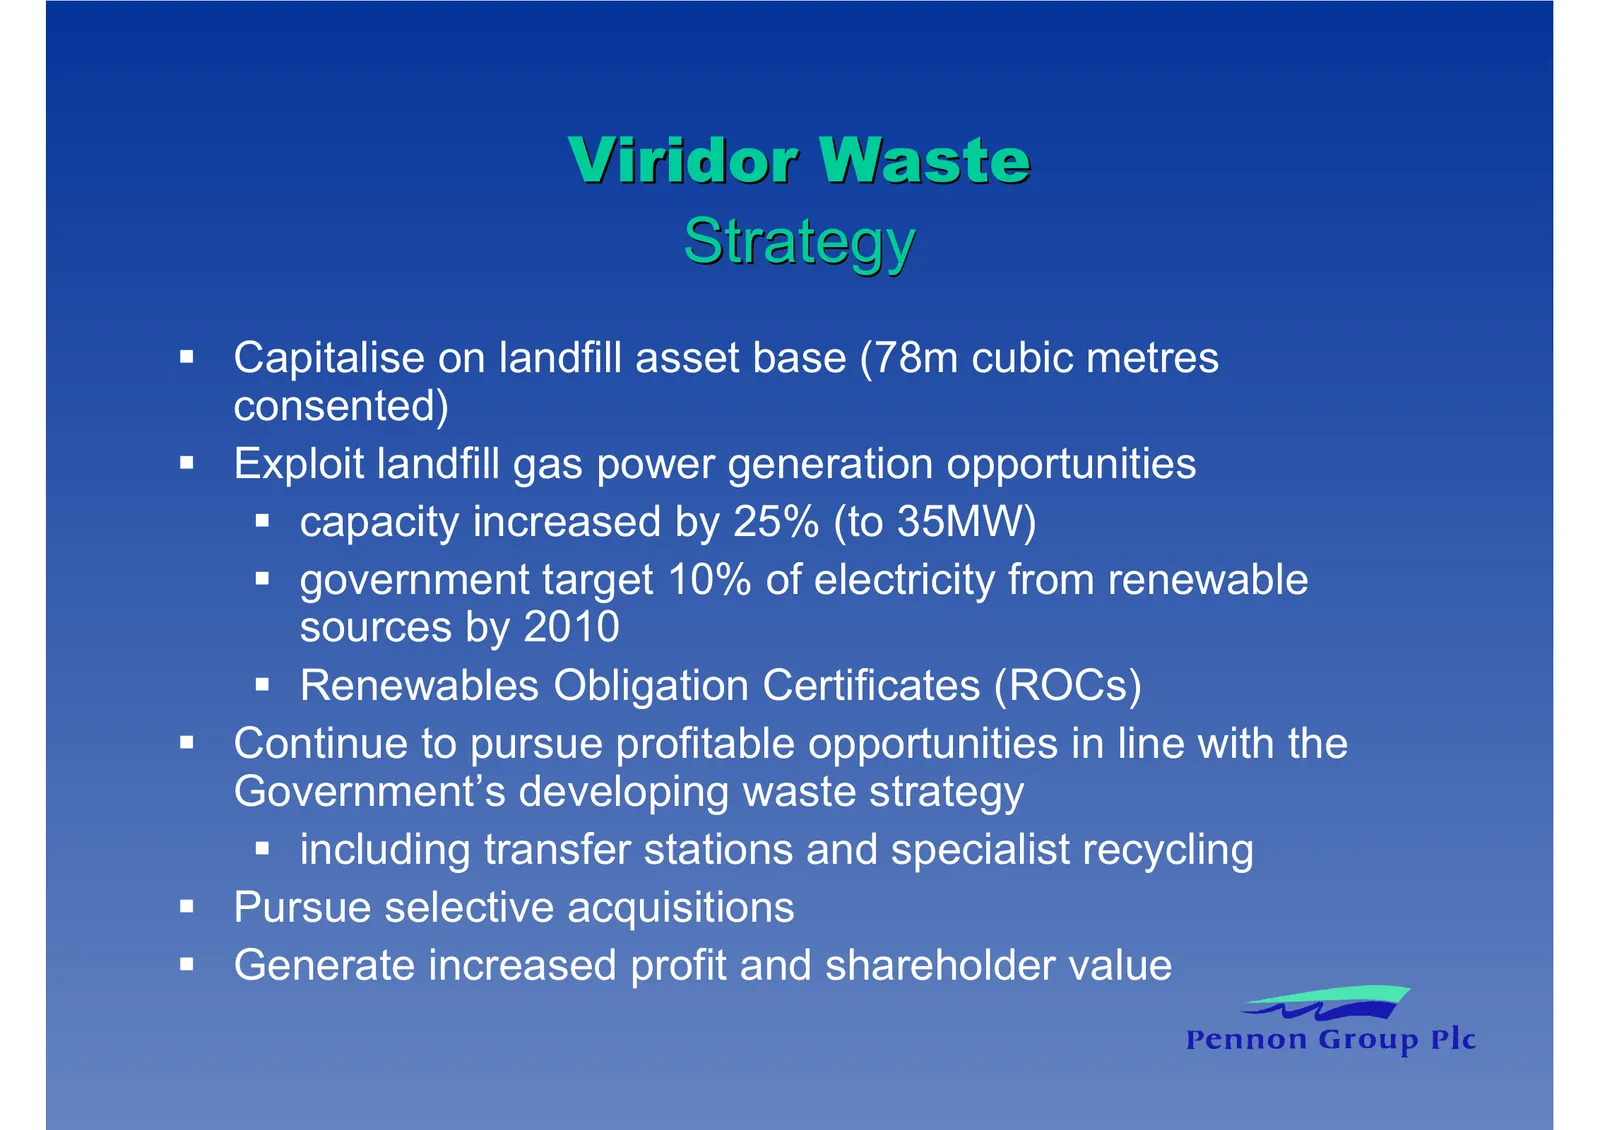
Viridor Waste Strategy Capitalise on landfill asset base (78m cubic metres consented) Exploit landfill gas power generation opportunities capacity increased by 25% (to 35MW) government target 10% of electricity from renewable sources by 2010 Renewables Obligation Certificates (ROCs) Continue to purs
Slide 27: Operational and Business Highlights (1)
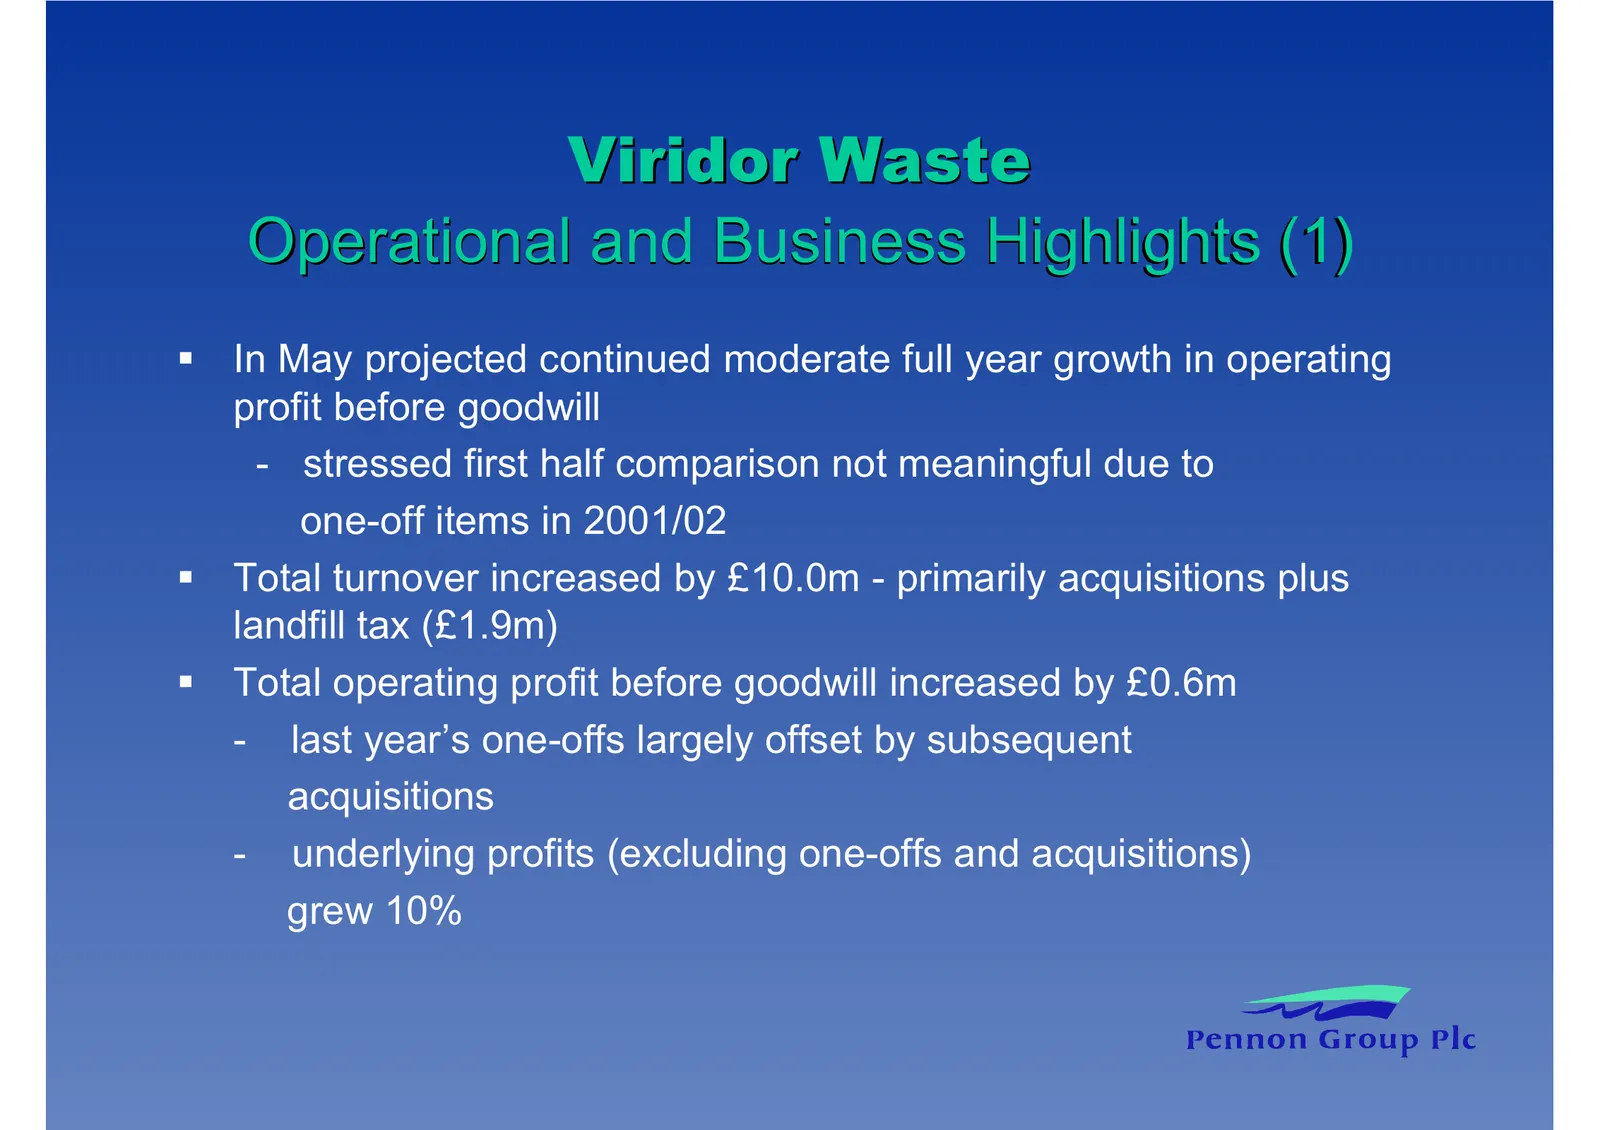
Viridor Waste Operational and Business Highlights (1) In May projected continued moderate full year growth in operating profit before goodwill - stressed first half comparison not meaningful due to one-off items in 2001/02 Total turnover increased by £10.0m - primarily acquisitions plus landfill tax
Slide 28: Operational and Business Highlights (2)
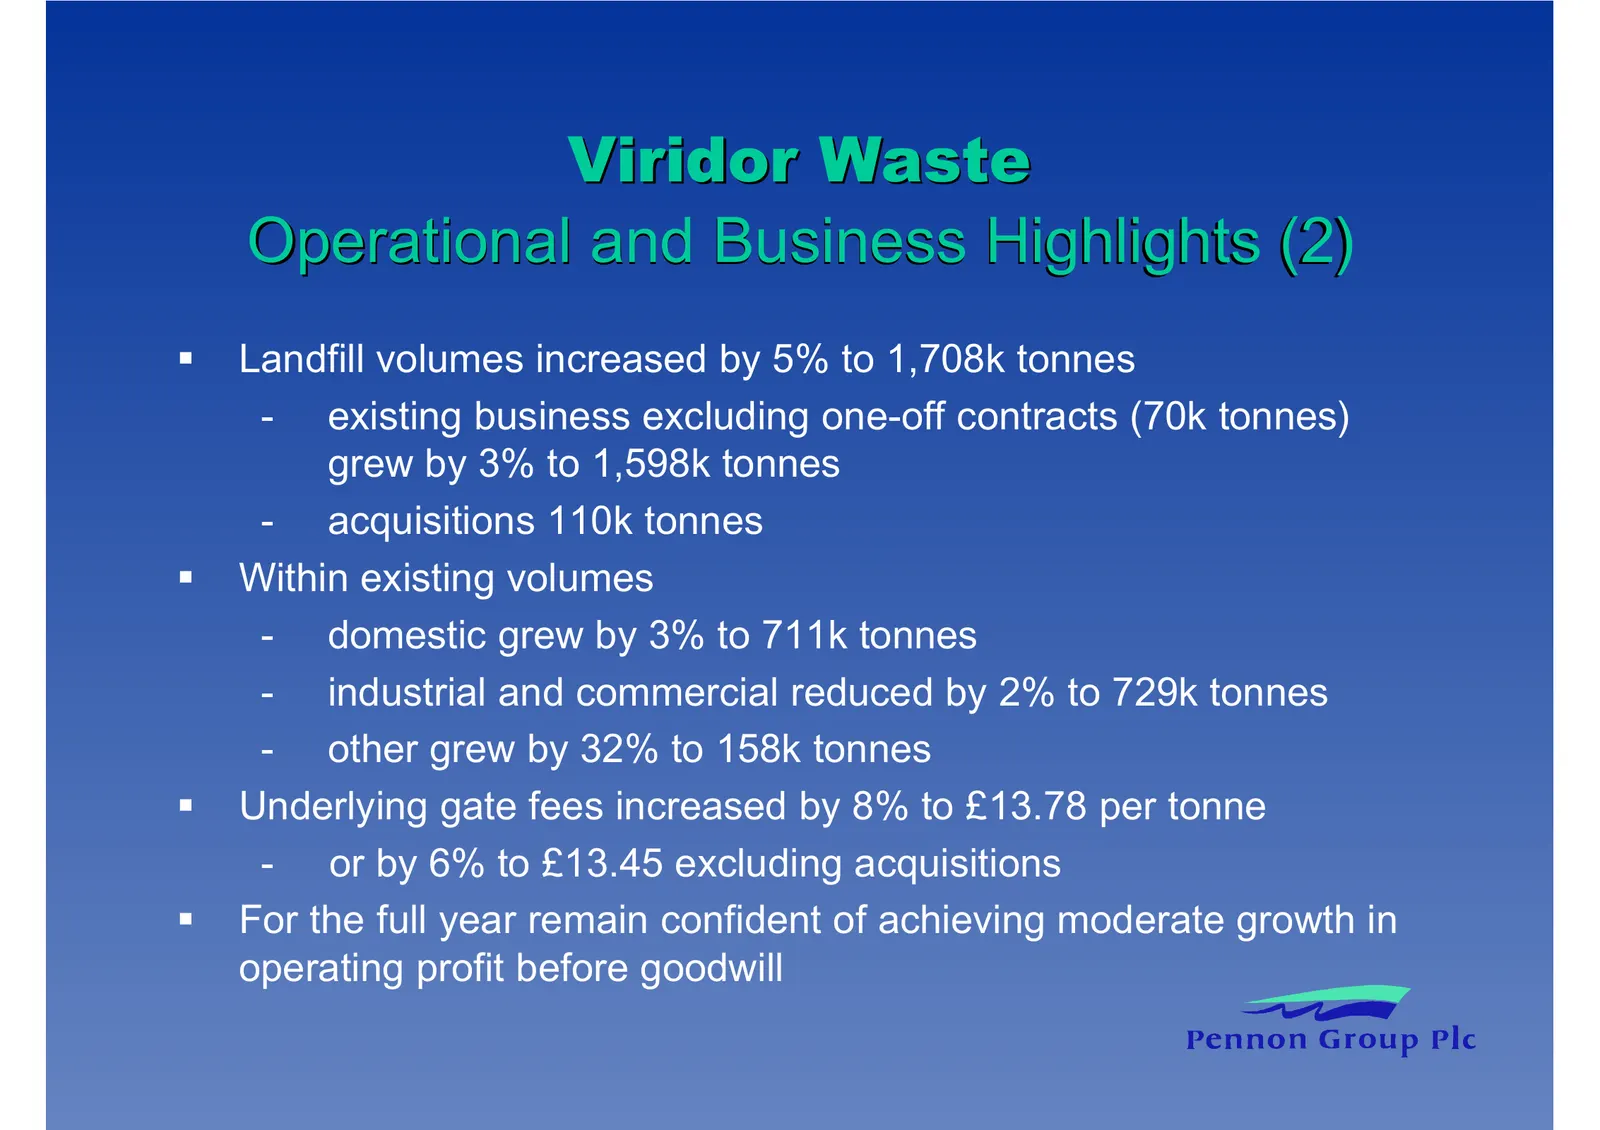
Viridor Waste Operational and Business Highlights (2) Landfill volumes increased by 5% to 1,708k tonnes - existing business excluding one-off contracts (70k tonnes) grew by 3% to 1,598k tonnes - acquisitions 110k tonnes Within existing volumes - domestic grew by 3% to 711k tonnes - industrial and co
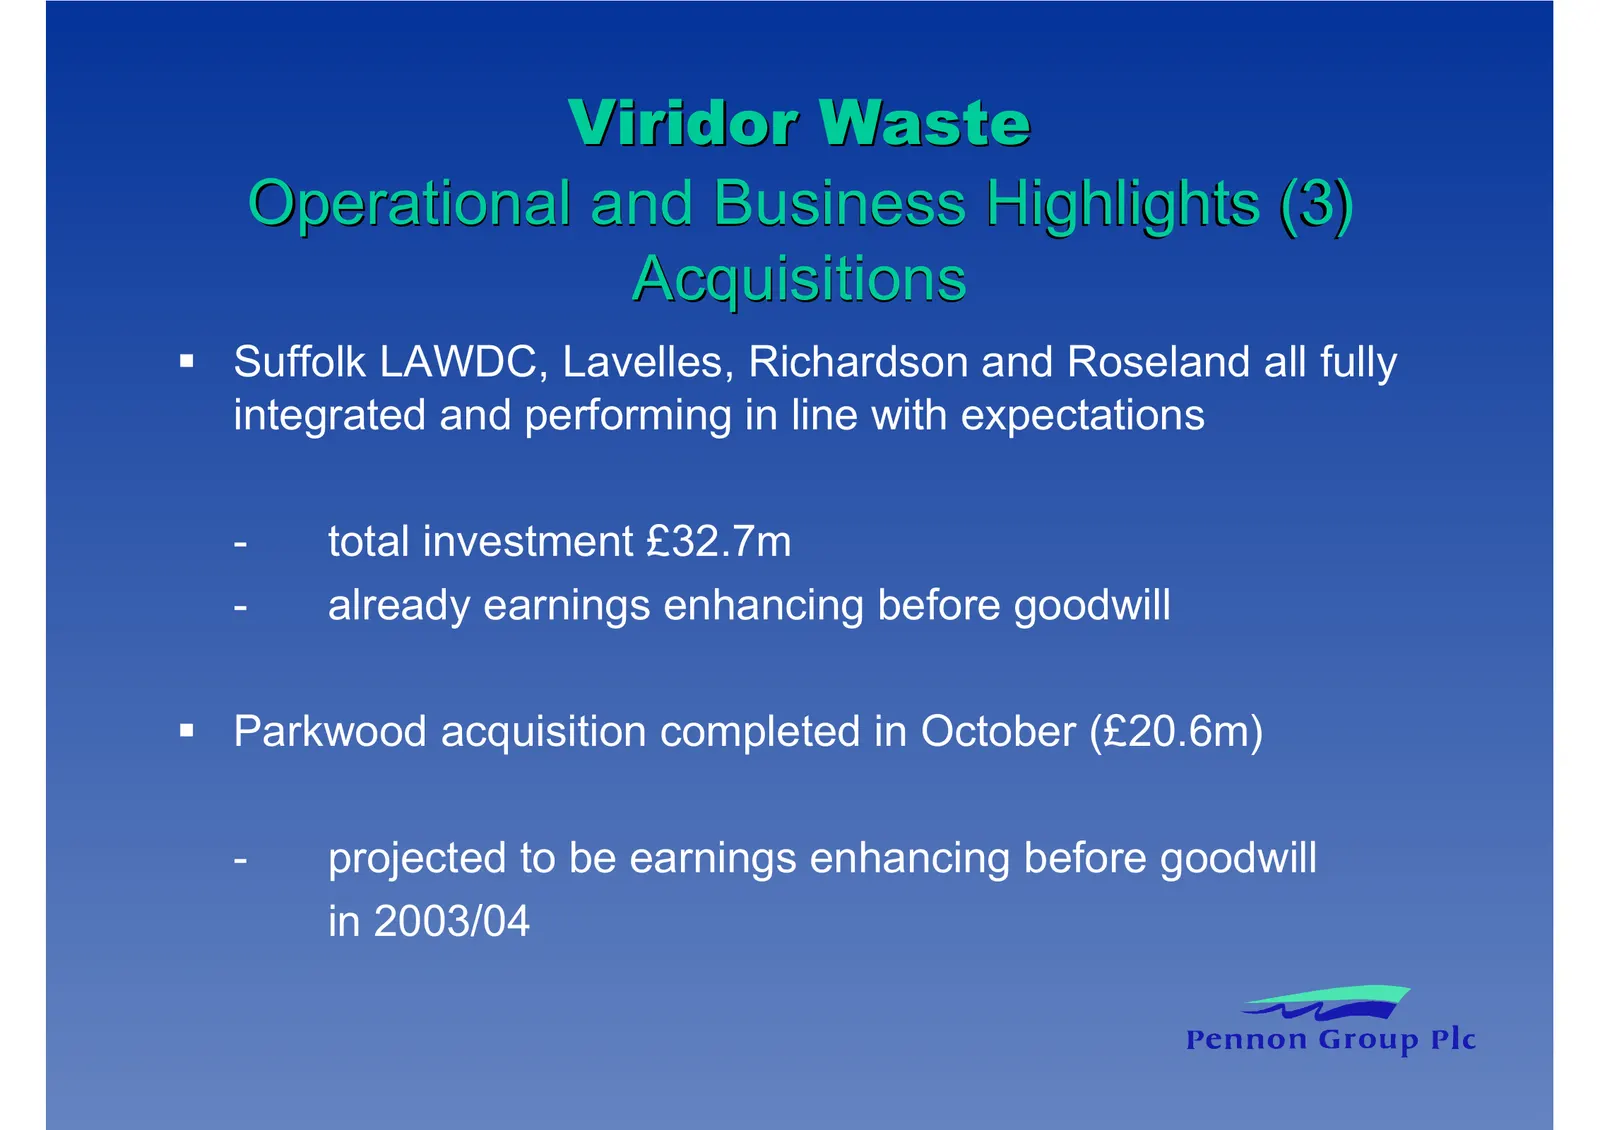
Slide 29: Operational and Business Highlights (3) Acquisitions
Viridor Waste Operational and Business Highlights (3) Acquisitions Suffolk LAWDC, Lavelles, Richardson and Roseland all fully integrated and performing in line with expectations - total investment £32.7m - already earnings enhancing before goodwill Parkwood acquisition completed in October (£20.6m)
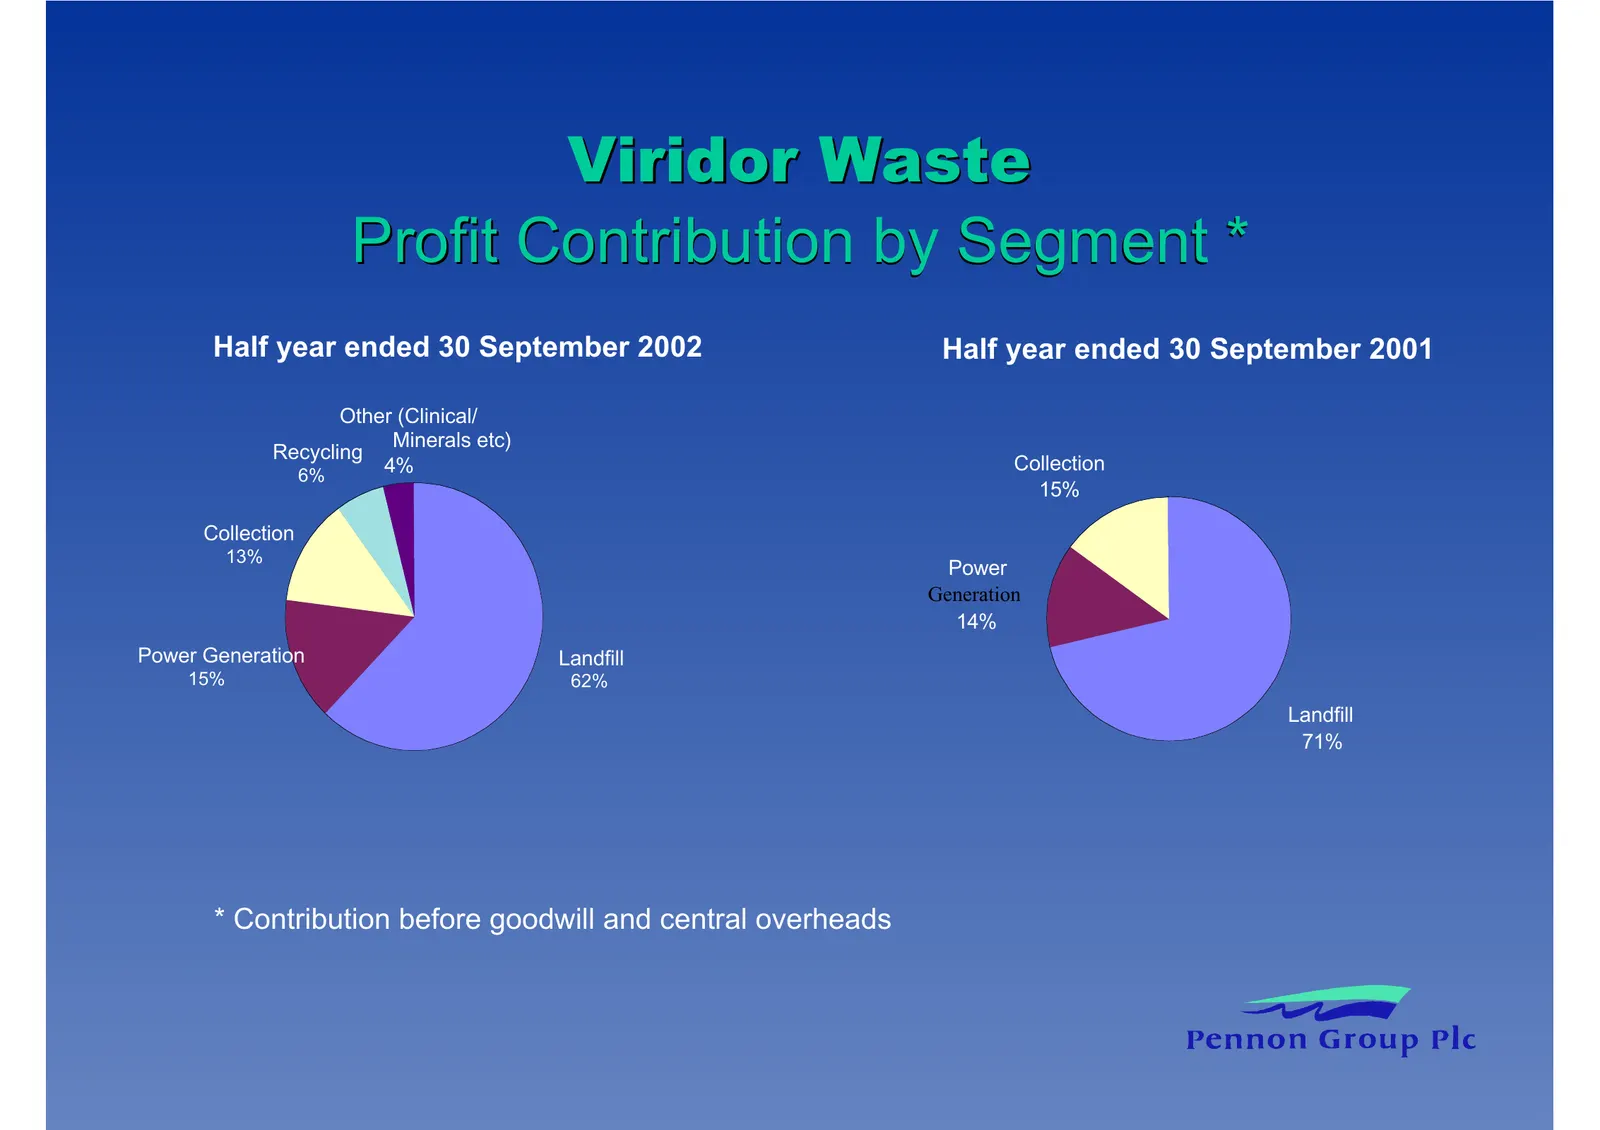
Slide 30: Profit Contribution by Segment
Viridor Waste Profit Contribution by Segment * Half year ended 30 September 2002 Half year ended 30 September 2001 Other (Clinical/ Minerals etc) Recycling 4% Collection 6% 15% Collection 13% Power Generation 14% Power Generation Landfill 15% 62% Landfill 71% * Contribution before goodwill and centr
Slide 31: Pennon Group Plc
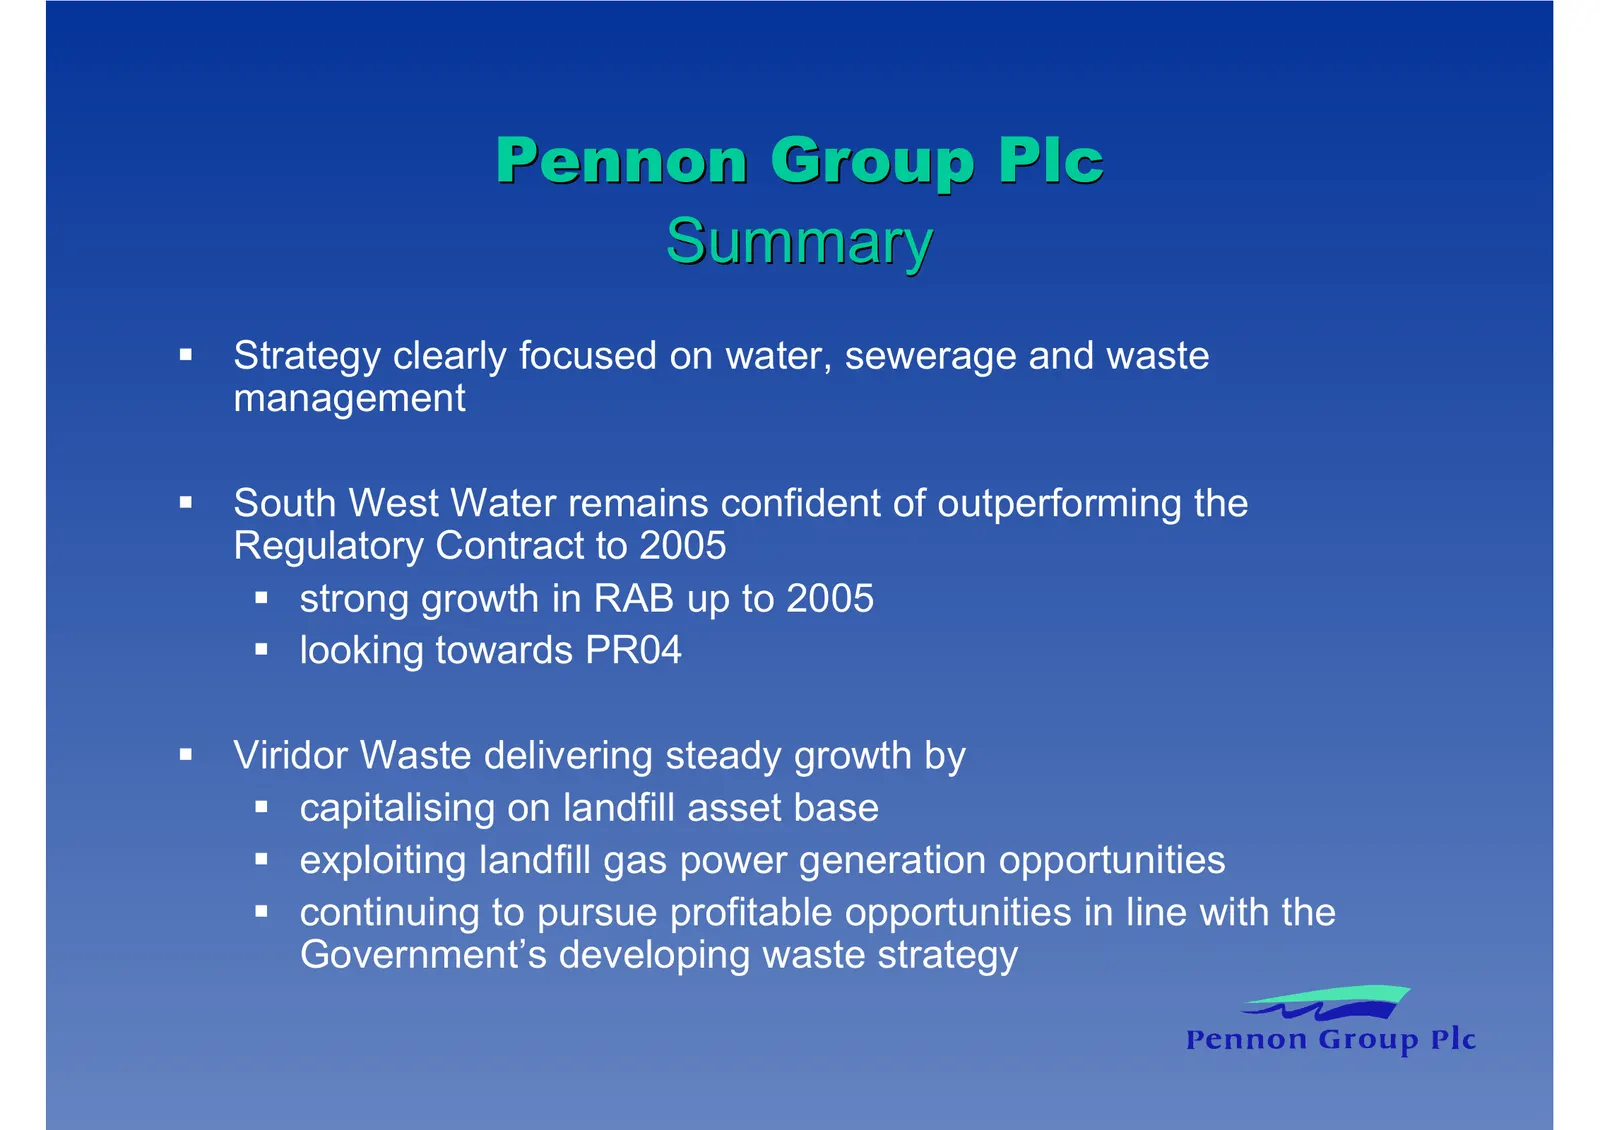
Slide 32: Summary
Pennon Group Plc Summary Strategy clearly focused on water, sewerage and waste management South West Water remains confident of outperforming the Regulatory Contract to 2005 strong growth in RAB up to 2005 looking towards PR04 Viridor Waste delivering steady growth by capitalising on landfill asset
Slide 33: Pennon Group Plc
Source: Internet Archive copy of pennon-group.co.uk
More decks from Pennon Group PLC
 Q4 2026 Earnings Presentation36 slides · Jun 10, 2026
 South West Water — H1 2025/26 Earnings Presentation25 slides · Dec 1, 2025
 H1 2025/26 Earnings Presentation40 slides · Nov 27, 2025
 FY2024/25 Earnings Presentation26 slides · Jun 4, 2025
 FY2024/25 Earnings Presentation45 slides · Jun 3, 2025
 Investor Day (March 2025)26 slides · Mar 13, 2025