Transformers and Rectifiers (India) Limited · NSE:TARIL
Transformers and Rectifiers (India) — Q2 FY2021 Earnings Presentation
15 slides from Transformers and Rectifiers (India)'s earnings presentation, Nov 27, 2020
Slide 1: Q2 - FY 2020-21 Presentation
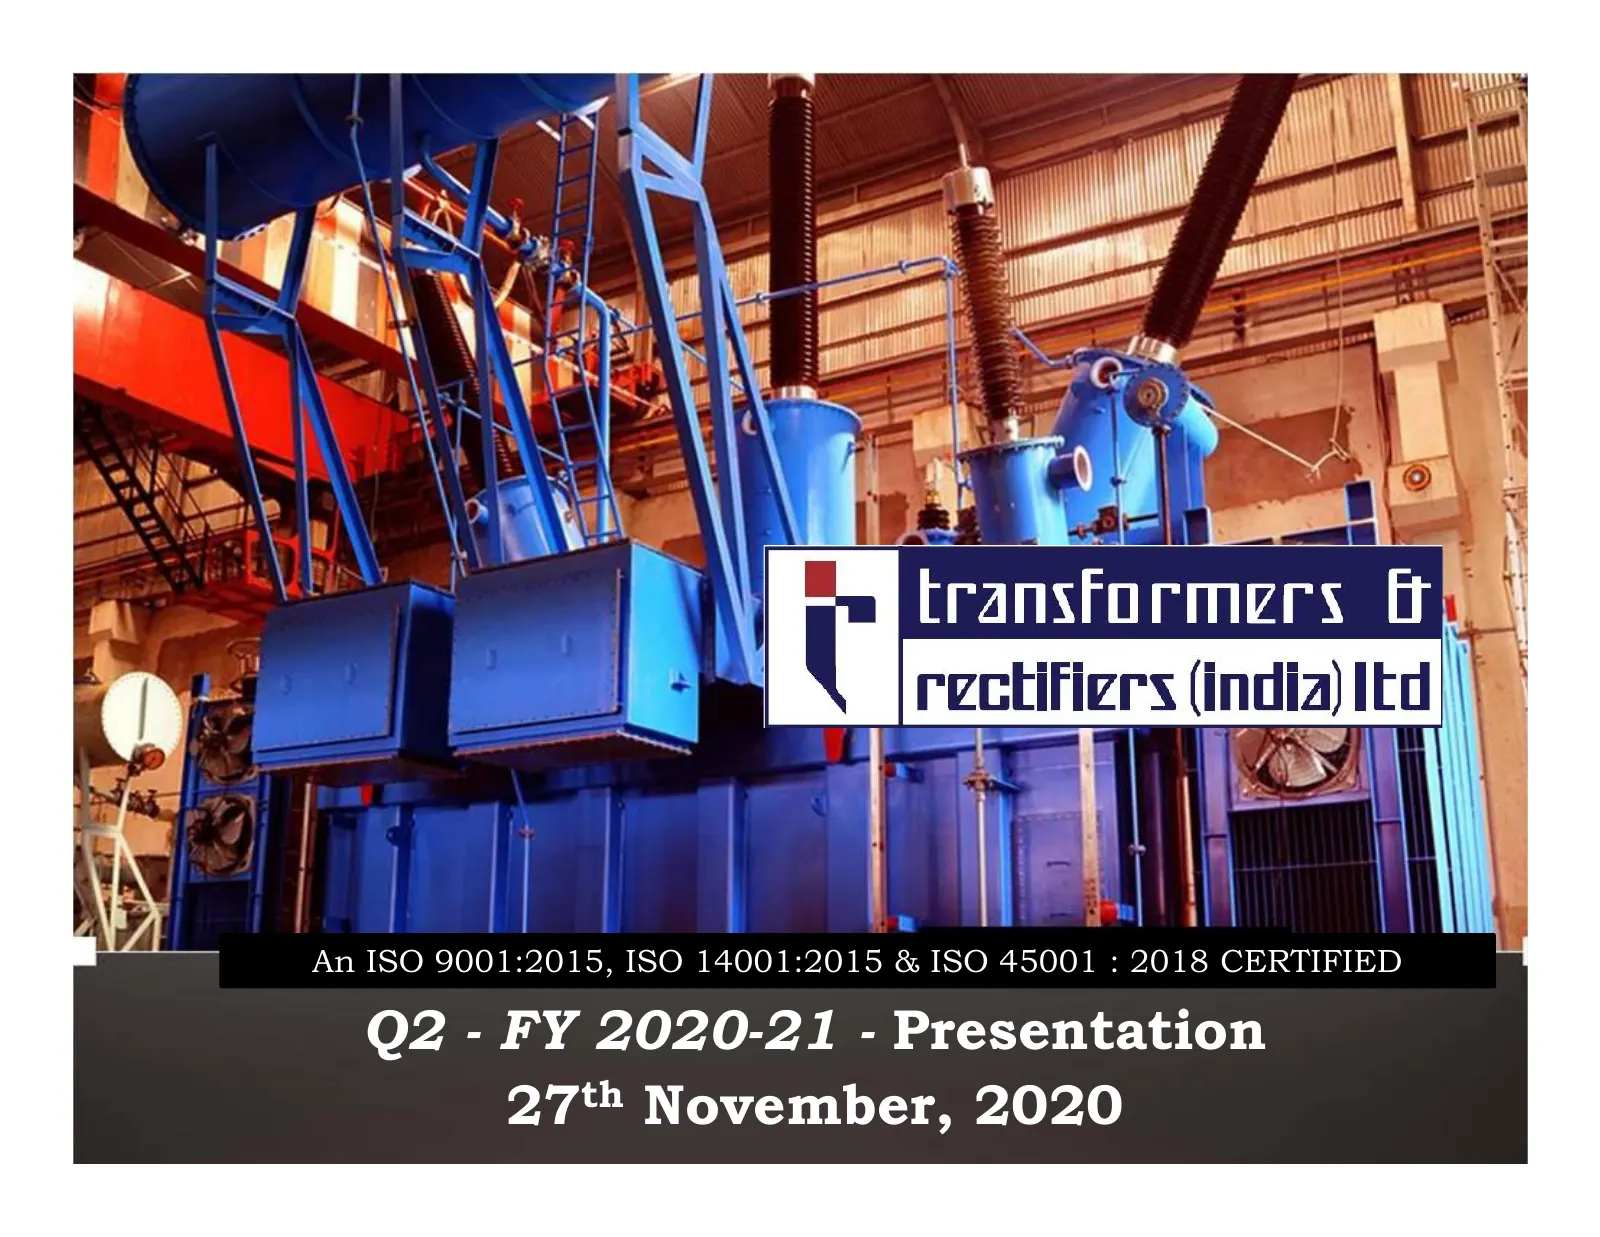
An ISO 9001:2015, ISO 14001:2015 & ISO 45001 : 2018 CERTIFIED Q2 - FY 2020-21 - Presentation 27th November, 2020
Slide 2: Disclaimer
DISCLAIMER This presentation and the discussion that follows may contain certain words or phrases that are forward - looking statements, based on current expectations of the management of Transformers and Rectifiers (India) Limited or any of its subsidiaries and associate companies (“TRIL”). Actual
Slide 3: Financials - Standalone
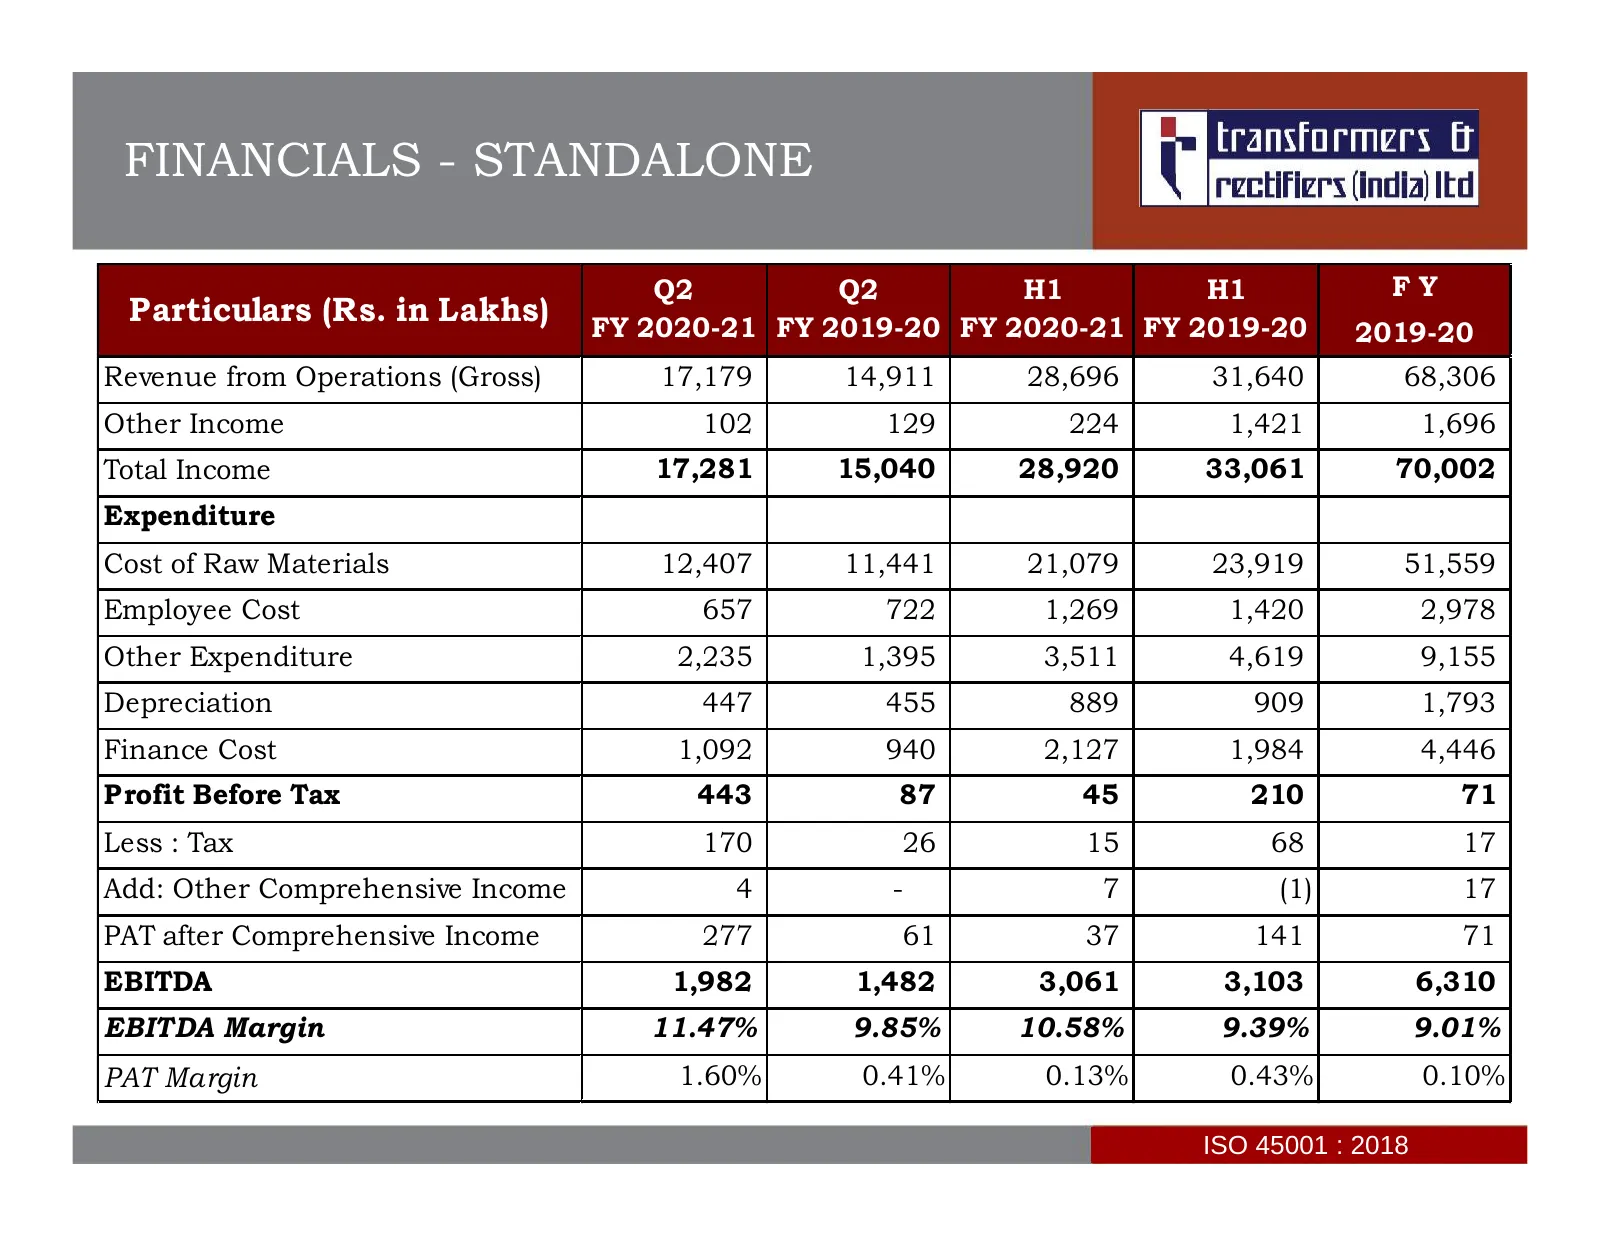
FINANCIALS - STANDALONE Q2 Q2 H1 H1 FY Particulars (Rs. in Lakhs) FY 2020-21 FY 2019-20 FY 2020-21 FY 2019-20 2019-20 Revenue from Operations (Gross) 17,179 14,911 28,696 31,640 68,306 Other Income 102 129 224 1,421 1,696 Total Income 17,281 15,040 28,920 33,061 70,002 Expenditure Cost of Raw Materi
Slide 4: Q2 FY 2020-21 Result Highlights
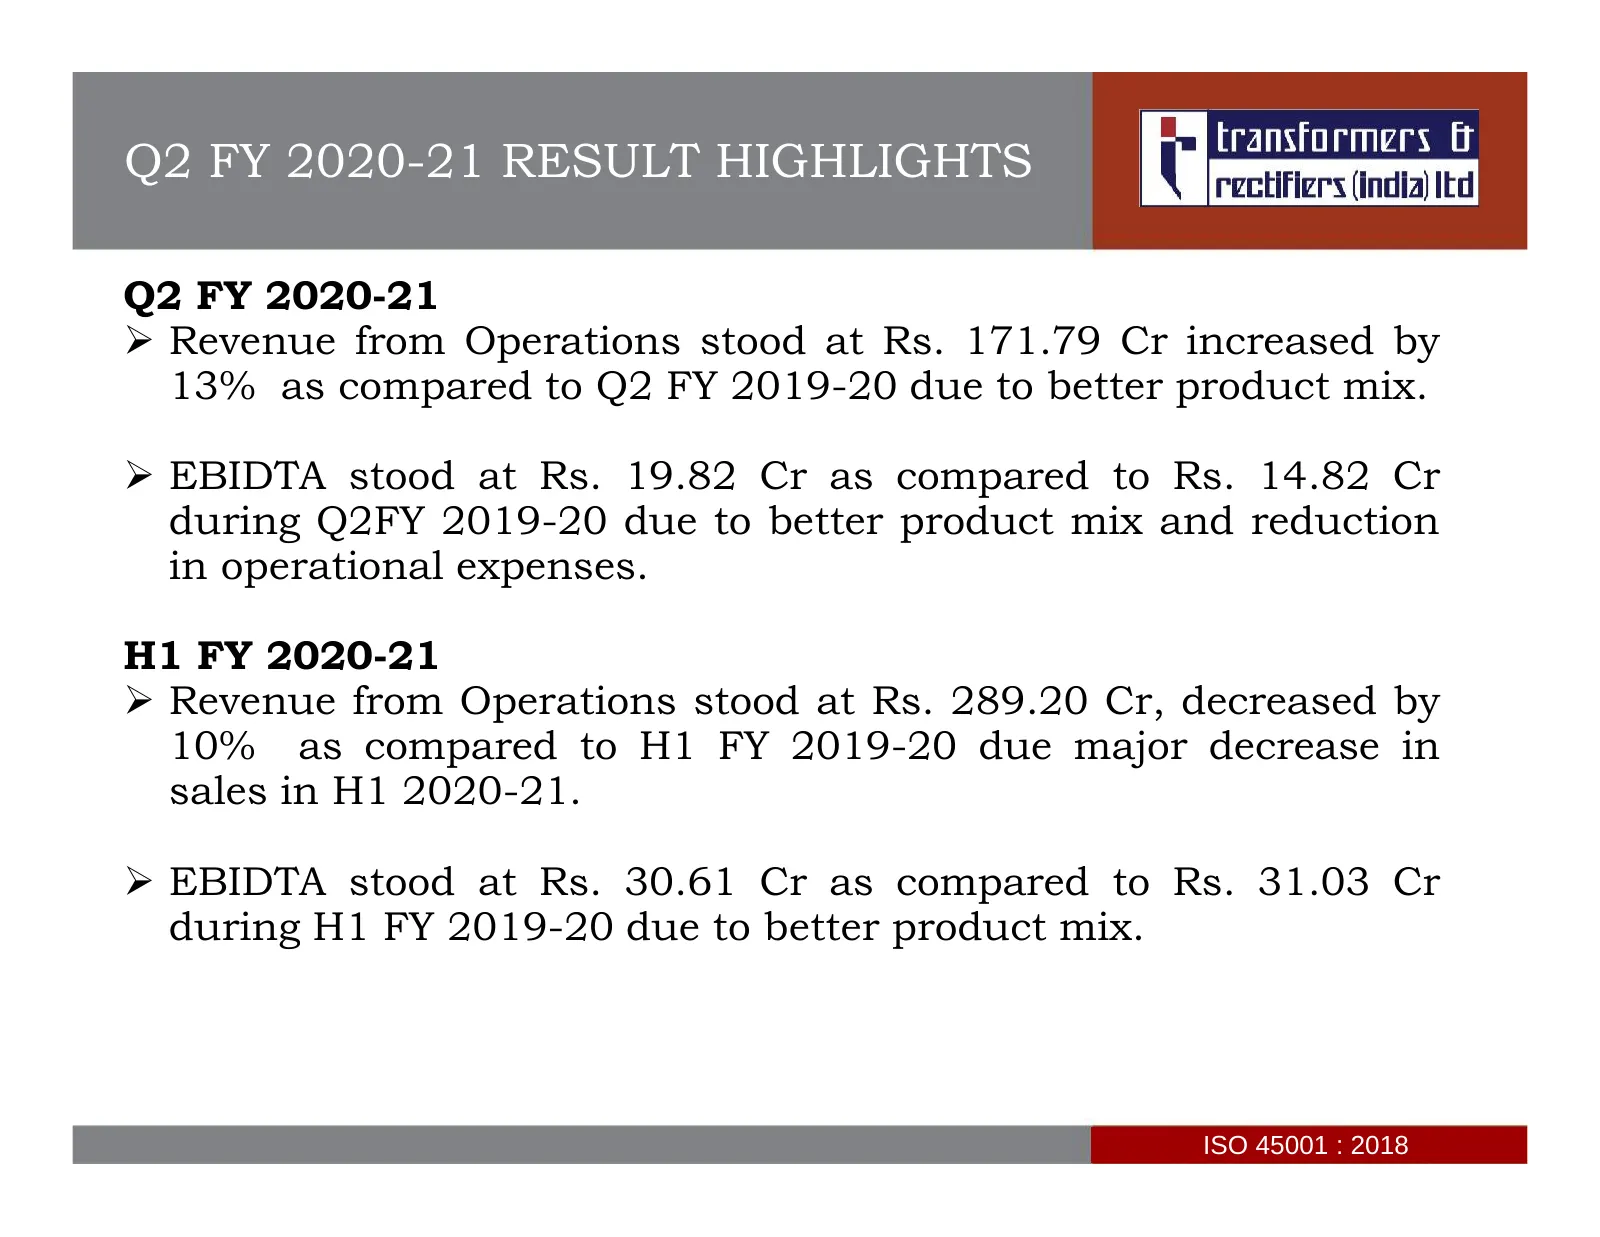
Q2 FY 2020-21 RESULT HIGHLIGHTS Q2 FY 2020-21 Revenue from Operations stood at Rs. 171.79 Cr increased by 13% as compared to Q2 FY 2019-20 due to better product mix. EBIDTA stood at Rs. 19.82 Cr as compared to Rs. 14.82 Cr during Q2FY 2019-20 due to better product mix and reduction in operationa
Slide 5: Financials - Standalone
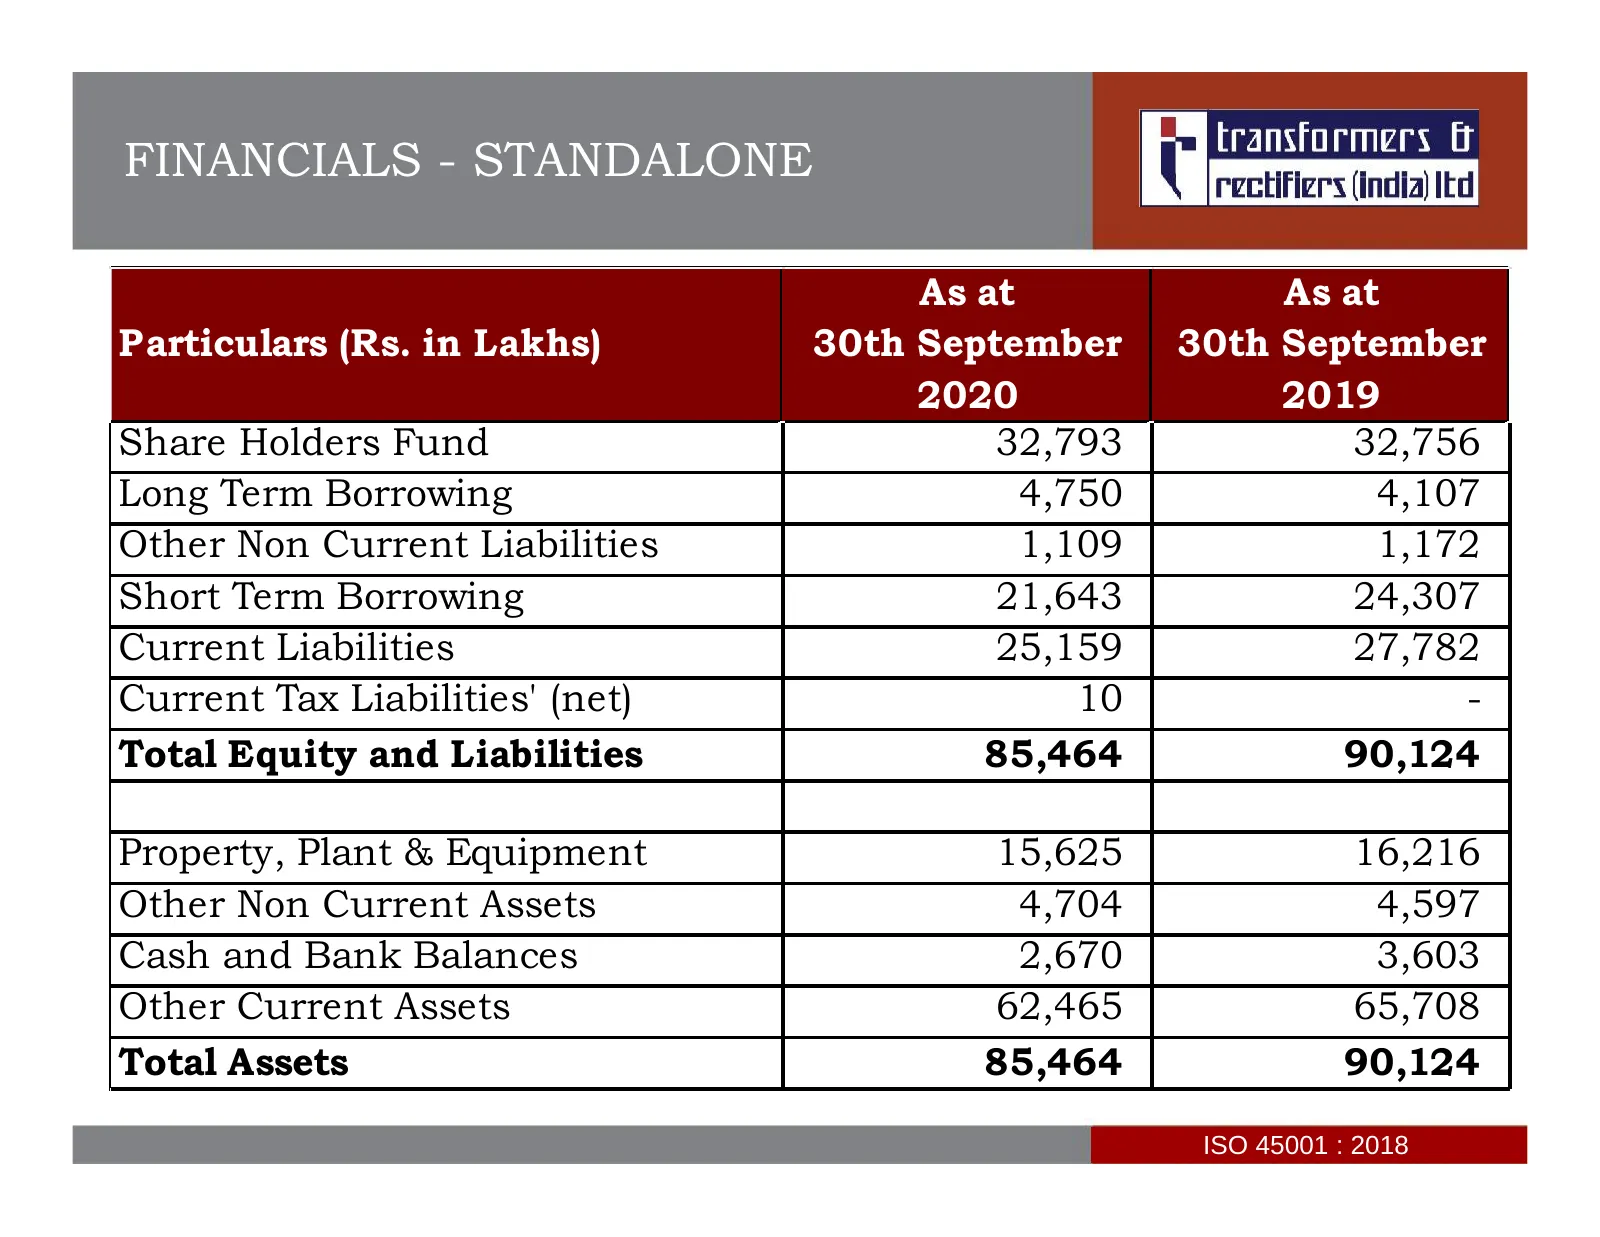
FINANCIALS - STANDALONE As at As at Particulars (Rs. in Lakhs) 30th September 30th September 2020 2019 Share Holders Fund 32,793 32,756 Long Term Borrowing 4,750 4,107 Other Non Current Liabilities 1,109 1,172 Short Term Borrowing 21,643 24,307 Current Liabilities 25,159 27,782 Current Tax Liabiliti
Slide 6: Financials - Consolidated
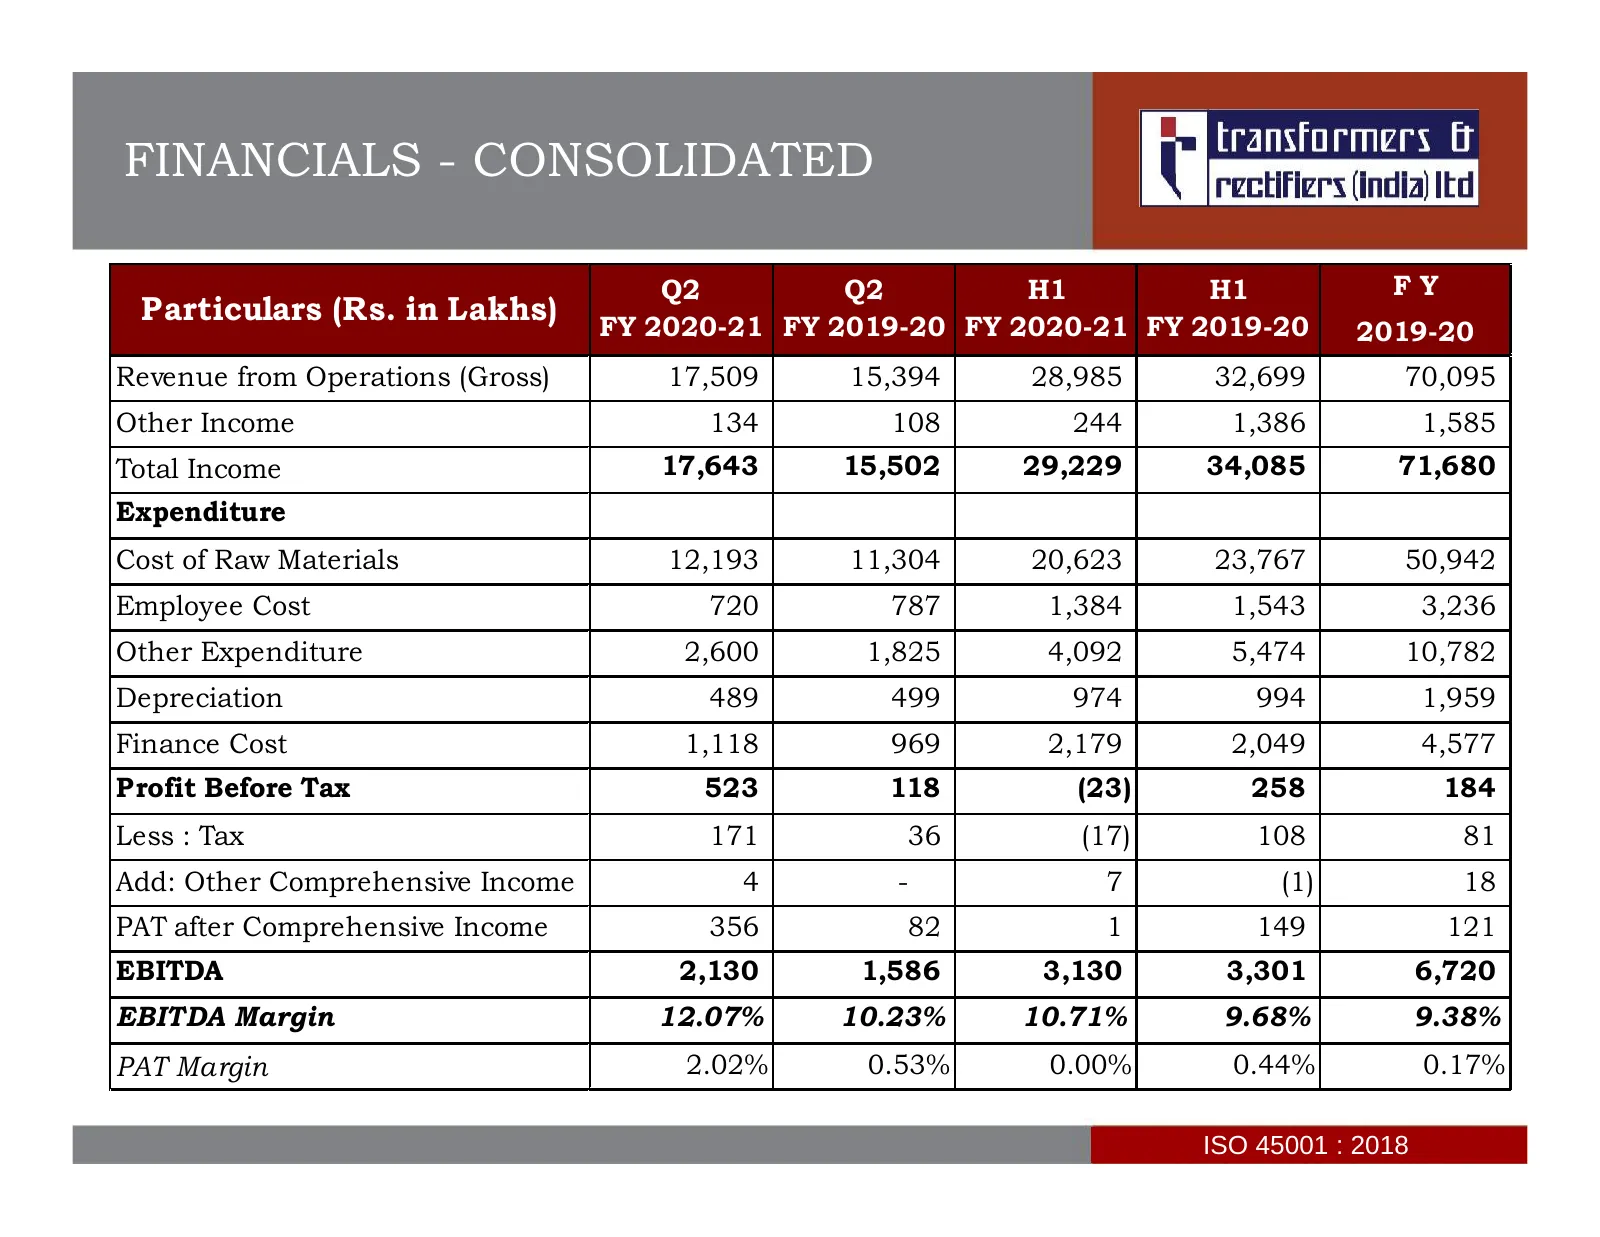
FINANCIALS - CONSOLIDATED Q2 Q2 H1 H1 FY Particulars (Rs. in Lakhs) FY 2020-21 FY 2019-20 FY 2020-21 FY 2019-20 2019-20 Revenue from Operations (Gross) 17,509 15,394 28,985 32,699 70,095 Other Income 134 108 244 1,386 1,585 Total Income 17,643 15,502 29,229 34,085 71,680 Expenditure Cost of Raw Mate
Slide 7: Q2 FY 2020-21 Result Highlights - Consolidated
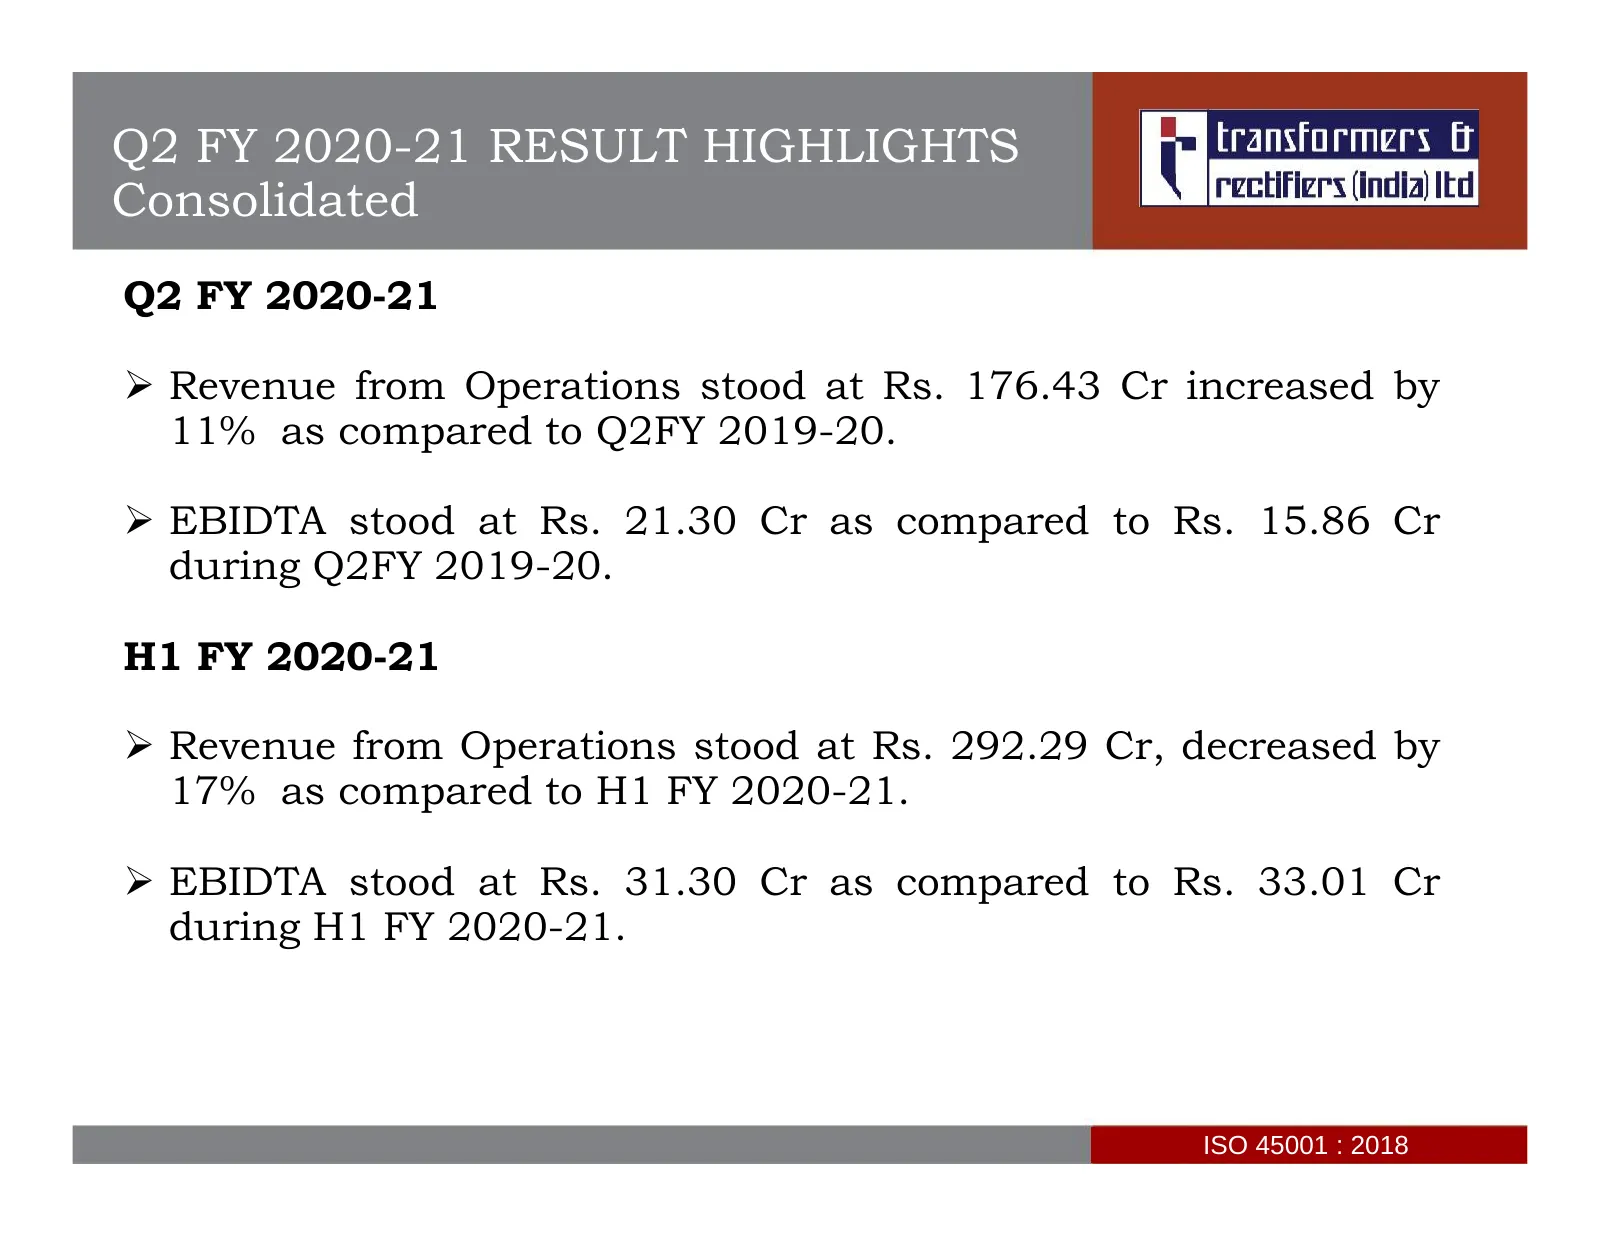
Q2 FY 2020-21 RESULT HIGHLIGHTS Consolidated Q2 FY 2020-21 Revenue from Operations stood at Rs. 176.43 Cr increased by 11% as compared to Q2FY 2019-20. EBIDTA stood at Rs. 21.30 Cr as compared to Rs. 15.86 Cr during Q2FY 2019-20. H1 FY 2020-21 Revenue from Operations stood at Rs. 292.29 Cr, de
Slide 8: Financials - Consolidated
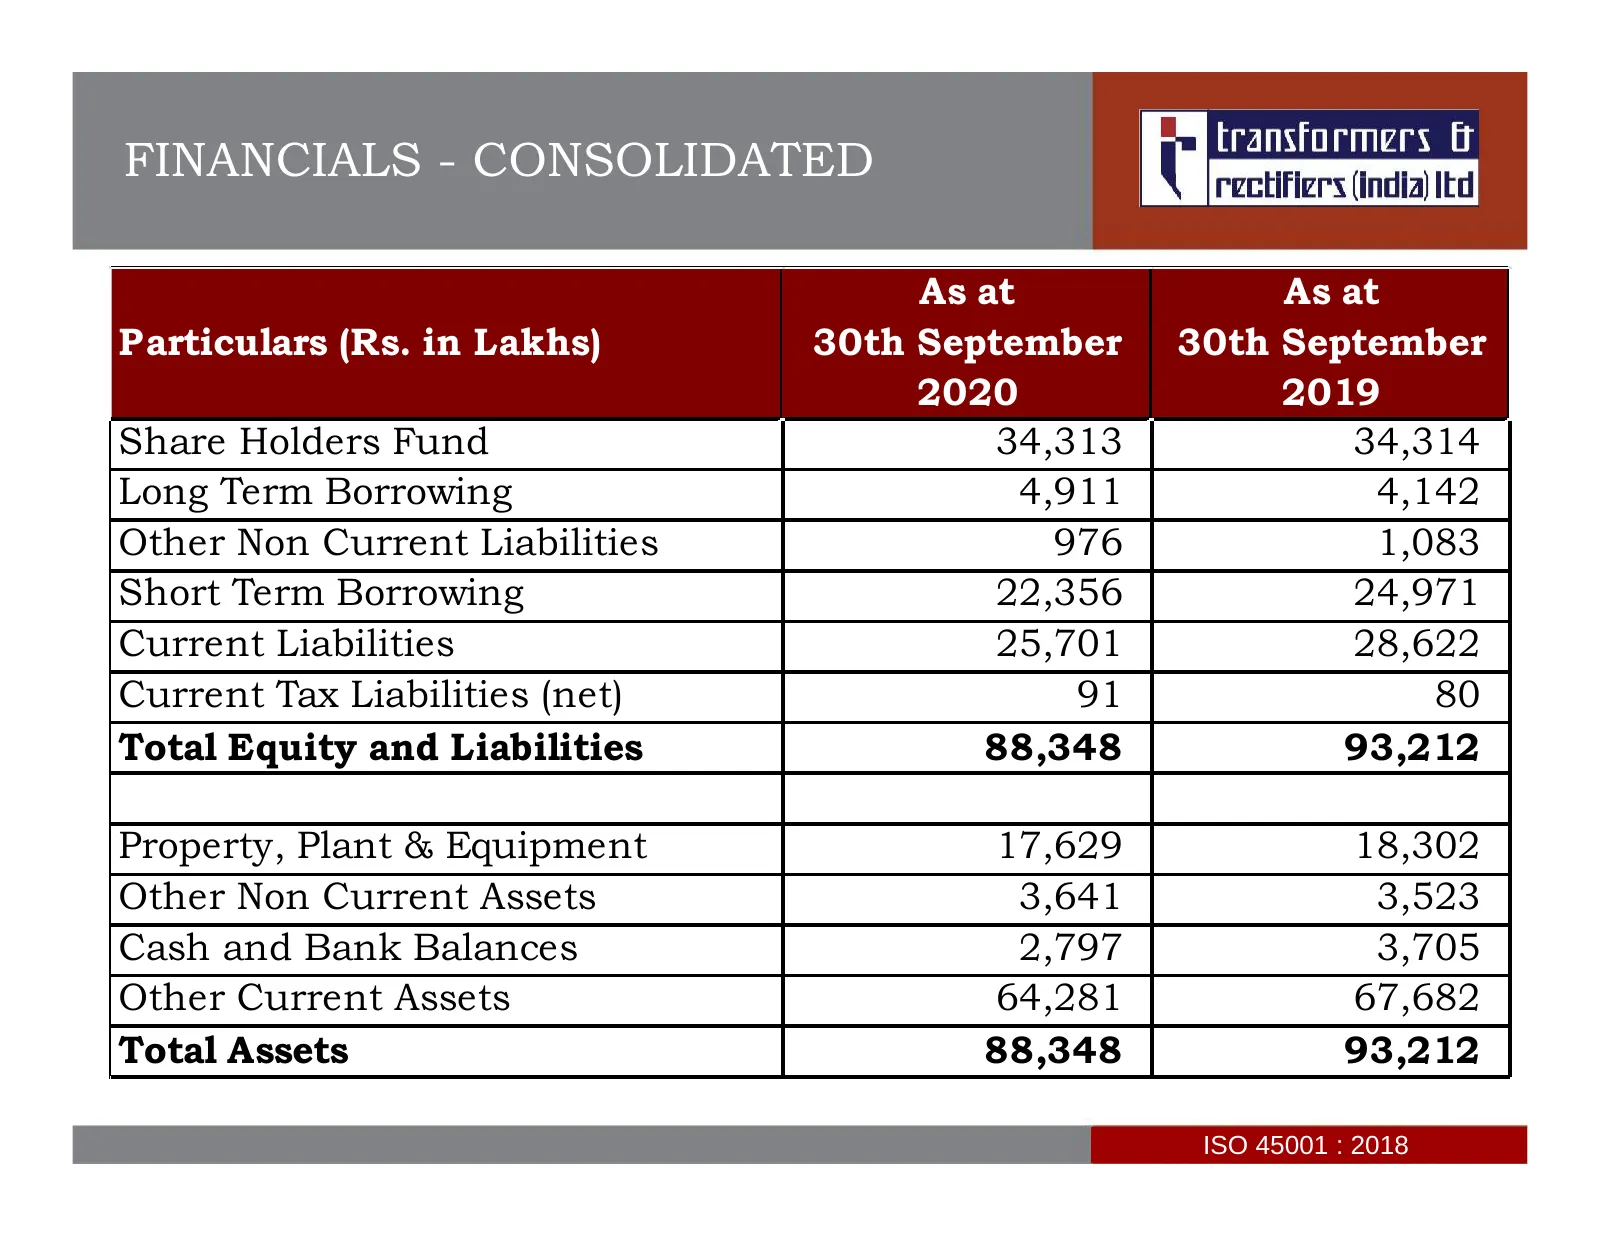
FINANCIALS - CONSOLIDATED As at As at Particulars (Rs. in Lakhs) 30th September 30th September 2020 2019 Share Holders Fund 34,313 34,314 Long Term Borrowing 4,911 4,142 Other Non Current Liabilities 976 1,083 Short Term Borrowing 22,356 24,971 Current Liabilities 25,701 28,622 Current Tax Liabiliti
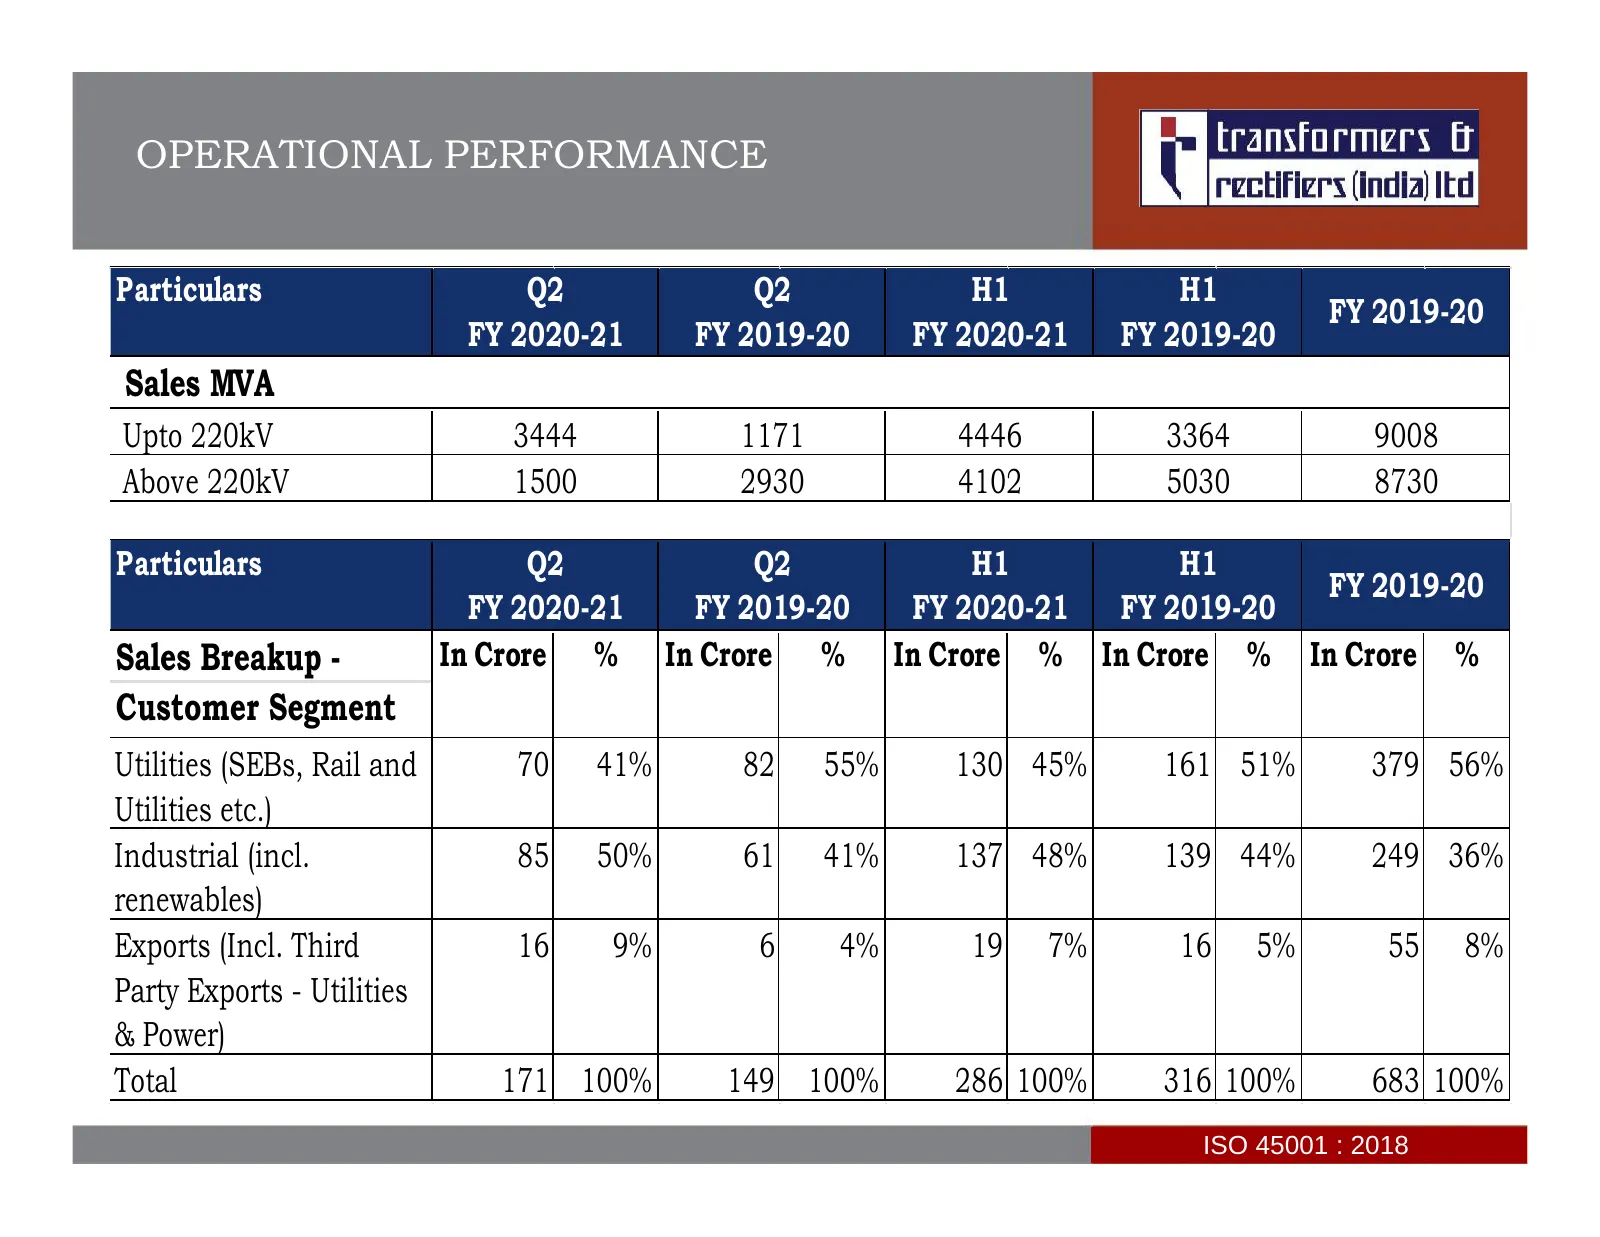
Slide 9: Operational Performance
OPERATIONAL PERFORMANCE Particulars Q2 Q2 H1 H1 FY 2019-20 FY 2020-21 FY 2019-20 FY 2020-21 FY 2019-20 Sales MVA Upto 220kV 3444 1171 4446 3364 9008 Above 220kV 1500 2930 4102 5030 8730 Particulars Q2 Q2 H1 H1 FY 2019-20 FY 2020-21 FY 2019-20 FY 2020-21 FY 2019-20 Sales Breakup - In Crore % In Crore
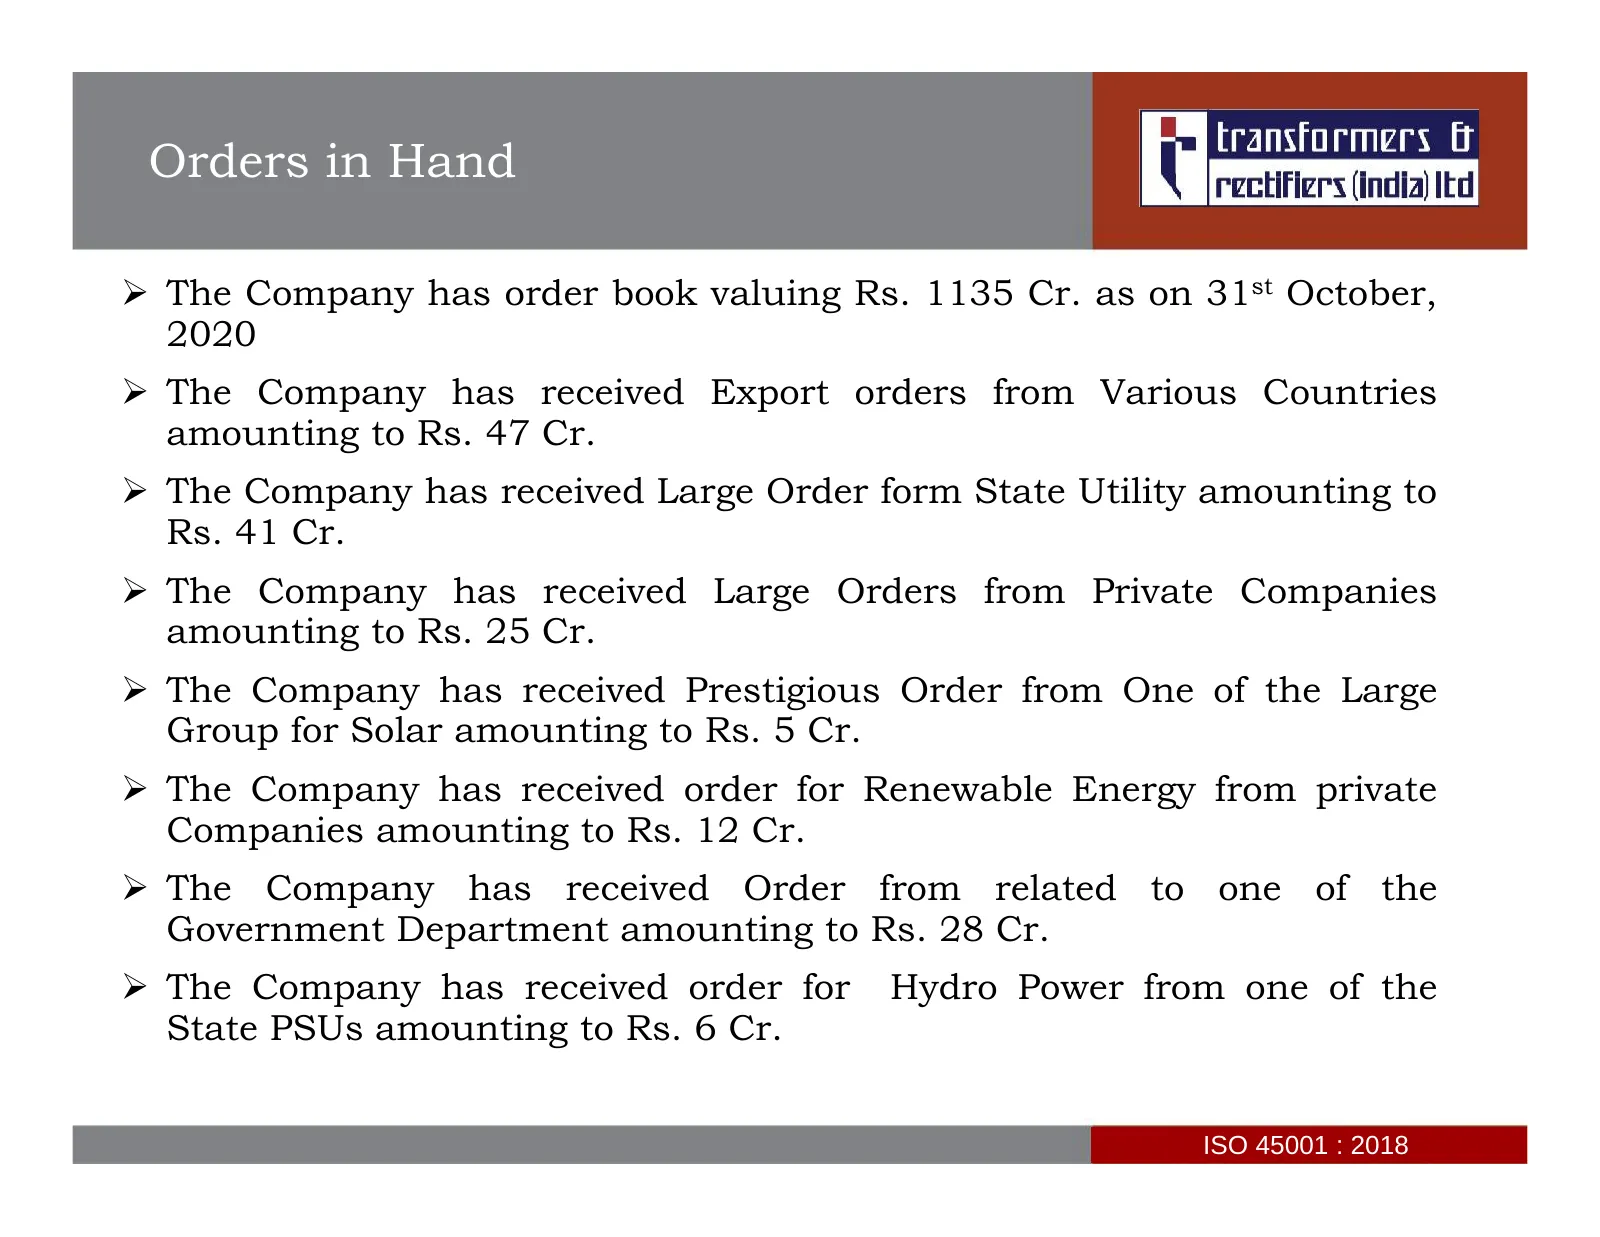
Slide 10: Orders in Hand
Orders in Hand The Company has order book valuing Rs. 1135 Cr. as on 31st October, 2020 The Company has received Export orders from Various Countries amounting to Rs. 47 Cr. The Company has received Large Order form State Utility amounting to Rs. 41 Cr. The Company has received Large Orders
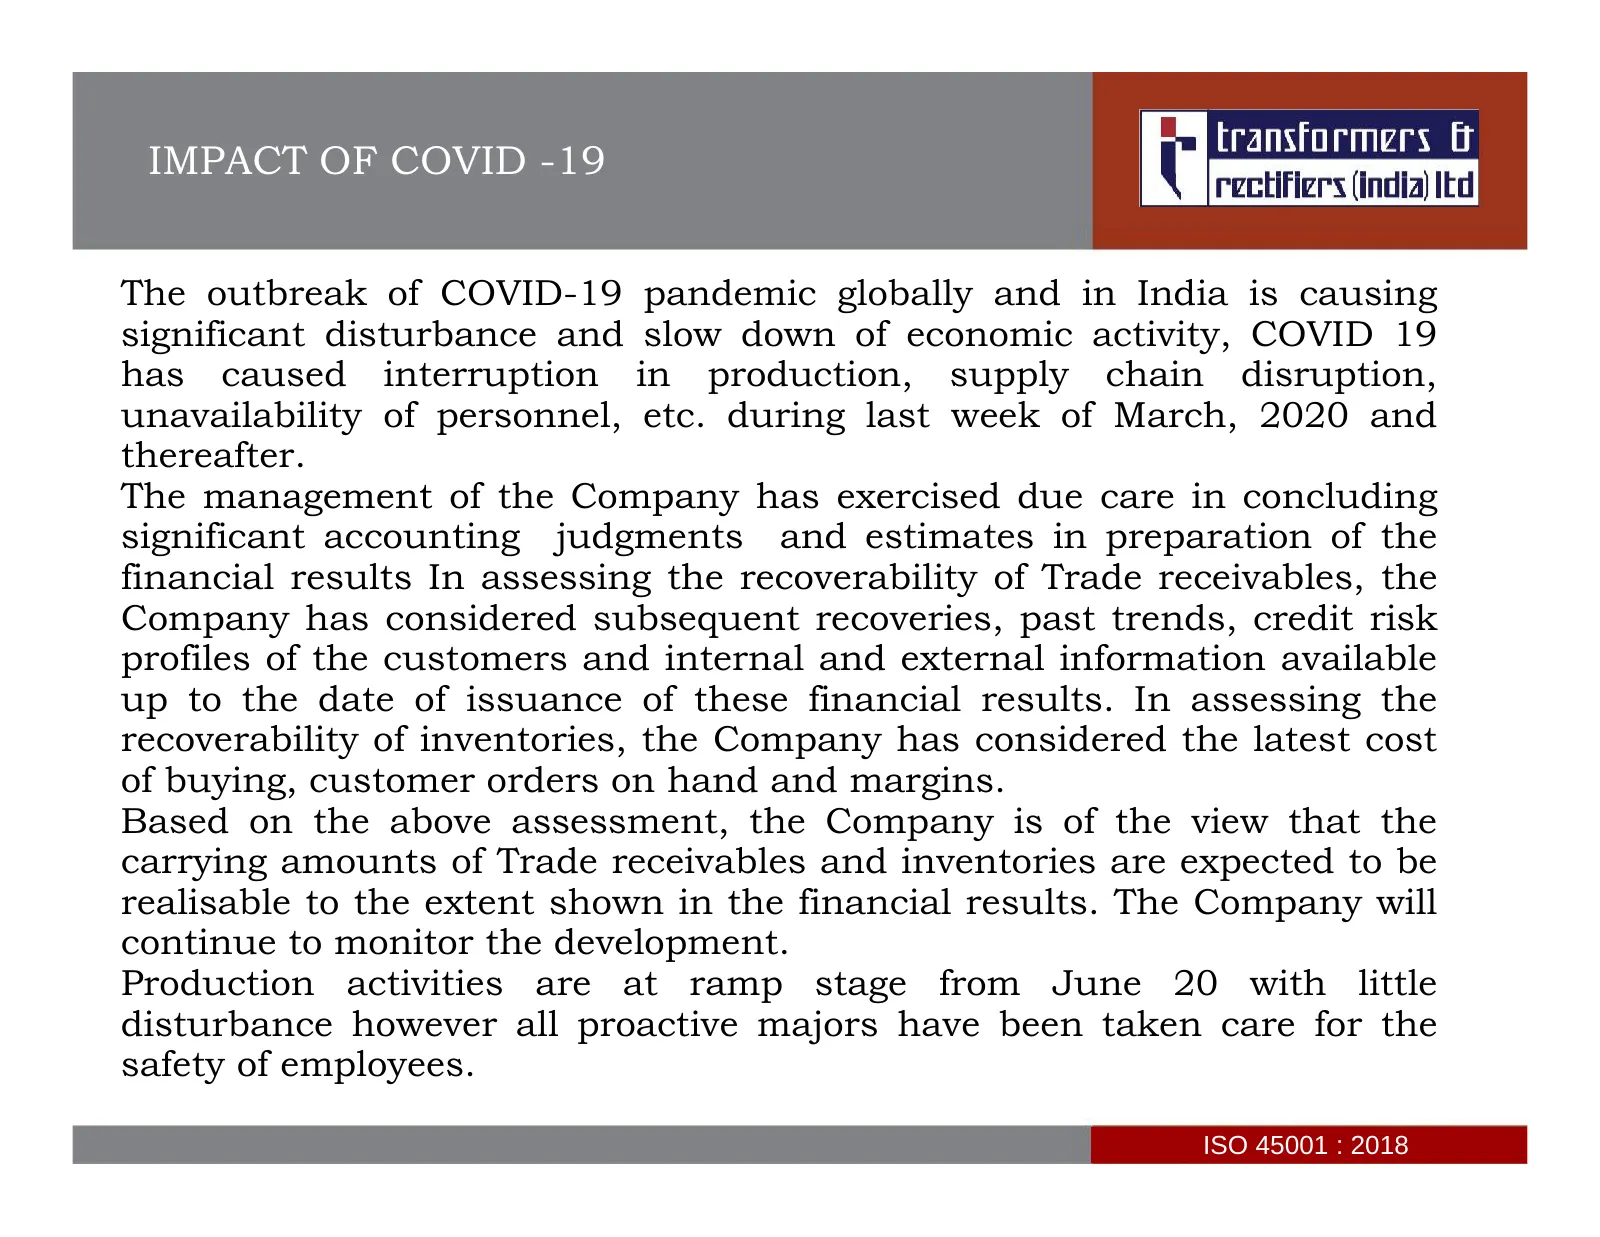
Slide 11: Impact of COVID-19
IMPACT OF COVID -19 The outbreak of COVID-19 pandemic globally and in India is causing significant disturbance and slow down of economic activity, COVID 19 has caused interruption in production, supply chain disruption, unavailability of personnel, etc. during last week of March, 2020 and thereafter
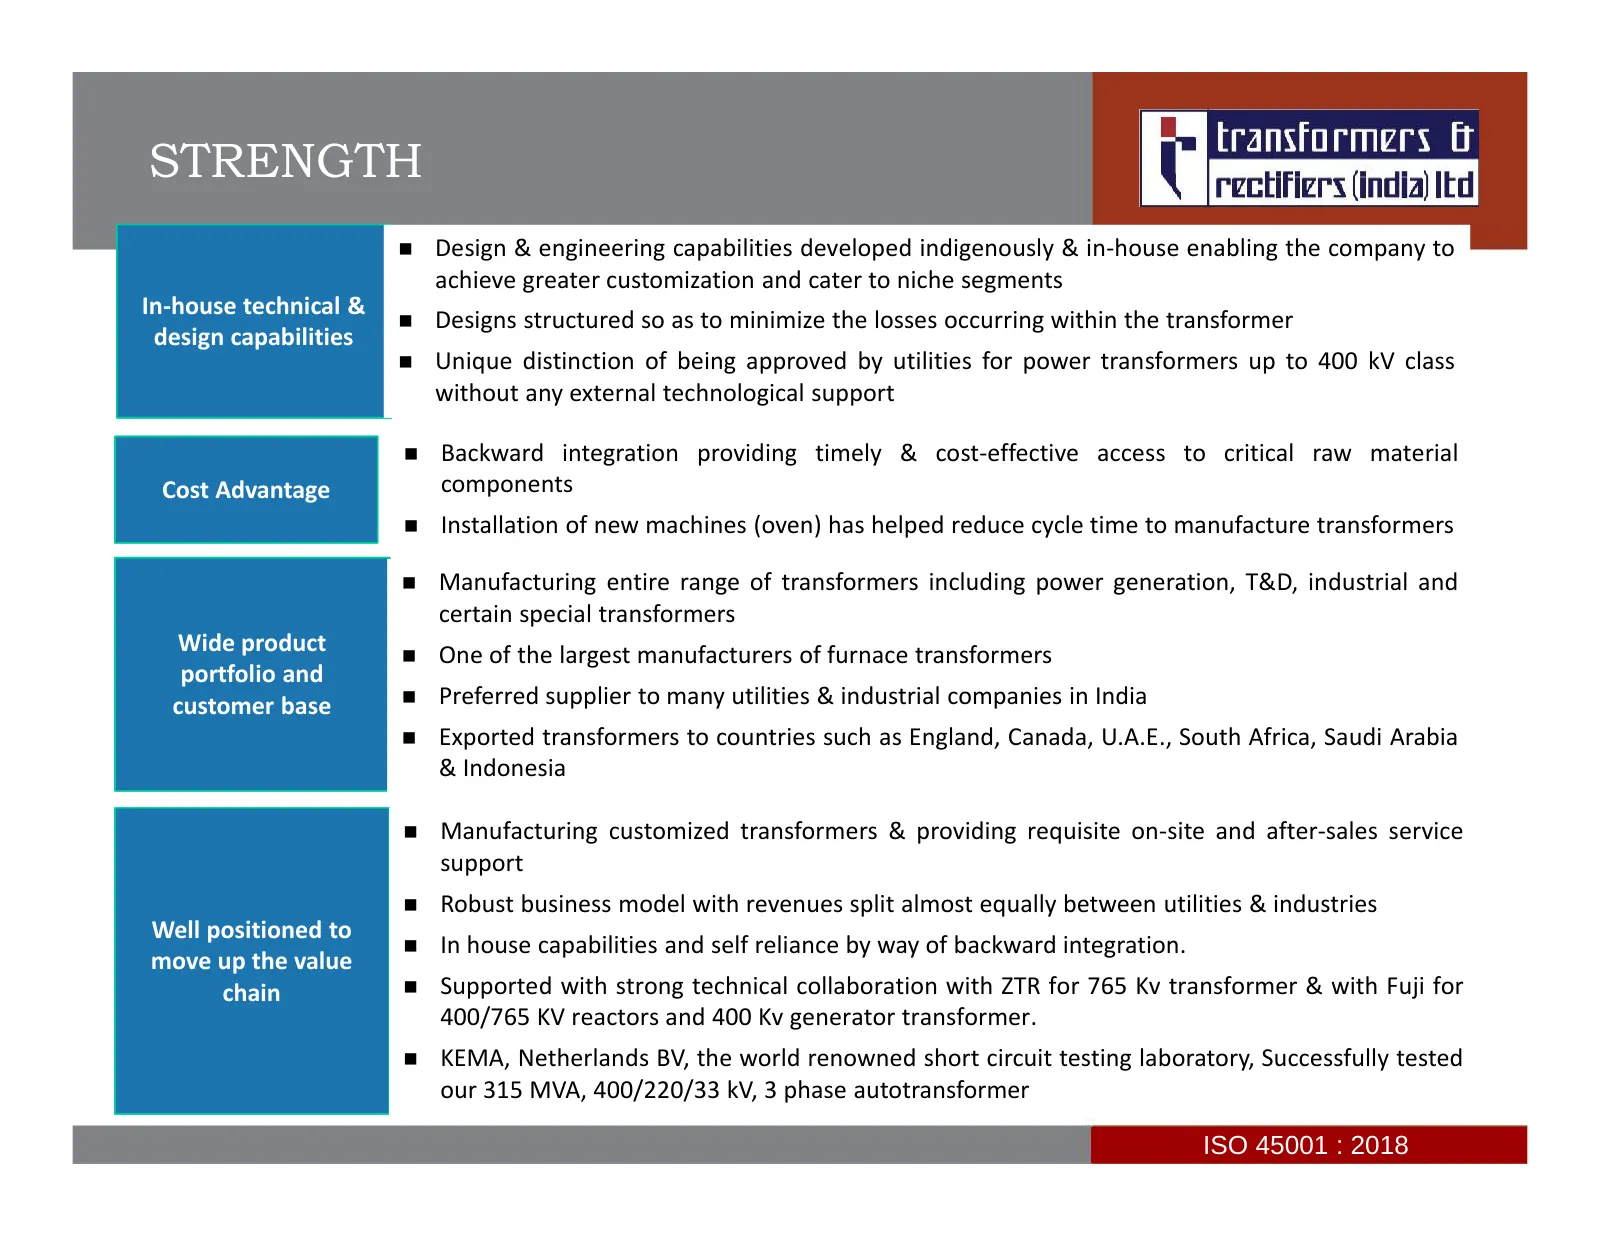
Slide 12: Strength
STRENGTH Design & engineering capabilities developed indigenously & in-house enabling the company to achieve greater customization and cater to niche segments In-house technical & Designs structured so as to minimize the losses occurring within the transformer design capabilities Unique distin
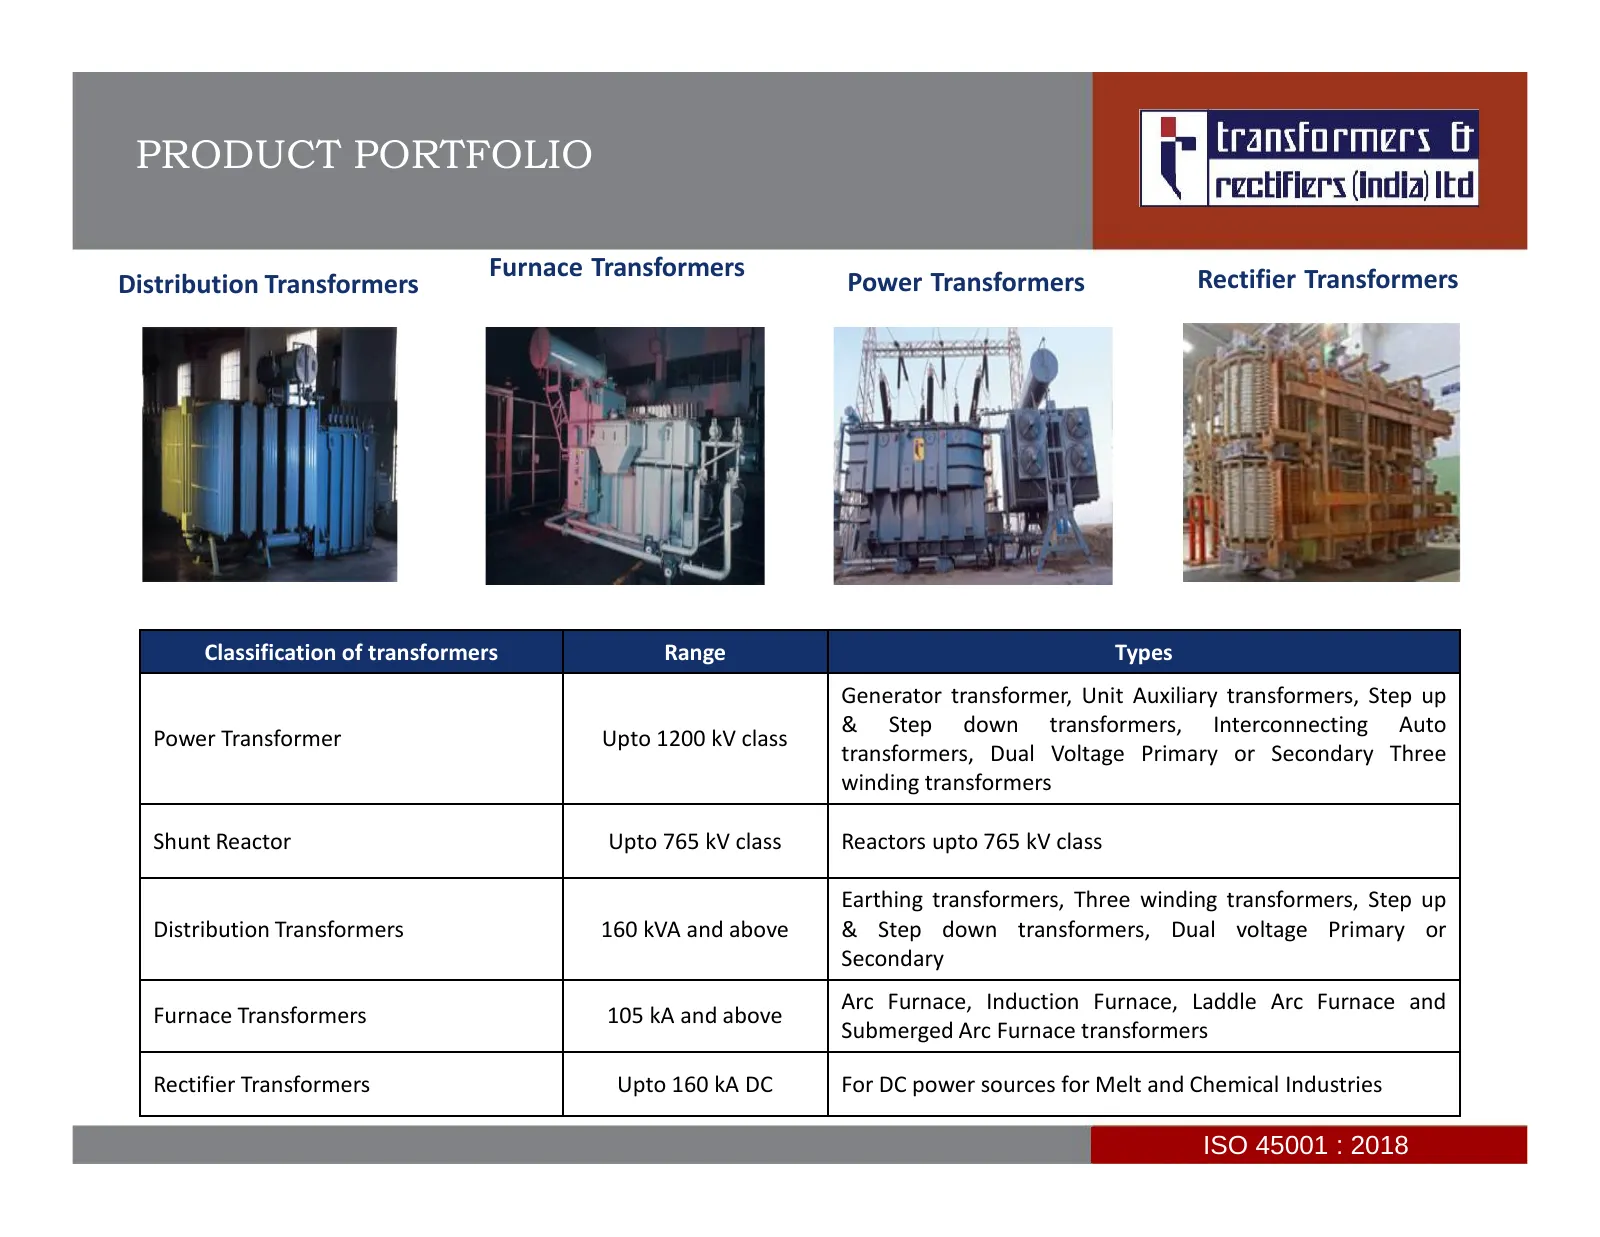
Slide 13: Product Portfolio
PRODUCT PORTFOLIO Furnace Transformers Rectifier Transformers Distribution Transformers Power Transformers Classification of transformers Range Types Generator transformer, Unit Auxiliary transformers, Step up & Step down transformers, Interconnecting Auto Power Transformer Upto 1200 kV class transf
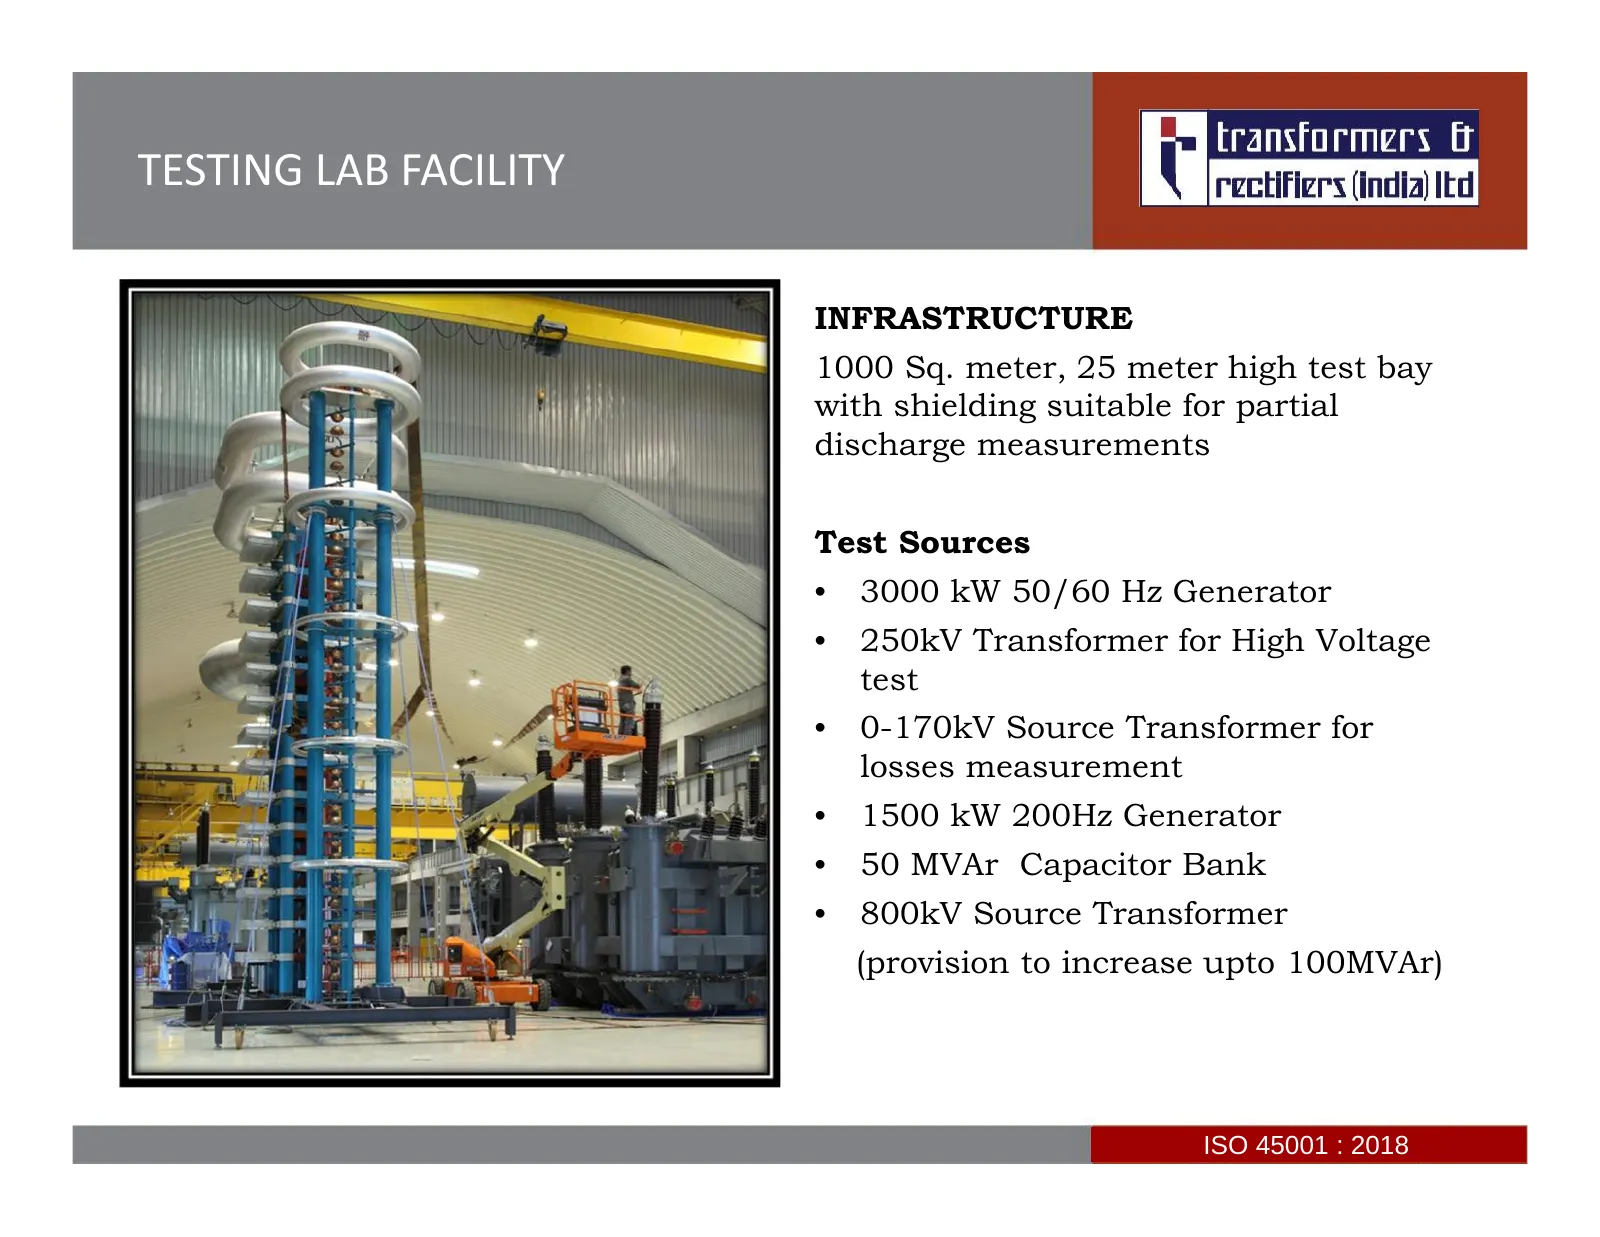
Slide 14: Testing Lab Facility
TESTING LAB FACILITY INFRASTRUCTURE 1000 Sq. meter, 25 meter high test bay with shielding suitable for partial discharge measurements Test Sources • 3000 kW 50/60 Hz Generator • 250kV Transformer for High Voltage test • 0-170kV Source Transformer for losses measurement • 1500 kW 200Hz Generator • 50
Slide 15: Thank You
An ISO 9001:2015, ISO 14001:2015 & ISO 45001 : 2018 CERTIFIED THANK YOU www.transformerindia.com
Source: Internet Archive copy of transformerindia.com
More decks from Transformers and Rectifiers (India) Limited
 Q2 FY27 Earnings Presentation36 slides · Oct 13, 2026
 Q1 FY27 Earnings Presentation35 slides · Jul 20, 2026
 Q1 FY27 Earnings Presentation36 slides · Jul 20, 2026
 Q4 FY26 Earnings Presentation25 slides · Apr 21, 2026
 Q4 FY26 Earnings Presentation26 slides · Apr 21, 2026
 Q3 FY26 Earnings Presentation20 slides · Jan 8, 2026