
Corporate and Business Update
(Issued by Hibiscus Petroleum Berhad ("Hibiscus Petroleum" or the "Group") in conjunction with the Quarterly Report for the Financial Quarter Ended 31 March 2026 ("Current Quarter"))
Kuala Lumpur, 22 May 2026 - 12.30pm
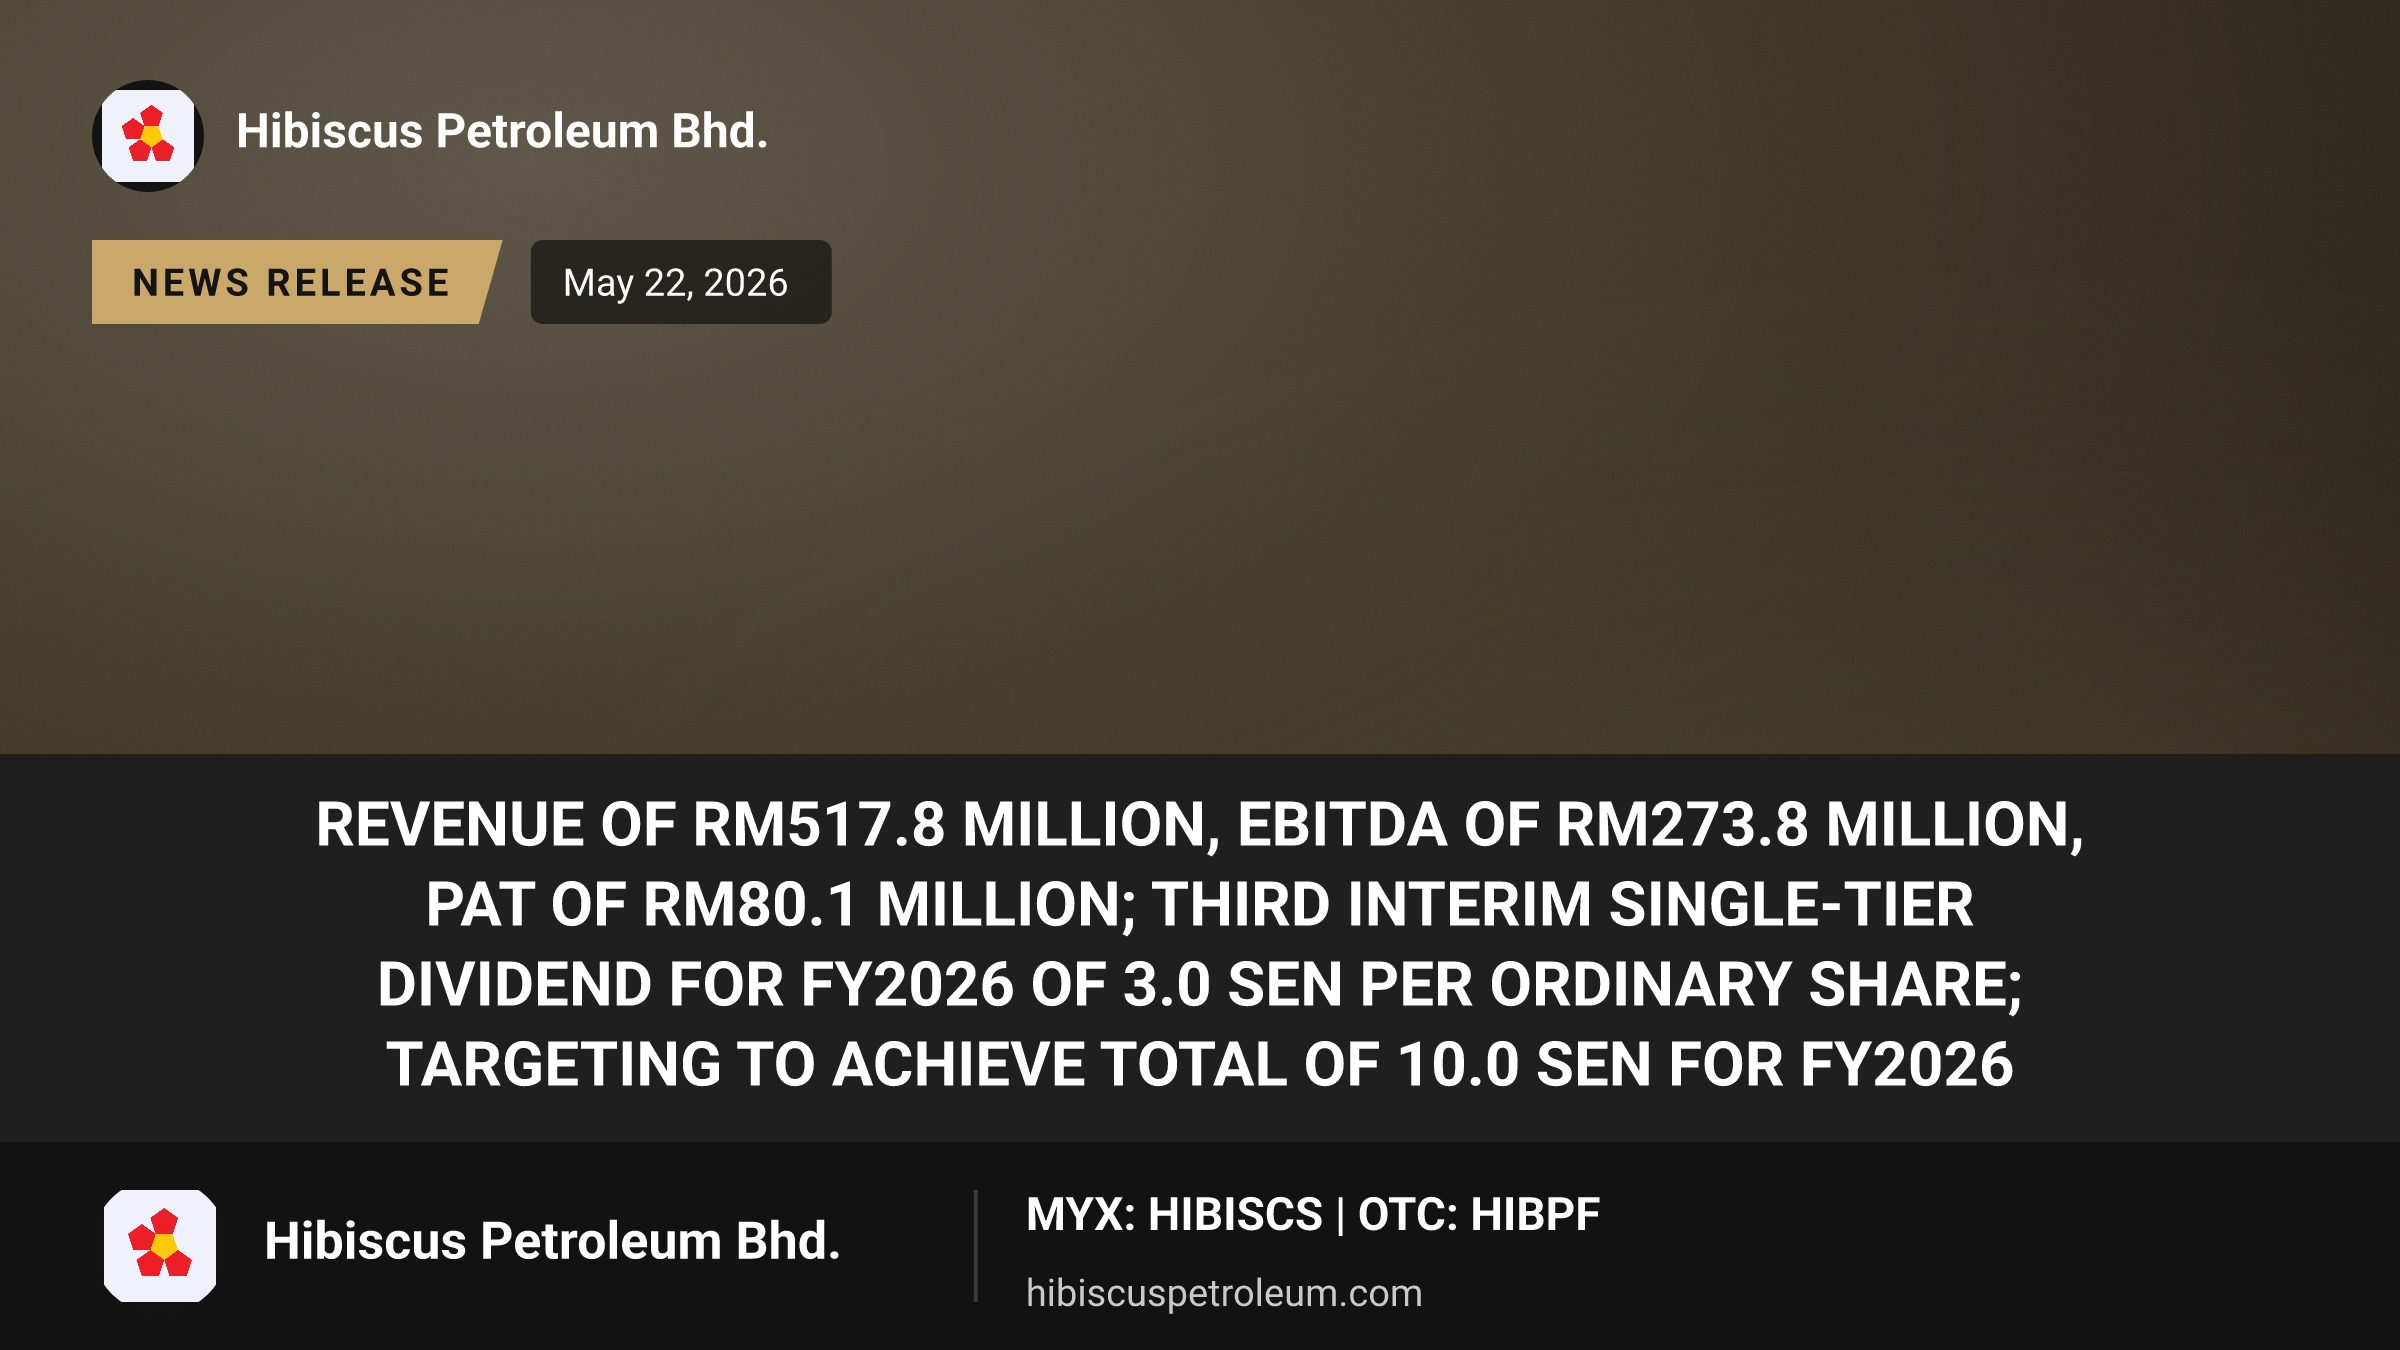
- Revenue of RM517.8 Million, EBITDA of RM273.8 Million, PAT of RM80.1 Million
- Third Interim Single-Tier Dividend for FY2026 of 3.0 Sen Per Ordinary Share; Targeting to Achieve Total of 10.0 Sen for FY2026
- Brunei Low Pressure Compressor Project: Start-up in April 2026 with Incremental Net Production Over 1.5 kboe/day
- Oil & Gas Sales Volumes of 2.3 MMboe; Expected to Sell 9.2 MMboe in FY2026
Recorded earnings before interest, taxes, depreciation and amortisation ("EBITDA") of RM273.8 million and a profit after taxation ("PAT") of RM80.1 million, on the back of RM517.8 million revenue and an average realised oil and condensate price of USD76.7 per barrel ("bbl").
Declared a third interim single-tier dividend of 3.0 sen per ordinary share on 22 May 2026. Total dividends declared to date in respect of the financial year ending 30 June 2026 ("FY2026") stand at 7.0 sen per ordinary share. The Company targets to achieve a total dividend of 10.0 sen per ordinary share.
Brunei Low Pressure Compressor Project: Successfully & safely achieved start-up on 8 April 2026, with incremental net production in April & May 2026 of over 1,500 barrels of oil equivalent ("boe") per day, representing more than 30% increase over Brunei Block MLJ's average net production in the Current Quarter.
Produced an average of 26,251 boe per day of oil, condensate and gas net to the Group in the Current Quarter.
Sold 2.3 million boe ("MMboe") in the Current Quarter, comprising 1.2 million bbl ("MMbbl") of oil and condensate and 1.1 MMboe of gas, at an average realised oil, condensate and gas price of USD54.0/boe.
Impact of current Middle East conflict: Oil offtakes in April & May 2026 achieved average realised oil prices of over USD120/bbl.
This Corporate and Business Update ("CBU") covers business activities over the Current Quarter, key developments as of the release of this CBU and provides commentary on the operational and financial performance of the Group.
1
Operational Updates Current Reserves and ResourcesAs part of the Group's regular review of our reserves and resources, we recently undertook an independent assessment of the reserves of the PM3 CAA, North Sabah, Kinabalu, Teal West, PKNB and Marigold assets with the engagement of Tetra Tech RPS Energy Limited ("TTRPSE"). Figure 1 below depicts our updated net entitlement to oil, condensate and gas reserves and resources, as at 1 January 2026, within the licenses in which we have interests. Note that the independent assessment of the reserves of the Anasuria Cluster and Brunei Block B MLJ assets were conducted in August 2025.
Figure 1: Hibiscus Petroleum's net reserves and resources.
Notes to Figure 1:
1 Reserves and resources are as of 1 January 2026.
2 PM3 CAA and Kinabalu 2P Reserves and 2C Contingent Resources are based on Hibiscus Oil & Gas Malaysia ("HML")'s current estimated
net entitlement, based on TTRPSE's report of May 2026.
3 North Sabah 2P Reserves and 2C Contingent Resources are based on SEA Hibiscus Sdn Bhd ("SEA Hibiscus")'s current estimated net
entitlement, based on TTRPSE's report of May 2026.
4 Teal West 2P Reserves and 2C Contingent Resources are based on Anasuria Hibiscus UK Limited ("Anasuria Hibiscus UK")'s interest, based on TTRPSE's report of May 2026.
5 Block B MLJ, Anasuria and Block 46 Cai Nuoc 2P Reserves are based on internal estimates.
6 PKNB 2C Contingent Resources are based on HML's current estimated net entitlement, based on TTRPSE's report of May 2026.
7 Marigold, Sunflower, Kildrummy and Crown 2C Contingent Resources are based on Anasuria Hibiscus UK's interest, based on TTRPSE's report of May 2026.
8 Fyne 2C Contingent Resources are based on internal estimates.
Operational Performance in the Current QuarterFigure 2 below summarises the operational performance of the Group for the Current Quarter.
Unit | PM3 CAA | North Sabah | Kinabalu | Block B MLJ | Anasuria Cluster | Block 46 Cai Nuoc | Total or Average | |
Average uptime | % | 94 | 90 | 96 | 97 | 89 | 94 | - |
Average gross oil & condensate production | bbl/day | 15,396 | 12,801 | 8,303 | 1,336 | 4,683 | 385 | 42,904 |
Average net oil & condensate production | bbl/day | 3,341 | 4,736 | 3,363 | 501 | 1,649 | 164 | 13,754 |
Average gross gas export rate @ | boe/day | 29,810 | - | - | 12,041 | 698 | - | 42,549 |
Average net gas export rate @ | boe/day | 7,810 | - | - | 4,515 | 171 | - | 12,496 |
Average net oil, condensate and gas production rate | boe/day | 11,151 | 4,736 | 3,363 | 5,016 | 1,821 | 164 | 26,251 |
Total oil & condensate sold | bbl | 300,989 | 303,367 | 301,289 | 112,883 | 148,294 | - | 1,166,822 |
Total gas sold | MMscf | 4,225 | - | - | 2,438 | 93 | - | 6,756 |
boe | 704,235 | - | - | 406,386 | 15,420 | - | 1,126,041 | |
Total oil, condensate & gas sold | boe | 1,005,224 | 303,367 | 301,289 | 519,269 | 163,714 | - | 2,292,863 |
Average realised oil & condensate price | USD/bbl | 74.43 | 77.88 | 69.53 | 79.34 | 91.29 | - | 76.68 |
Average gas price | USD/Mscf | 5.89 | - | - | 3.47 | 10.24 | - | - |
Average realised oil, condensate and gas price | USD/boe | 47.04 | 77.88 | 69.53 | 33.54 | 88.47 | - | 53.98 |
Average production operational expenditure ("OPEX") per boe1 | USD/boe | 11.22 | 13.69 | 7.57 | 5.03 | 35.43 | n.m. | - |
Average net OPEX per boe2 | USD/boe | 16.30 | 19.15 | 11.73 | 5.03 | 35.43 | n.m. | 15.59 |
Figure 2: Summary of operational performance for the Current Quarter.
Notes to Figure 2:
1 This is computed based on gross production OPEX divided by gross oil, condensate and gas production.
2 This is computed as follows:
+ ( )
, ( )
@ Conversion rate of 6,000 standard cubic feet ("scf") per boe.
boe - bbl of oil equivalent. Mscf - thousand scf.
MMscf - million scf.
n.m. - not meaningful
Figures are subject to rounding.
FY2026 Oil and Condensate Offtake Schedule and Gas Sales OutlookFigure 3 below illustrates the Group's FY2026 oil and condensate offtakes and gas sales from our producing assets, together with the latest estimates for the financial quarter ending 30 June 2026 ("Q4 FY2026") and the financial quarter ending 30 September 2026 ("Q1 FY2027"). In summary, we estimate to sell a total of 2.5 MMboe and 2.9 MMboe of oil, condensate and gas in Q4 FY2026 and Q1 FY2027 respectively, net to the Group. Overall FY2026 sales volume is expected to be 9.2 MMboe.
Total net oil, condensate and gas sales volume (boe) | |||||||||||
Actual -Q1, Q2 & Q3 FY2026 | Latest Estimate - Q4 FY2026 | Latest Estimate - FY2026 | Latest Estimate - Q1 FY2027 | ||||||||
Apr 20261 | May 2026 | Jun 2026 | Total | Jul 2026 | Aug 2026 | Sep 2026 | Total | ||||
PM3 CAA | Oil & Cond. | 912,138 | - | 300,000 | - | 300,000 | 1,212,138 | - | - | 300,000 | 300,000 |
Gas | 2,125,966 | 228,000 | 248,000 | 245,000 | 721,000 | 2,846,966 | 224,000 | 160,000 | 215,000 | 599,000 | |
Kinabalu | Oil | 603,214 | - | 300,000 | - | 300,000 | 903,214 | - | - | 300,000 | 300,000 |
Block B MLJ | Condensate | 343,482 | - | - | - | - | 343,482 | - | 112,500 | - | 112,500 |
Gas | 1,193,842 | 160,311 | 192,197 | 181,347 | 533,855 | 1,727,697 | 194,471 | 174,287 | 188,933 | 557,690 | |
Block 46 | Oil | - | - | - | - | - | - | - | - | - | - |
North Sabah | Oil | 1,186,044 | 288,477 | - | 300,000 | 588,477 | 1,774,521 | - | 300,000 | - | 300,000 |
Anasuria Cluster | Oil | 337,937 | - | - | - | - | 337,937 | 147,000 | 97,000 | - | 244,000 |
Gas | 25,617 | 3,600 | 2,100 | 3,200 | 8,900 | 34,517 | 3,300 | 2,600 | 1,600 | 7,500 | |
Teal West | Oil | - | - | - | - | - | - | 204,000 | 305,000 | - | 509,000 |
Total | 6,728,241 | 680,388 | 1,042,297 | 901,547 | 2,452,232 | 9,180,473 | 772,771 | 1,151,387 | 1,005,533 | 2,929,690 | |
Oil & Cond. | 3,382,815 | 288,477 | 600,000 | 300,000 | 1,188,477 | 4,571,292 | 351,000 | 814,500 | 600,000 | 1,765,500 | |
Gas | 3,345,426 | 391,911 | 442,297 | 429,547 | 1,263,755 | 4,609,181 | 421,771 | 336,887 | 405,533 | 1,164,190 | |
Figure 3: The Group's net offtake schedule for Q4 FY2026 & Q1 FY2027.
Note to Figure 3:
1 Actual.
Production(Note: Block 46 Cai Nuoc has not been included in this section as its production is not material.)
Malaysia South China SeaNorth Sabah PSC: Production Operations
The table below provides a summary of key operational statistics for the North Sabah asset (50% participating interest held by SEA Hibiscus), for the Current Quarter and the prior three financial quarters:
Unit | January to March 20261 | October to December 2025 | July to September 2025 | April to June 2025 | |
Average uptime | % | 90 | 88 | 90 | 94 |
Average gross oil production | bbl/day | 12,801 | 13,005 | 13,263 | 12,999 |
Average net oil production | bbl/day | 4,736 | 4,812 | 4,907 | 4,809 |
Total oil sold | bbl | 303,367 | 588,359 | 294,318 | 617,747 |
Average realised oil price1 | USD/bbl | 77.88 | 69.20 | 73.93 | 72.57 |
Average production OPEX per bbl2 | USD/bbl | 13.69 | 23.67 | 14.77 | 21.97 |
Average net OPEX per bbl3 | USD/bbl | 19.15 | 32.13 | 20.98 | 30.49 |
Figure 4: Operational performance for the North Sabah asset.
Notes to Figure 4:
1 Figures for the period January 2026 to March 2026 are provisional and may change subject to the PSC Statement audit and PETRONAS's
review.
2 This is computed based on gross production OPEX divided by gross oil production.
3 This is computed as follows:
+ ( )
, ( )
Average gross oil production declined relative to the financial quarter ended 31 December 2025 ("Preceding Quarter"), largely due to unplanned outage of the St. Joseph main gas compressor (K-2400) in March 2026, which is scheduled for restoration in mid-May 2026. Additionally, performance was constrained by lower-than-anticipated production from the South Furious 30-D11 well following its intervention in early 2026.
Average OPEX per bbl trended lower in the Current Quarter, reflecting a reduction in maintenance requirements alongside moderated activity levels within production enhancement and well integrity workstreams.
Net capital expenditure for the current quarter was RM0.5 million, mainly for the SF30 Water Flood Phase 2 development project.
Other updates: A subsidiary of the Company has been served with notice related to a claim by a Contractor alleging wrongful termination of a minor contract. The allegation is denied as the termination was within the contractual rights of the subsidiary and our subsidiary will defend our position appropriately. The financial exposure of this claim is viewed as not material by the Company.
Kinabalu Oil PSC: Production Operations
The table below provides a summary of key operational statistics for the Kinabalu asset (60% participating interest held by HML), for the Current Quarter and the prior three financial quarters:
Unit
January to March 20261
October to December 2025
July to September 2025
April to June 2025
Average uptime
%
96
89
63
85
Average gross oil production
bbl/day
8,303
8,151
5,959
7,657
Average net oil production
bbl/day
3,363
2,976
2,208
2,598
Total oil sold
bbl
301,289
-
301,925
308,822
Average realised oil price
USD/bbl
69.53
-
77.49
69.82
Average production OPEX per bbl2
USD/bbl
7.57
16.00
21.94
14.02
Average net OPEX per bbl3
USD/bbl
11.73
26.66
36.15
26.96
Figure 5: Operational performance for the Kinabalu asset.
Notes to Figure 5:
1 Figures for the period January 2026 to March 2026 are provisional and may change subject to the PSC Statement audit and PETRONAS's
review.
2 This is computed based on gross production OPEX divided by gross oil production.
3 This is computed as follows:
+ ( )
, ( )
Gross production in the Current Quarter increased relative to the Preceding Quarter, primarily driven by high facility uptime and consistent operational performance.
Lower average OPEX per bbl this quarter was achieved through a combination of increased production volumes and reduced spending on maintenance and subsurface activities.
Capital expenditure this quarter was RM1.4 million (net), essentially related to the Kinabalu Redevelopment project.
Commercial Arrangement AreaPM3 CAA PSC: Production Operations
The table below provides a summary of key operational metrics for the PM3 CAA asset, (35% participating interest held by HML and Hibiscus Oil & Gas Malaysia (PM3) Limited) for the Current Quarter and the prior three financial quarters:
Unit
January to
March 20261
October to
December 2025
July to
September 2025
April to
June 2025
Average uptime
%
94
94
79
94
Average gross oil & condensate production
bbl/day
15,396
16,343
13,920
16,920
Average net oil & condensate production
bbl/day
3,341
3,546
2,998
2,864
Average gross gas export rate
boe/day
29,810
32,076
26,358
30,475
Average net gas export rate
boe/day
7,810
8,418
6,919
7,289
Average net oil, condensate & gas production rate
boe/day
11,151
11,964
9,917
10,153
Total oil & condensate sold
bbl
300,989
611,149
-
298,132
Total gas sold
MMscf
4,225
4,647
3,884
3,944
Average realised oil & condensate price
USD/bbl
74.43
68.51
-
76.68
Average realised gas price
USD/Mscf
5.89
4.28
4.90
5.17
Average production OPEX per boe2
USD/boe
11.22
11.24
18.76
14.13
Average net OPEX per boe3
USD/boe
16.30
16.73
27.18
23.72
Figure 6: Operational performance for the PM3 CAA asset.
Notes to Figure 6:
1 Figures for the period January 2026 to March 2026 are provisional and may change subject to the PSC Statement audit and PETRONAS's
review.
2 This is computed based on gross production OPEX divided by gross oil, condensate, and gas production.
3 This is computed as follows:
+ ( )
, ( )
Average gross oil and condensate production decreased in the Current Quarter vs Preceding Quarter, attributable to increased water-cut in key wells, higher unplanned downtime and a reduction in condensate yields following lower gas sales volume.
Average gross gas exports declined by 7% compared to the Preceding Quarter, predominantly due to lower availability from mature, highly depleted wells.
Average OPEX per boe remained consistent with the Preceding Quarter due to reduced operating costs and activity coupled with decline in production volumes.
Capital expenditure: RM0.8 million (net) in the Current Quarter for costs related to Bunga Saffron development and other minor capex projects.
Brunei DarussalamBlock B Maharajalela Jamalulalam ("MLJ")
The table below provides a summary of the key operational metrics for the Brunei Block B MLJ asset (37.5% participating interest held by Hibiscus EP (Brunei) B.V. ("Hibiscus Brunei")) for the Current Quarter and the prior three financial quarters:
Unit
January to
March 2026
October to December 2025
July to September 2025
April to June 2025
Average uptime
%
97
92
72
86
Average gross oil & condensate production
bbl/day
1,336
1,863
1,683
1,667
Average net oil & condensate production
bbl/day
501
699
631
625
Average gross gas export rate
boe/day
12,041
12,694
10,131
12,892
Average net gas export rate
boe/day
4,515
4,760
3,799
4,835
Average net oil, condensate & gas production rate
boe/day
5,016
5,459
4,430
5,460
Total condensate sold
bbl
112,883
112,694
117,905
-
Total gas sold
MMscf
2,438
2,628
2,097
2,640
Average realised oil & condensate price
USD/bbl
79.34
67.55
73.56
-
Average realised gas price
USD/Mscf
3.47
3.90
3.96
4.53
Average production OPEX per boe1
USD/boe
5.03
5.49
15.00
7.62
Figure 7: Operational performance for the Block B MLJ asset.
Note to Figure 7:
1. This is computed based on gross production OPEX divided by gross oil, condensate, and gas production.
Production:
Production facilities remained healthy, achieving an uptime of 97% in the Current Quarter.
Average production rate for the Current Quarter was higher than forecasted due to lower unplanned deferments and better well performance. Production was lower than the Preceding Quarter predominantly due to reservoir natural decline.
OPEX/boe was lower compared to the Preceding Quarter due to lower activity levels during the monsoon season. Activities will ramp up in Q4 FY2026 and Q1 FY2027 as per the asset's integrated plan.
Low-Pressure Compressor ("LPC") Project:
Project Start Up was safely achieved on 8 April 2026, followed by the completion of a 72-hour Compressor Endurance Test on 11 April at the first attempt.
Significant increase in gas and condensate production of more than 30% over the Current Quarter's average was observed since the start-up of the Low Pressure Compressor, and well performance is currently being monitored and analysed.
Remaining project activities, including close-out of project punch list items, are scheduled to be completed by early July.
Figure 8: Impact to production from LPC project start-up.
United Kingdom ("UK")Anasuria Cluster: Production Operations
The table below shows the operational performance achieved by the asset, based on Anasuria Hibiscus UK Limited's participating interest, for the Current Quarter and for the prior three financial quarters:
Unit
January to March 2026
October to December 2025
July to September 2025
April to June 2025
Average uptime
%
89
28
81
89
Average net oil production rate
bbl/day
1,649
674
1,609
1,985
Average net gas export rate @
boe/day
171
24
87
138
Average net oil equivalent production rate
boe/day
1,821
698
1,696
2,123
Total oil sold
bbl
148,294
-
189,643
160,379
Total gas exported (sold)
MMscf
93
13
48
76
Average realised oil price
USD/bbl
91.29
-
67.01
71.54
Average gas price
USD/Mscf
9.79∞/11.08#
9.6∞/9.07#
10.69∞/12.28#
11.3∞/12.81#
Average production OPEX per boe1
USD/boe
35.43
164.83
48.09
33.96
Figure 9: Operational performance for the Anasuria asset.
Notes to Figure 9:
1 This is computed based on gross production OPEX divided by gross oil and gas production. @ Conversion rate of 6,000 scf per boe.
∞ For Cook field.
# For Guillemot A, Teal and Teal South fields. Figures are subject to rounding.
Production in the Current Quarter is higher than the Preceding Quarter, primarily due to the resumption of production from the Cook well since 31 December 2025, after being shut-in in October 2025.
The Current Quarter's OPEX/boe is much lower than the Preceding Quarter primarily due to:
higher production with the reinstatement of the Cook well; and
lower OPEX as the Preceding Quarter's diesel usage and UK Emissions Trading Scheme market prices were higher.
Capital expenditure: RM1.9 million, primarily for the upgrade and replacement of facilities on the Anasuria FPSO.
Teal West Development (Licence P2535)
Mobilisation of the Construction Support Vessel completed with the vessel at the field on 14 April 2026.
Production riser pull-in, flowline tie-in to the Teal West tree and umbilical installation completed.
Subsea campaign for First Oil is planned to be completed by end-June 2026, including ROV support vessel for tie in and commissioning works, followed by First Oil.
Greater Marigold Area Development (GMAD)
Currently progressing consultation period with the North Sea Transition Authority ("NSTA") (i.e. providing responses to the NSTA's comments), targeting GMAD Concept Select Report ("CSR") no objection in May 2026.
Target to complete selection of an FPSO by Q2 Calendar Year ("CY") 2026, followed by Field Development Plan ("FDP") and Environmental Statement documentation submission by Q3 CY2026.
First oil is expected to be in 2030.
With the Middle East conflict in its third month (as of the date of this CBU), the Group has put in place plans to capitalise from current market conditions and play a small part in increasing the region's energy supply. We are also seeing greater oil price premiums offered for our offtakes as our geographic location is favourable during conflict. The higher oil prices have also allowed us to reward our shareholders with an increased interim dividend, in line with our guidance, with the Group targeting to achieve a total of 10.0 sen per ordinary share for FY2026.
The successful start-up of the Brunei LPC project marks an important step towards our 2026 Mission. With Teal West first oil on track for mid-CY2026 as scheduled, together with additional production enhancement projects, we expect to hit our 35,000 boe/day net production target by the end of CY2026.
Looking further out, towards the Group's 2030 Mission, the PKNB Cluster PSC will be developed in 2 phases. Phase 1 will involve the development of the Pertang and Kenarong fields, with Phase 2 focused on the Noring and Bedong fields. The FDP and Final Investment Decision for Phase 1 is expected in CY2026, with first gas in CY2028.
Together with our external financial advisors, we are continuing discussions with potential Strategic Investors, in an effort to secure an optimum commercial proposal to bring to our shareholders.
The abovementioned initiatives are aimed at enhancing shareholder value and ensuring a sustainable future ahead.
By Order of the Board of Directors Hibiscus Petroleum Berhad
22 May 2026